. 2023 Oct 25;6(1):fcad293.
doi: 10.1093/braincomms/fcad293. eCollection 2024.

Computational identification of long non-coding RNAs associated with graphene therapy in glioblastoma multiforme

Affiliations

Computational identification of long non-coding RNAs associated with graphene therapy in glioblastoma multiforme

Zhuoheng Zou et al. Brain Commun. .

Abstract

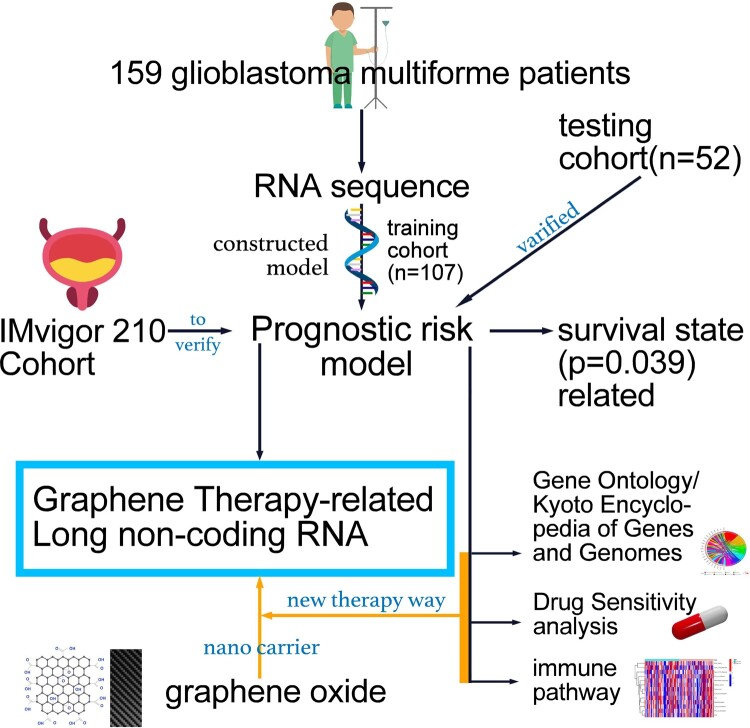
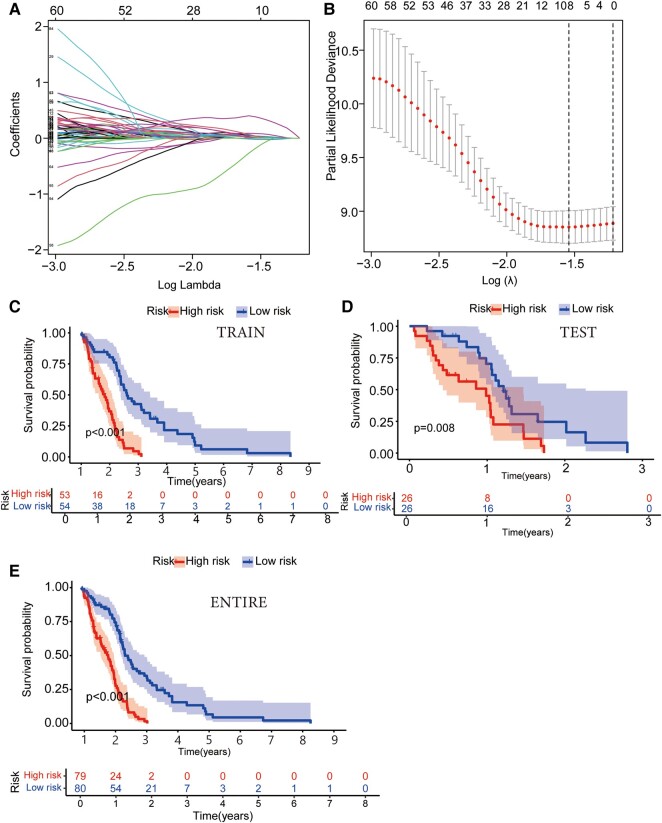
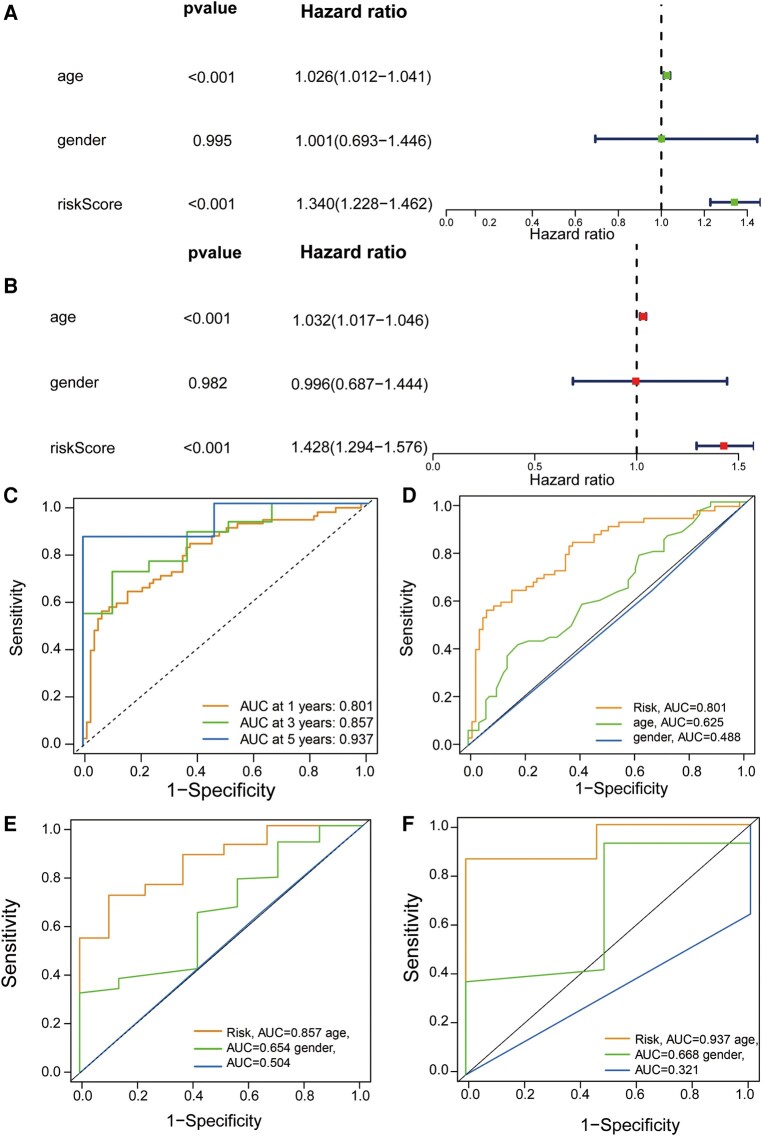
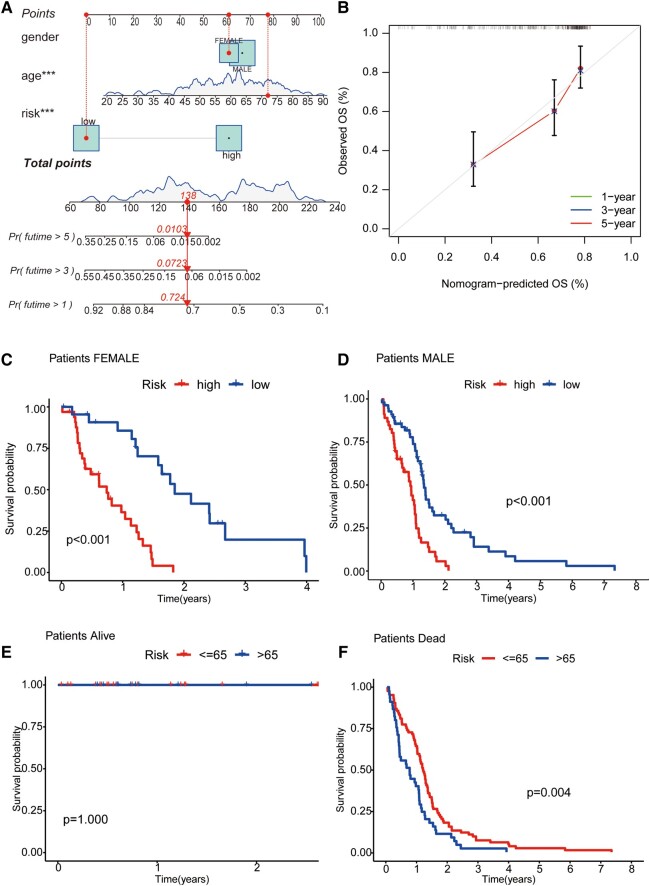
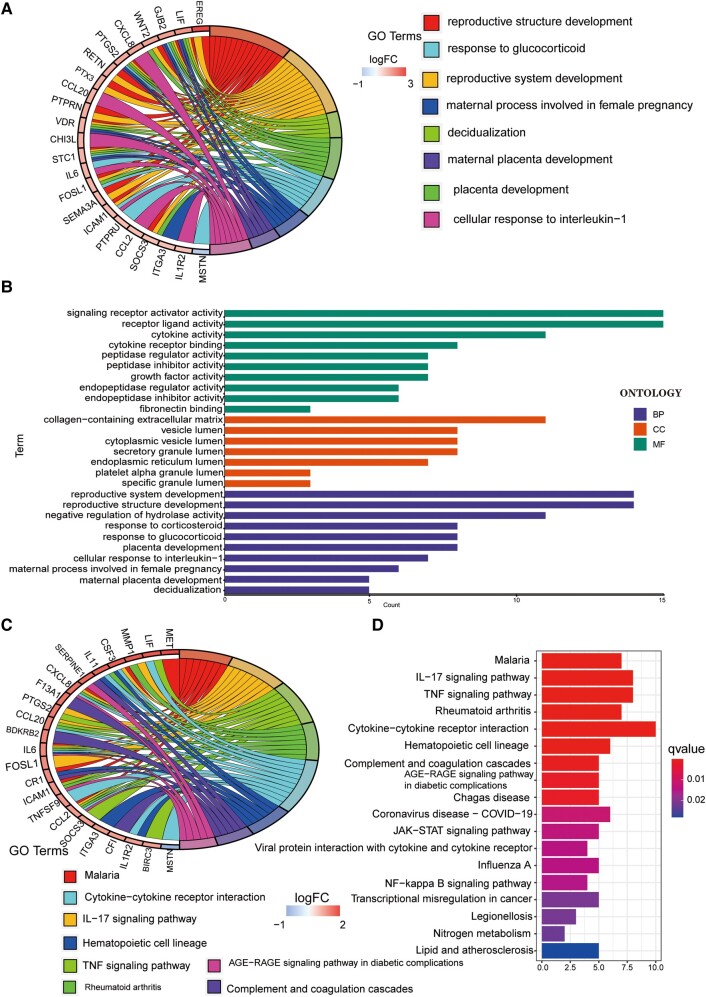
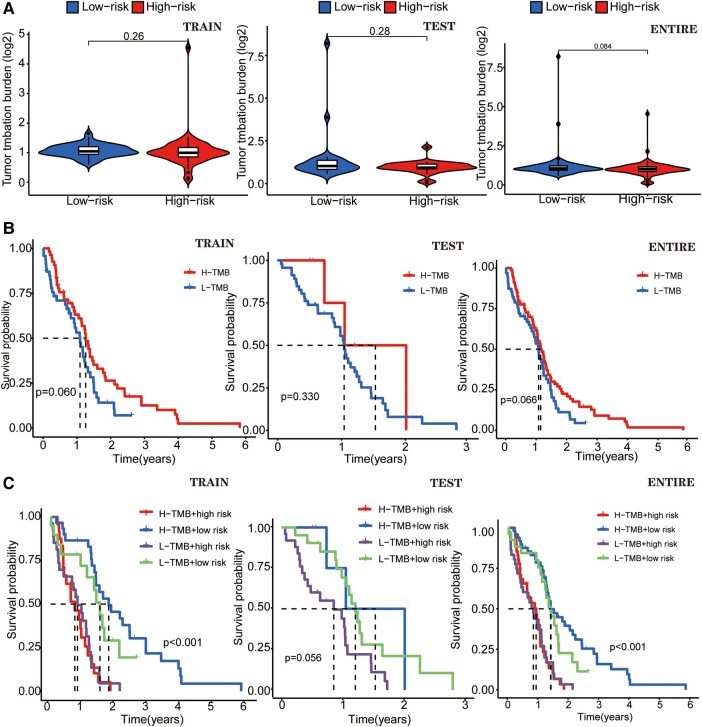
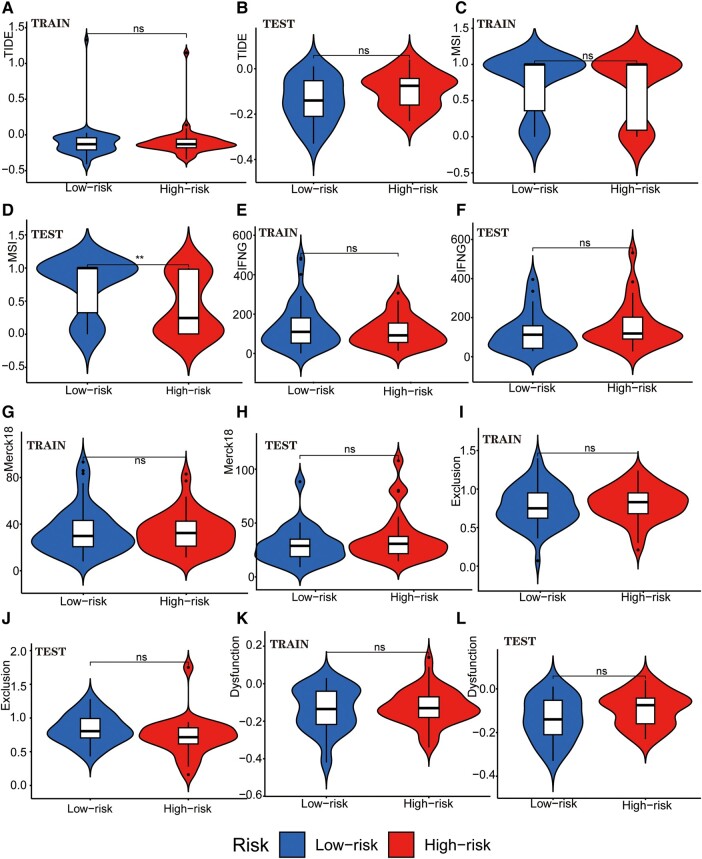
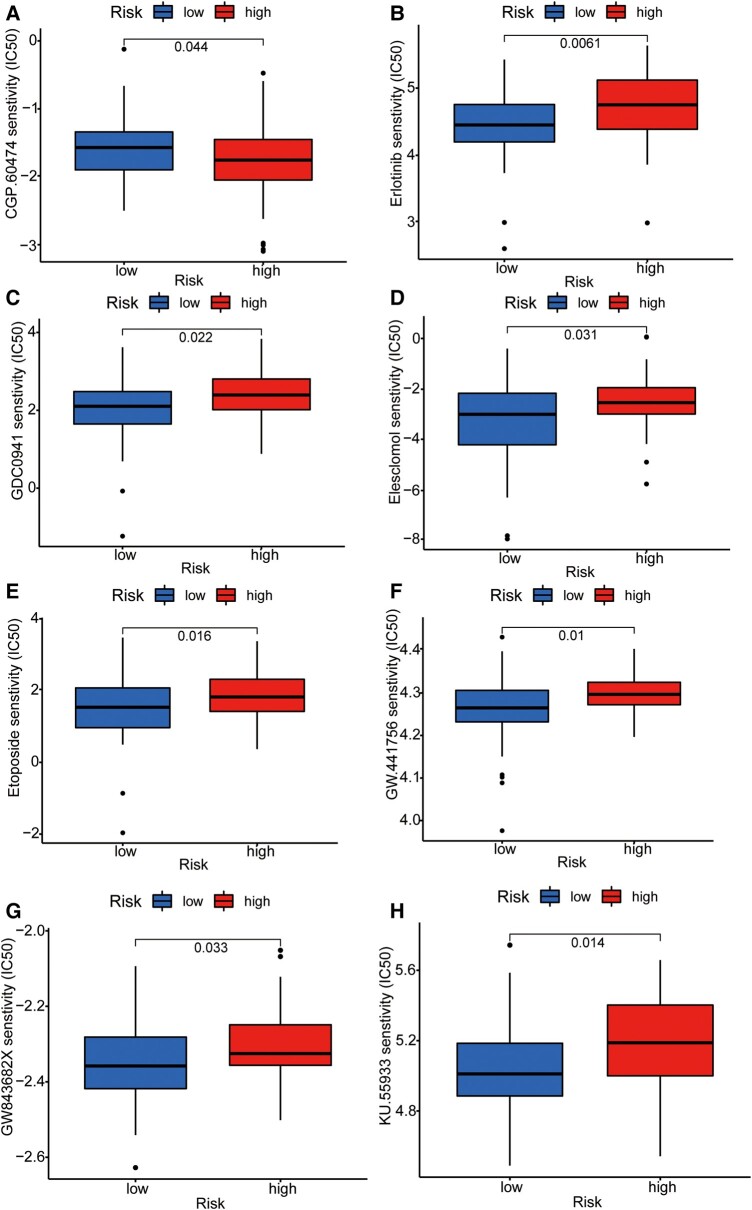
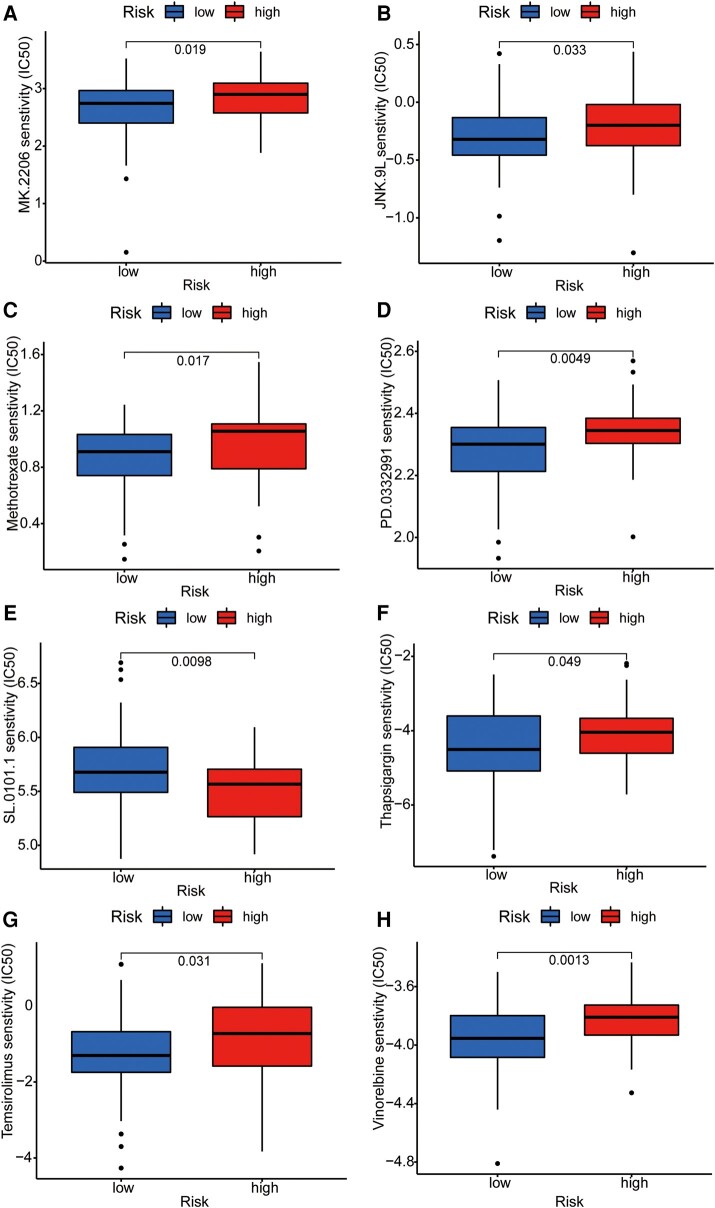
Glioblastoma multiforme represents the most prevalent primary malignant brain tumour, while long non-coding RNA assumes a pivotal role in the pathogenesis and progression of glioblastoma multiforme. Nonetheless, the successful delivery of long non-coding RNA-based therapeutics to the tumour site has encountered significant obstacles attributable to inadequate biocompatibility and inefficient drug delivery systems. In this context, the use of a biofunctional surface modification of graphene oxide has emerged as a promising strategy to surmount these challenges. By changing the surface of graphene oxide, enhanced biocompatibility can be achieved, facilitating efficient transport of long non-coding RNA-based therapeutics specifically to the tumour site. This innovative approach presents the opportunity to exploit the therapeutic potential inherent in long non-coding RNA biology for treating glioblastoma multiforme patients. This study aimed to extract relevant genes from The Cancer Genome Atlas database and associate them with long non-coding RNAs to identify graphene therapy-related long non-coding RNA. We conducted a series of analyses to achieve this goal, including univariate Cox regression, least absolute shrinkage and selection operator regression and multivariate Cox regression. The resulting graphene therapy-related long non-coding RNAs were utilized to develop a risk score model. Subsequently, we conducted Gene Ontology and Kyoto Encyclopedia of Genes and Genomes pathway analyses on the identified graphene therapy-related long non-coding RNAs. Additionally, we employed the risk model to construct the tumour microenvironment model and analyse drug sensitivity. To validate our findings, we referenced the IMvigor210 immunotherapy model. Finally, we investigated differences in the tumour stemness index. Through our investigation, we identified four promising graphene therapy-related long non-coding RNAs (AC011405.1, HOXC13-AS, LINC01127 and LINC01574) that could be utilized for treating glioblastoma multiforme patients. Furthermore, we identified 16 compounds that could be utilized in graphene therapy. Our study offers novel insights into the treatment of glioblastoma multiforme, and the identified graphene therapy-related long non-coding RNAs and compounds hold promise for further research in this field. Furthermore, additional biological experiments will be essential to validate the clinical significance of our model. These experiments can help confirm the potential therapeutic value and efficacy of the identified graphene therapy-related long non-coding RNAs and compounds in treating glioblastoma multiforme.

Keywords: drug screening; glioblastoma multiforme; graphene oxide therapy; independent prognostic model; lncRNAs.


Conflict of interest statement

The authors report no competing interests.

Figures

Graphical Abstract
Graphical Abstract
Figure 1
Figure 1
Identification of target genes using LASSO Cox regression analysis and assessment of survival probability in different risk groups of GBM patients. (A) Cross-verification of error curve via tuning parameters of OS-related proteins. This segment involves the utilization of tuning parameters associated with OS-related proteins. The objective is to cross-verify the error curve, thereby ensuring the robustness and reliability of the analysis. (B) Calculation of minimum criteria using perpendicular imaginary lines: a LASSO Cox regression analysis employing perpendicular imaginary lines is applied to establish the minimum criteria, which aids in accurately determining the crucial thresholds and boundary points for further research. (C–E) The Kaplan–Meier survival curve analysis illustrated differences in the survival probability of GBM patients of different risk groups in training (n = 107; P < 0.001), testing (n = 51; P = 0.008) and entire groups (n = 159; P < 0.001). The function calculates and displays the log-rank test P-value for the survival difference between the risk groups.
Figure 2
Figure 2
Assessment of GTLncSig risk model’s independent prognostic value and performance and ROC curves. (A) Exploration through univariate Cox regression analysis encompasses an in-depth exploration via univariate Cox regression analysis and systematically examines the individual impact of diverse factors (age and risk score, P < 0.001) on survival outcomes, enabling the identification of noteworthy contributors to patient prognosis. (B) The multivariate Cox regression analysis shows the same result as the univariate Cox regression analysis (age and risk score, P < 0.001). It identifies the clinical variables significantly affecting patient survival using univariate and multivariate Cox proportional hazards models. It visually represents hazard ratios, confidence intervals and P-values, aiding in the interpretation of variable significance. (C) The receiver operating characteristic curve of the optimal prognostic model (n = 594) for 1, 3 and 5 years shows AUC values of 0.801, 0.857 and 0.937, respectively. It is used to assess the quality of patients’ clinical independence, with over 0.5 being good. Risk scores are generally better than other factors as predictors, and other factors can be used as reference factors. The comparison of the receiver operating characteristic curves at 1 (D), 3 (E) and 5 years (F) with clinical features (risk n = 159; age and gender n = 594) are shown.
Figure 3
Figure 3
Nomogram and clinical grouping verification of GTLncSig model. (A) The risk score, age and gender are combined to construct a nomogram to predict the 1-year (0.724), 3-year (0.0723), and 5-year (0.0103) survival probability of GBM patients (n = 159), and it is getting less from 1 to 5 years. The nomogram calculates risk scores based on the Cox model’s coefficients. (B) The curve is used to estimate the accuracy of the nomogram. Calibration curves are generated for different time intervals (1, 3 and 5 years). (C) The consistency model is to predict the survival of female patients (n = 56, P < 0.001); (D) the survival of male patients (n = 103, P < 0.001); (E) the survival of patients alive (n = 30, P = 1); and (F) the survival of patients with dead (n = 129, P < 0.001). The log-rank test assesses whether there are significant differences in survival distributions between the groups, and the Kaplan–Meier estimates visualize the survival probabilities over time for each group.
Figure 4
Figure 4
GO/KEGG pathway for all differential genes between the high-risk and low-risk subgroups. (A and B) The GO pathway analysis, including 23 genes. GO enrichment analysis is performed on a gene list, filters and visualizes enriched terms and generates circular visualizations to represent relationships between enriched terms and genes. (C and D) The result of the KEGG pathway.
Figure 5
Figure 5
A different analysis of TMB of GTLncRNAs. (A) Boxplots and survival curves show no difference by using the χ2 test statistic, and the associated P-value (P > 0.05) in TMB analyses and visualizes the differences between the high-risk (n = 79) and low-risk (n = 80) subgroups. (B) Another survival curve illustrates the variability in survival time based on the TMB risk score. None of these curves exhibit statistical significance when assessed using the χ2 test statistic and the corresponding P-value (P > 0.05). (C) The survival of the TMB+ high-risk (n = 79) and low-risk (n = 80) groups in three different cohorts. In the training (n = 107) and the entire groups (n = 159), the results show differences (P < 0.001). The χ2 test statistic and the associated P-value are used to evaluate whether there are significant differences in survival experiences between different risk groups, and both groups illustrate that the H-TMB+ high-risk group has the most extended survival probability.
Figure 6
Figure 6
Tumour immune escape and immunotherapy analysis for GTLncRNAs. Analysis of the differences among TIDE (A and B), MSI (C and D), Interferon Gamma (IFNG, E and F), Merck 18 (G and H), Exclusion (I and J) and Dysfunction (K and L) in different risk subgroups. These methods are used to analyse and visualize the differences in TIDE scores between different risk groups for multiple TIDE score features (columns) using violin plots with added boxplots and statistical comparisons. Only one subgroup has significance: MSI in the testing group (n = 56, P < 0.01). The Wilcoxon rank-sum test (also known as the Mann–Whitney U test statistic) was used to compare whether the medians of two independent samples were significantly different. Significance labels (such as, ‘*’, ‘**’, ‘***’ and ‘ns’) are used to indicate the level of statistical significance, and there are no other specific statistical values. *P-value <0.05, **P-value <0.01, ***P value <0.001 and ns, no significance.
Figure 7
Figure 7
Tumour immune escape and immunotherapy analysis for GTLncRNAs. Analysis of the differences among CD274 (A and B), CD8 (C and D), TAM.M2 (E and F), MDSC (G and H) and CAF (I and J) in different risk subgroups. These methods are used to analyse and visualize the differences in TIDE scores between different risk groups for multiple TIDE score features (columns) using violin plots with added boxplots and statistical comparisons. Only a few subgroups have significance: CD274 in the testing group (n = 56, P < 0.05), MDSC in the testing group (n = 56, P < 0.001) and CAF in the training group (n = 103, P < 0.05). The Wilcoxon rank-sum test (also known as the Mann–Whitney U test statistic) was used to compare whether the medians of two independent samples were significantly different. Significance labels (such as, ‘*’, ‘**’, ‘***’ and ‘ns’) are used to indicate the level of statistical significance, and there are no other specific statistical values. *P–value <0.05, **P–value <0.01, ***P–value <0.001 and ns, no significance.
Figure 8
Figure 8
Sensitivity analysis of anti-tumour drugs based on GTLncSig. The analysis includes the differences in drug sensitivity (half-maximal inhibitory concentration values) between the risk groups for a list of predefined drugs. It involves pre-processing gene expression data, performing drug sensitivity predictions, conducting statistical tests and visualizing the results using boxplots with added statistical comparisons. Respectively, (A) CGP.60474, (B) Erlotinib, (C) GDC0941, (D) Elesclomol, (E) Etoposide, (F) GW.441756, (G) GW843682X, (H) KU.55933. The Wilcoxon rank-sum test statistic and the associated P-value are used to assess whether the distributions of sensitivity values for the high-risk (n = 79) and low-risk (n = 80) groups are significantly different. If the P-value is below 0.05, it suggests a statistically significant difference in drug sensitivities between the two risk groups.
Figure 9
Figure 9
Sensitivity analysis of anti-tumour drugs based on GTLncSig. The analysis includes the differences in drug sensitivity (half-maximal inhibitory concentration values) between the risk groups for a list of predefined drugs. It involves pre-processing gene expression data, performing drug sensitivity predictions, conducting statistical tests and visualizing the results using boxplots with added statistical comparisons. Respectively, (A) MK.2206, (B) JNK.9L, (C) Methotrexate, (D) PD.0332991, (E) SL.0101.1, (F) Thapsigargin, (G) Temsirolimus, (H) Vinorelbine. The Wilcoxon rank-sum test statistic and the associated P-value are used to assess whether the distributions of sensitivity values for the high-risk (n = 79) and low-risk (n = 80) groups are significantly different. If the P-value is below 0.05, it suggests a statistically significant difference in drug sensitivities between the two risk groups.

Similar articles

Cited by

References

    1. Li D, Hu X, Zhang S. Biodegradation of graphene-based nanomaterials in blood plasma affects their biocompatibility, drug delivery, targeted organs and antitumor ability. Biomaterials. 2019;202:12–25. - PubMed
    1. Yang J, He X, Chen L, Zhang Y. Thiol-yne click synthesis of boronic acid functionalized silica nanoparticle-graphene oxide composites for highly selective enrichment of glycoproteins. J Chromatogr A. 2017;1513:118–125. - PubMed
    1. Wang Z, Cheng H, Sheng Y, et al. Biofunctionalized graphene oxide nanosheet for amplifying antitumor therapy: Multimodal high drug encapsulation, prolonged hyperthermal window, and deep-site burst drug release. Biomaterials. 2022;287:121629. - PubMed
    1. Lu W, Yao J, Zhu X, Qi Y. Nanomedicines: Redefining traditional medicine. Biomed Pharmacother. 2020;134:111103. - PubMed
    1. Xu H, Fan M, Elhissi AM, et al. PEGylated graphene oxide for tumor-targeted delivery of paclitaxel. Nanomedicine (Lond). 2015;10(8):1247–1262. - PubMed

LinkOut - more resources