. 2023 Dec 13:16:1323449.
doi: 10.3389/fnmol.2023.1323449. eCollection 2023.

Severe central nervous system demyelination in Sanfilippo disease

Affiliations

Severe central nervous system demyelination in Sanfilippo disease

Mahsa Taherzadeh et al. Front Mol Neurosci. .

Abstract

Introduction: Chronic progressive neuroinflammation is a hallmark of neurological lysosomal storage diseases, including mucopolysaccharidosis III (MPS III or Sanfilippo disease). Since neuroinflammation is linked to white matter tract pathology, we analyzed axonal myelination and white matter density in the mouse model of MPS IIIC HgsnatP304L and post-mortem brain samples of MPS III patients.

Methods: Brain and spinal cord tissues of human MPS III patients, 6-month-old HgsnatP304L mice and age- and sex-matching wild type mice were analyzed by immunofluorescence to assess levels of myelin-associated proteins, primary and secondary storage materials, and levels of microgliosis. Corpus callosum (CC) region was studied by transmission electron microscopy to analyze axon myelination and morphology of oligodendrocytes and microglia. Mouse brains were analyzed ex vivo by high-filed MRI using Diffusion Basis Spectrum Imaging in Python-Diffusion tensor imaging algorithms.

Results: Analyses of CC and spinal cord tissues by immunohistochemistry revealed substantially reduced levels of myelin-associated proteins including Myelin Basic Protein, Myelin Associated Glycoprotein, and Myelin Oligodendrocyte Glycoprotein. Furthermore, ultrastructural analyses revealed disruption of myelin sheath organization and reduced myelin thickness in the brains of MPS IIIC mice and human MPS IIIC patients compared to healthy controls. Oligodendrocytes (OLs) in the CC of MPS IIIC mice were scarce, while examination of the remaining cells revealed numerous enlarged lysosomes containing heparan sulfate, GM3 ganglioside or "zebra bodies" consistent with accumulation of lipids and myelin fragments. In addition, OLs contained swollen mitochondria with largely dissolved cristae, resembling those previously identified in the dysfunctional neurons of MPS IIIC mice. Ex vivo Diffusion Basis Spectrum Imaging revealed compelling signs of demyelination (26% increase in radial diffusivity) and tissue loss (76% increase in hindered diffusivity) in CC of MPS IIIC mice.

Discussion: Our findings demonstrate an important role for white matter injury in the pathophysiology of MPS III. This study also defines specific parameters and brain regions for MRI analysis and suggests that it may become a crucial non-invasive method to evaluate disease progression and therapeutic response.

Keywords: GM3 ganglioside; diffusion basis spectrum imaging; lysosomal storage; mucopolysaccharidosis; myelination; oligodendrocyte.


Conflict of interest statement

AVP was a shareholder and received honoraria and research contracts from Phoenix Nest Inc involved in development of therapies for MPS IIID and IIIC. The remaining authors declare that the research was conducted in the absence of any commercial or financial relationships that could be construed as a potential conflict of interest.

Figures

FIGURE 1
FIGURE 1
Myelin-associated proteins MBP, MAG, and MOG are reduced in the CC of MPS IIIC compared with WT mice, suggesting myelin loss. (A) Panels show representative images of the CC of 6-month-old WT and MPS IIIC mice (left) and three-dimensional (3D) enlarged images of the areas marked by yellow boxes (right). MBP + areas (green) on the surface of NF-M + axons (red) are reduced. The graphs show quantification of MBP + and NF-M + areas by ImageJ software. (B) Immunoblotting shows trend for reduction of MBP in the total brain homogenates of MPS IIIC mice. (C) IHC analysis reveals a reduction of MAG and MOG in CC of MPS IIIC mice compared with WT mice. Graphs show quantification of MAG + and MOG + stained area by ImageJ software. (D) Western blots of total protein extracts from brains of 6-month-old MPSIIIC mice confirm reduction of MAG. The graph shows intensities of MAG immunoreactive bands, quantified with ImageJ software and normalized by the intensity of tubulin immunoreactive bands. (E) No significant differences in MBP labeling in the cortex are detected by IHC between MPS IIIC and WT mice. (F) Level of MAG (green) labeling is reduced in the cortex of MPS IIIC compared with WT mice, while MOG (red) labeling shows only a non-significant trend for decrease. In all panels DAPI (blue) was used as a nuclear counterstain and scale bars equal 10 μm. All graphs show individual data, means and SD obtained for three mice per genotype. P-values were calculated using an unpaired t-test (*P < 0.05; **P < 0.01, ns, non-significant).
FIGURE 2
FIGURE 2
Microglial activation and white matter changes in the lumbar spinal cord of 6-month-old MPS IIIC mice. Representative images of immunostaining for the microglial marker CD68 (red) and myelin basic protein (MBP green) in the lumbar cord of 6-month-old HgsnatP304L (MPS IIIC) mice and age-matched WT mice. Numerous CD68 immunoreactive microglia with enlarged cell soma are present in the gray and white matter of the dorsal and ventral horn of MPS IIIC mice but are virtually absent in WT mice at this age. Compared to age-matched WT mice, MBP immunoreactivity is moderately reduced in the dorsal funiculus of 6-month-old MPS IIIC mice, but unchanged in the ventral funiculus. Quantitative thresholding image analysis confirmed these observations revealing significantly elevated CD68 immunoreactivity in the dorsal and ventral horn of 6-month-old MPS IIIC vs. age-matched WT mice. Similarly, there was significantly less MBP immunoreactivity in the dorsal funiculus of 6-month-old MPS IIIC vs. age-matched WT mice, but no significant change in the ventral funiculus. All graphs show individual data, means and SD obtained for two mice per genotype. P-values were calculated using an unpaired t-test (*P < 0.05; ns, non-significant).
FIGURE 3
FIGURE 3
Transmission electron microscopy reveals reduced myelin thickness, decreased number of myelinated axons, structural defects in myelin sheaths and axonal swelling in the corpus callosum of MPS IIIC mouse. Panels (A,B) show representative TEM images of CC of 6-month-old MPS IIIC and WT mice taken at lower (2000X) and higher (4000X) magnifications, respectively. Scale bars equal 2 mm (A) and 1 mm (B). (C) The graph shows quantification of myelinated axon density (mean number of myelinated axons per square millimeter) in CC of WT and MPS IIIC mice. (D) G-ratio values for myelinated axons in CC of MPS IIIC mice are significantly higher than those for axons of WT mice. (E) Axonal diameters are similar in WT and MPS IIIC mice. (F) Scatter plot depicting g-ratio vs. axonal diameter values. Graphs in panels (D,E) show individual values, means and SD and in the panel (F) individual values and linear regression plots. Sections from 3 mice per genotype (50 randomly selected axons per mouse) were analyzed. P values were calculated using t-test; **P < 0.01; ****P < 0.0001; and ns, non significant. (G) Electron micrographs show an absence of pathological changes in the axons of WT mice. In contrast, degenerated axons with empty myelin sheath and split myelin (red arrow), as well as large axonal swellings containing accumulating vesicles (yellow arrowheads), are observed in MPS IIIC mice.
FIGURE 4
FIGURE 4
Microglia in CC of MPS IIIC but not of WT mice show lysosomal accumulation of myelin fragments and GAGs. (A) Panels show representative confocal microscopy images of CC tissue of 6-month-old WT and MPS IIIC mice labeled with antibodies against GFAP (green) and CD68 (red), markers for astrocytes and activated microglia, respectively. DAPI (blue) was used as a nuclear counterstain. Scale bar equals 50 μm. Graph shows quantification of GFAP + and CD68 + areas. Individual values, means and SD (n = 3) are shown. P values were calculated using t-test; ***P < 0.001. (B) Panels show representative confocal microscopy images of the CC of 6-month-old MPS IIIC and WT mice labeled with fluorescent isolectin b4 (ILB4, purple), and antibodies against MBP (green), and LAMP1 (red). DAPI (blue) was used as a nuclear counterstain. Scale bars equal 10 μm. In the yellow box on the right, the enlarged confocal image of the boxed area shows the colocalization of MBP + puncta with LAMP1 + lysosomal marker inside ILB4 + activated microglia in the CC of a MPSIIIC mouse. On the left, 3D reconstruction shows that MBP + puncta (arrows) are located inside the LAMP1 + lysosome of a microglia cell. (C) Both electron-lucent vacuoles (arrow), consistent with HS storage, and those containing “zebra bodies,” indicative of myelin debris (boxed), are detected in microglia in the CC of MPS IIIC mouse. Microglia in the CC of WT mouse are small and do not contain storage vacuoles. Scale bar equals 1 μm.
FIGURE 5
FIGURE 5
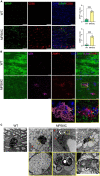
Oligodendrocytes in CC of MPS IIIC mice show reduced abundance, maturation and morphological abnormalities. (A) Representative confocal microscopy images of CC of 6-month-old WT and MPS IIIC mice immunolabelled for OL lineage marker Olig2 (green) and mature OL marker CC1 (red). Graphs show quantification of Oligo2 + , CC1 + and Oligo2 + /CC1 + cells (the number of cells per mm2) in WT and MPS IIIC mice. Individual data, means and SD (n = 3) are shown. P values were calculated using t-test; *P < 0.05 and **P < 0.01. (B) Images of CC of 6-month-old WT and MPS IIIC mice immunolabelled for CC1 (red) and LAMP1 (green). In the yellow box on the right, the upper section displays the enlarged confocal image of the boxed area, and the lower section contains reconstructed 3D images of cells, showing a significant increase in the size and abundance of LAMP1 + puncta consistent with the presence of enlarged lysosomes in the OLs of MPSIIIC mice. (C) Representative images of CC of 6-month-old WT and MPS IIIC mice immunolabelled for Olig2 (green) and HS (red). In the yellow box on the right, the upper section displays the enlarged confocal image of the boxed area, and the lower section contains reconstructed 3D images of cells, showing the accumulation of HS in the OLs of MPSIIIC mice. (D) Images of CC of 6-month-old WT and MPS IIIC mice immunolabelled for Olig2 (green) and GM3 (red). The yellow box on the left displays the enlarged confocal image of the boxed area, and the right box shows the reconstructed 3D images of the accumulation of GM3 ganglioside in the OLs of MPS IIIC mice. For all panels DAPI (blue) was used as a nuclear counterstain. Bars equal 10 μm. (E) TEM micrographs of OLs reveal numerous storage vacuoles, both electrolucent (red arrows) and those containing zebra bodies (yellow arrowheads), as well as swollen mitochondria with largely dissolved cristae (asterisks). High magnification images of boxed areas show a detailed view of storage deposits. Scale bars equal 1 μm. All graphs show individual data, means and SD obtained for three mice per genotype. P-values were calculated using an unpaired t-test.
FIGURE 6
FIGURE 6
Diffusion maps from DTI and diffusion metrics from DTI and DBSI for WT and MPS IIIC mice. (A) Representative images of Radial diffusivity (RD) and Mean diffusivity (MD) maps for brains of WT and MPS IIIC mice demonstrating an increase for both parameters in MPS IIIC brain compared to WT mice. Arrows show the corpus callosum. Diffusivity scale (μm2/ms) is shown in the right sidebar. RF, restricted fraction; HF, hindered fraction; WF, water fraction; FF, fiber fraction; AD, axial diffusivity; RD, radial diffusivity; MD, mean diffusivity and FA, fractional anisotropy. (B) Bar plots of diffusion metrics from DTI (left) and DBSI (right) of WT and MPS IIIC mice. RD, radial diffusivity; MD, mean diffusivity; Graphs show means ± SD for eight WT (green bars) and 10 MPS IIIC (yellow bars) mice. **P < 0.01, *P < 0.05.
FIGURE 7
FIGURE 7
Levels of myelin proteins in the brain and spinal cord of human MPS III patients. (A,B) MBP levels are decreased in the brain and spinal cord of human MPS III patients. IHC analysis reveals a significant reduction of MBP + areas (green) on the surface of NF-M + axons (red) in the CC (A) and SC (B) of 17-year-old MPS IIIC patient compared with age/sex matching control without a neurological disease. Scale bars equal 10 μm. Graphs show quantification of MBP + and NF-M + areas by ImageJ software. Individual results, means and SD of quantification performed in three adjacent areas are shown. P-values were calculated using an unpaired t-test. (C) MBP immunolabelling is also less pronounced in cortex of adult MPS IIIA, MPS IIIC and MPS IIID patients compared with age/sex matching non-MPS controls. Scale bars equal 10 μm. (D,E) MAG levels are reduced in the CC but not in the SC of the 17-year-old MPSIIIC patient compared to control, while MOG levels show a non-significant trend toward a decrease. Panels show representative images of CC (D) and SC (E) of MPS IIIC patient and control stained with MAG + (green) and MOG + (red). Scale bars equal 10 μm. Graphs show quantification of MAG + and MOG + areas by ImageJ software. Individual results, means and SD of quantification performed in three adjacent areas are shown. P-values were calculated using an unpaired t-test. **P < 0.01; ***P < 0.001; and ns, non significant.
FIGURE 8
FIGURE 8
Transmission Electron Microscopy (TEM) analysis confirms microgliosis, pathological changes in oligodendrocyte morphology and axonopathy in the CC of MPS IIIC patients. Electron micrographs show electron-lucent vacuoles (red arrowheads) consistent with HS storage in microglia of the CC of the 17-year-old (A) and 35-year-old (B) MPS IIIC patients. Oligodendrocytes in the CC of the 17-year-old MPS IIIC patient contain zebra bodies consistent with myelin accumulation [(C), yellow arrowheads]. Microglia (left panel) and oligodendrocytes (right panel) in the CC of control do not contain storage vacuoles (D). Degenerated axons with outfolded and split myelin, sometimes containing cytoplasmic pockets between the sheaths (red arrows), as well as large axonal swellings containing accumulating vesicles (yellow arrows), are observed in the CC of 17-year-old (E) and 35-year-old (F) MPS IIIC human patients. These structural abnormalities are not observed in the CC of the age and sex matched non-MPS patient.

Similar articles

Cited by

References

    1. Alturkustani M., Ang L. C. (2022). White matter cellular changes in ischemic injuries. Am. J. Transl. Res. 14 5859–5869. - PMC - PubMed
    1. Boustany R. M. (2013). Lysosomal storage diseases–the horizon expands. Nat. Rev. Neurol. 9 583–598. 10.1038/nrneurol.2013.163 - DOI - PubMed
    1. Chiang C. W., Wang Y., Sun P., Lin T. H., Trinkaus K., Cross A. H., et al. (2014). Quantifying white matter tract diffusion parameters in the presence of increased extra-fiber cellularity and vasogenic edema. Neuroimage 101 310–319. 10.1016/j.neuroimage.2014.06.064 - DOI - PMC - PubMed
    1. Correale J., Ysrraelit M. C. (2022). Multiple sclerosis and aging: The dynamics of demyelination and remyelination. ASN Neuro 14:17590914221118502. 10.1177/17590914221118502 - DOI - PMC - PubMed
    1. de Vries H., Hoekstra D. (2000). On the biogenesis of the myelin sheath: Cognate polarized trafficking pathways in oligodendrocytes. Glycoconj J. 17 181–190. 10.1023/a:1026533021994 - DOI - PubMed

LinkOut - more resources