

Role of plant metabolites in the formation of bacterial communities in the rhizosphere of Tetrastigma hemsleyanum
- PMID: 38163074
- PMCID: PMC10754964
- DOI: 10.3389/fmicb.2023.1292896
Role of plant metabolites in the formation of bacterial communities in the rhizosphere of Tetrastigma hemsleyanum
Abstract
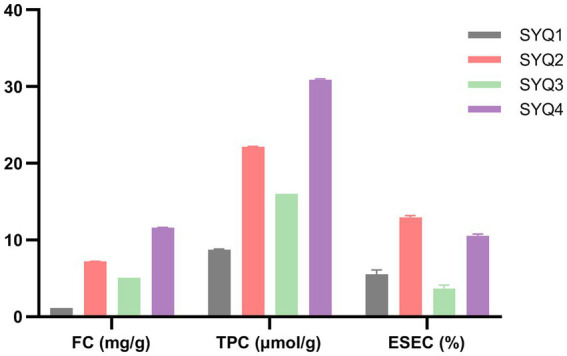
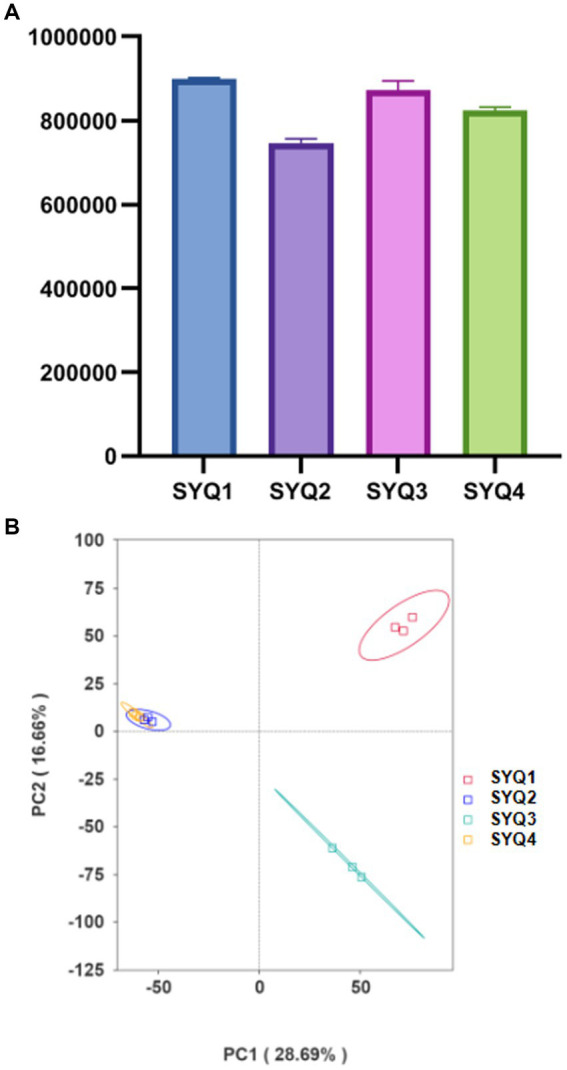
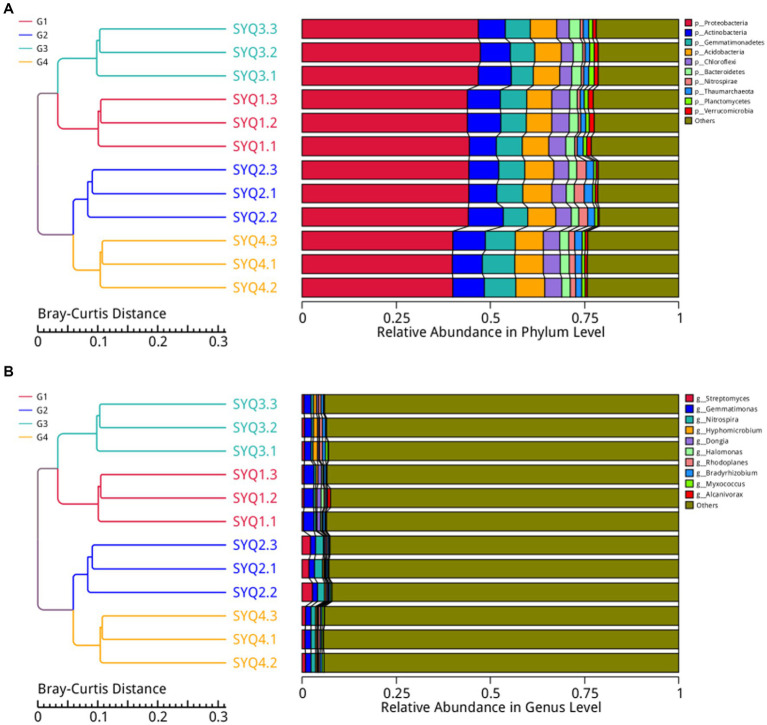
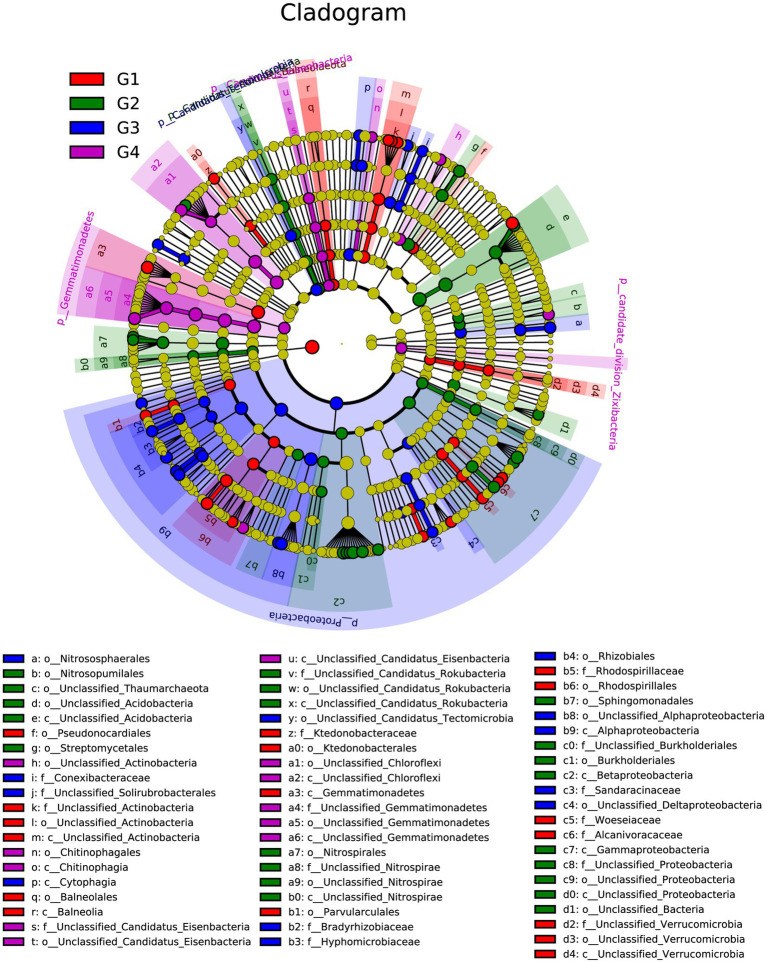
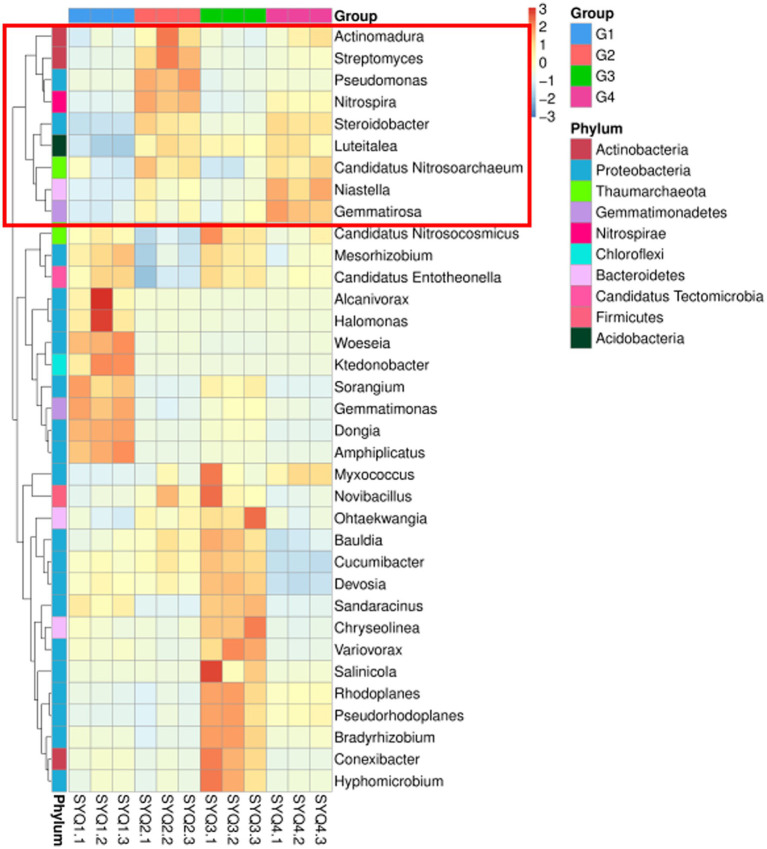
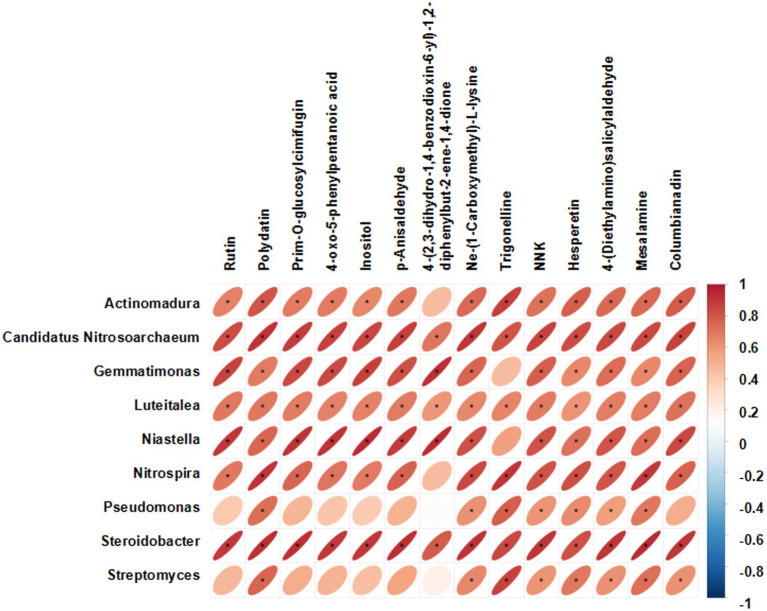
Tetrastigma hemsleyanum Diels et Gilg, commonly known as Sanyeqing (SYQ), is an important traditional Chinese medicine. The content of bioactive constituents varies in different cultivars of SYQ. In the plant growth related researches, rhizosphere microbiome has gained significant attention. However, the role of bacterial communities in the accumulation of metabolites in plants have not been investigated. Herein, the composition of bacterial communities in the rhizosphere soils and the metabolites profile of different SYQ cultivars' roots were analyzed. It was found that the composition of microbial communities varied in the rhizosphere soils of different SYQ cultivars. The high abundance of Actinomadura, Streptomyces and other bacteria was found to be associated with the metabolites profile of SYQ roots. The findings suggest that the upregulation of rutin and hesperetin may contribute to the high bioactive constituent in SYQ roots. These results provide better understanding of the metabolite accumulation pattern in SYQ, and also provide a solution for enhancing the quality of SYQ by application of suitable microbial consortia.
Keywords: Sanyeqing; Tetrastigma hemsleyanum; bioactive constituents; metabolite profiling; metagenome; microbial community structure; rhizosphere microbiome.
Copyright © 2023 Huang, Hu, Yue, Ying, Niu, Yan, Lu and Ruan.
Conflict of interest statement
The authors declare that the research was conducted in the absence of any commercial or financial relationships that could be construed as a potential conflict of interest.
Figures
Similar articles
-
Tetrastigma hemsleyanum Diels et Gilg ameliorates lipopolysaccharide induced sepsis via repairing the intestinal mucosal barrier.Biomed Pharmacother. 2022 Apr;148:112741. doi: 10.1016/j.biopha.2022.112741. Epub 2022 Feb 24. Biomed Pharmacother. 2022. PMID: 35217279
-
Differential effects of winter cold stress on soil bacterial communities, metabolites, and physicochemical properties in two varieties of Tetrastigma hemsleyanum Diels & Gilg in reclaimed land.Microbiol Spectr. 2024 Apr 2;12(4):e0242523. doi: 10.1128/spectrum.02425-23. Epub 2024 Mar 12. Microbiol Spectr. 2024. PMID: 38470484 Free PMC article.
-
Quality Evaluation of Tetrastigmae Radix from Two Different Habitats Based on Simultaneous Determination of Multiple Bioactive Constituents Combined with Multivariate Statistical Analysis.Molecules. 2022 Jul 27;27(15):4813. doi: 10.3390/molecules27154813. Molecules. 2022. PMID: 35956760 Free PMC article.
-
The research progresses and future prospects of Tetrastigma hemsleyanum Diels et Gilg: A valuable Chinese herbal medicine.J Ethnopharmacol. 2021 May 10;271:113836. doi: 10.1016/j.jep.2021.113836. Epub 2021 Jan 16. J Ethnopharmacol. 2021. PMID: 33465440 Review.
-
Insights into Metabolic Engineering of Bioactive Molecules in Tetrastigma hemsleyanum Diels & Gilg: A Traditional Medicinal Herb.Curr Genomics. 2023 Oct 27;24(2):72-83. doi: 10.2174/0113892029251472230921053135. Curr Genomics. 2023. PMID: 37994327 Free PMC article. Review.
Cited by
-
Postbiotics in the Bakery Products: Applications and Nutritional Values.Probiotics Antimicrob Proteins. 2025 Feb;17(1):292-314. doi: 10.1007/s12602-024-10327-y. Epub 2024 Jul 27. Probiotics Antimicrob Proteins. 2025. PMID: 39066881 Review.
References
-
- Brussaard L., Ruiter P. C. D., Brown G. G. (2007). Soil biodiversity for agricultural sustainability. Agric. Ecosyst. Environ. 121, 233–244. doi: 10.1016/j.agee.2006.12.013 - DOI
LinkOut - more resources
Full Text Sources