. 2023 Dec 3;10(1):e23184.
doi: 10.1016/j.heliyon.2023.e23184. eCollection 2024 Jan 15.

Novel molecular classification and prognosis of papillary renal cell carcinoma based on a large-scale CRISPR-Cas9 screening and machine learning

Affiliations

Novel molecular classification and prognosis of papillary renal cell carcinoma based on a large-scale CRISPR-Cas9 screening and machine learning

Chang Liu et al. Heliyon. .

Abstract

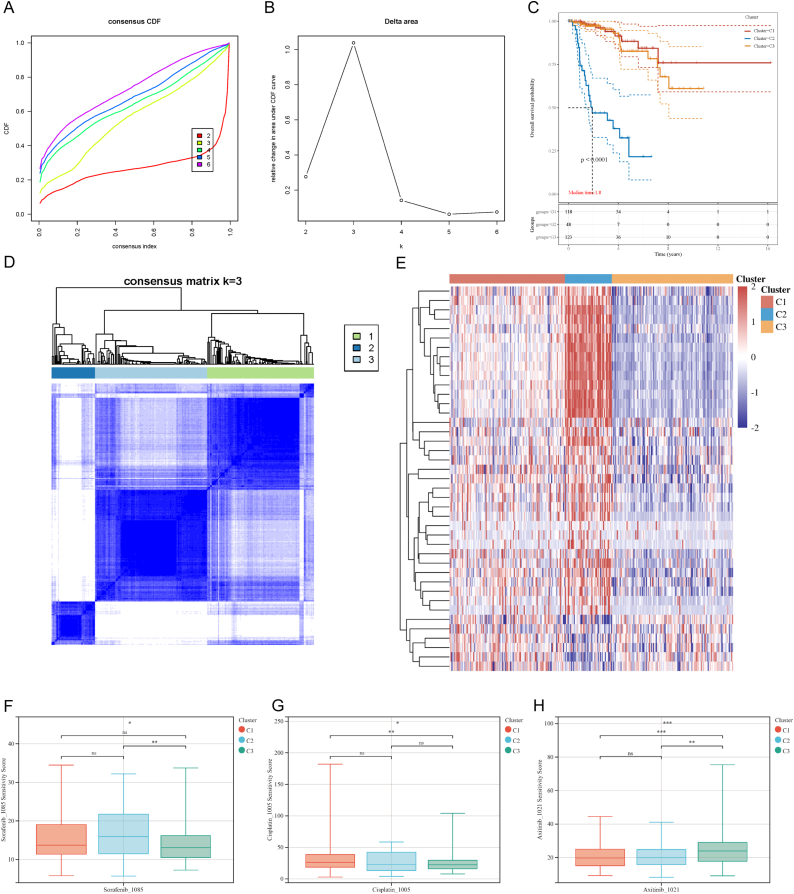
Papillary renal cell carcinoma (PRCC) is a highly heterogeneous cancer, and PRCC patients with advanced/metastatic subgroup showed obviously shorter survival compared to other kinds of renal cell carcinomas. However, the molecular mechanism and prognostic predictors of PRCC remain unclear and are worth deep studying. The aim of this study is to identify novel molecular classification and construct a reliable prognostic model for PRCC. The expression data were retrieved from TCGA, GEO, GTEx and TARGET databases. CRISPR data was obtained from Depmap database. The key genes were selected by the intersection of CRISPR-Cas9 screening genes, differentially expressed genes, and genes with prognostic capacity in PRCC. The molecular classification was identified based on the key genes. Drug sensitivity, tumor microenvironment, somatic mutation, and survival were compared among the novel classification. A prognostic model utilizing multiple machine learning algorithms based on the key genes was developed and tested by independent external validation set. Our study identified three clusters (C1, C2 and C3) in PRCC based on 41 key genes. C2 had obviously higher expression of the key genes and lower survival than C1 and C3. Significant differences in drug sensitivity, tumor microenvironment, and mutation landscape have been observed among the three clusters. By utilizing 21 combinations of 9 machine learning algorithms, 9 out of 41 genes were chosen to construct a robust prognostic signature, which exhibited good prognostic ability. SERPINH1 was identified as a critical gene for its strong prognostic ability in PRCC by univariate and multiple Cox regression analyses. Quantitative real-time PCR and Western blot demonstrated that SERPINH1 mRNA and protein were highly expressed in PRCC cells compared with normal human renal cells. This study exhibited a new molecular classification and prognostic signature for PRCC, which may provide a potential biomarker and therapy target for PRCC patients.

Keywords: CRISPR-Cas9; Depmap; Machine learning; Papillary renal cell carcinoma; SERPINH1.


Conflict of interest statement

The authors declare that they have no known competing financial interests or personal relationships that could have appeared to influence the work reported in this paper.

Figures

Fig. 1
Fig. 1
The flow chart of our study.
Fig. 2
Fig. 2
Selection and enrichment analysis of the key genes. (A) The volcano plot showed the DEGs. Red points indicated up-regulated genes and blue points indicated down-regulated genes. (B) The key genes were found in the Venn diagram. The enriched KEGG signaling pathways (C), GO biological processes analysis (D), GO cellular components analysis (E), and GO molecular functions analysis (F) were performed based on the key genes.
Fig. 3
Fig. 3
Consensus cluster analysis and drug sensitivity analysis. (A, B) CDF and relative change in the area under the CDF curve (CDF Delta area). (C) The KM curves of the clusters. (D) Heatmap described the consensus clustering solution when k = 3. (E) The expression of the key genes in the three clusters. Red color represented high expression, and blue color represented low expression. The predictive drug sensitivity of the three clusters to Sorafenib (F), Cisplatin (G), and Axitinib (H). (*P < 0.05, **P < 0.01, ***P < 0.001, ****P < 0.0001).
Fig. 4
Fig. 4
Key genes-based clusters were associated with tumor microenvironment and ICB therapy. (A) CIBERSORT analysis showed the abundance of the immune cells in PRCC. Different colors represented different kinds of immune cells. (B) The immune score of the clusters. (C) The expression of the immune checkpoint-related genes exhibited significant differences among the clusters. (D) The predictive ICB therapy response. (E) The abundance of the immune cells in three clusters was shown through the heatmap. (*P < 0.05, **P < 0.01, ***P < 0.001, ****P < 0.0001).
Fig. 5
Fig. 5
Somatic mutation in the clusters. (A) The mutant landscape and the top 15 mutant genes in PRCC. The cohort summary plots showed different variant types in C1 (B), C2 (C), and C3 (D). The mutation frequency was visualized in nine common oncogenic pathways in C1 (E), C2 (F), and C3 (G).
Fig. 6
Fig. 6
A robust prognostic signature was developed based on the key genes. (A) 21 combinations of 9 machine learning algorithms were applied to develop the prognostic signature. The AUC values of each model at 1, 3, and 5 years in the validation set and test set were shown and the prognostic signature based on RSF was selected. The corresponding KM curves for high and low groups in TCGA-PRCC cohort (B) and GSE2748 cohort (C) were visualized. The univariate Cox regression analysis (D) and multiple Cox regression analysis (E) were performed based on the genes included in the prognostic signature.
Fig. 7
Fig. 7
The expression of SERPINH1 in PRCC. (A–B) The expression of SERPINH1 in the tumor tissues, normal tissues and three clusters. The relationship between SERPINH1 expression and TMB score or MSI score (C). (D–I) The association between the expression of SERPINH1 and the abundance of immune cells. (*P < 0.05, **P < 0.01, ***P < 0.001, ****P < 0.0001).
Fig. 8
Fig. 8
Pan-cancer analysis for SERPINH1, and SERPINH1 expression in PRCC and ccRCC cells. (A) The prognostic ability of SERPINH1 was evaluated in 33 types of tumors. SERPINH1 expression was associated with the tumor stages in PRCC (B), ACC (C), and ccRCC (D). Immunohistochemistry showed that compared with normal renal tubules (E), SERPINH1 protein was highly expressed in PRCC (F) and ccRCC (G) tumor tissues. (H) Quantitative real-time PCR showed that the expression levels of SERPINH1 mRNA were significantly higher in ACHN PRCC cells and 786-O ccRCC cells than those in normal HK-2 cells. (I–J) Western blot analysis indicated that the relative expression levels of SERPINH1 protein were markedly upregulated in ACHN and 786-O cells compared to normal HK-2 cells. The relative expression levels of proteins were quantified with Image J software and normalized to those of GAPDH. The uncropped figures of SERPINH1 and GAPDH in Western blot were shown in Supplementary Figs. S1 and S2. (*P < 0.05, **P < 0.01, ***P < 0.001, ****P < 0.0001).
Fig. 9
Fig. 9
The relationship between the expression of SERPINH1 and tumor microenvironment, TMB, or MSI in multiple types of tumors. (A) EPIC analysis revealed the relationship between the expression of SERPINH1 and the abundance of immune cells in 33 types of tumors. The expression of SERPINH1 was related with TMB score (B) and MSI score (C) in multiple types of tumors.
figs1
figs1
figs2
figs2

References

    1. Capitanio U., Bensalah K., Bex A., et al. Epidemiology of renal cell carcinoma. Eur. Urol. 2019;75:74–84. doi: 10.1016/j.eururo.2018.08.036. - DOI - PMC - PubMed
    1. Perazella M.A., Dreicer R., Rosner M.H. Renal cell carcinoma for the nephrologist. Kidney Int. 2018;94:471–483. doi: 10.1016/j.kint.2018.01.023. - DOI - PubMed
    1. Steffens S., Janssen M., Roos F.C., et al. Incidence and long-term prognosis of papillary compared to clear cell renal cell carcinoma--a multicentre study. Eur. J. Cancer. 2012;48:2347–2352. doi: 10.1016/j.ejca.2012.05.002. - DOI - PubMed
    1. Lobo J., Ohashi R., Amin M.B., et al. WHO 2022 landscape of papillary and chromophobe renal cell carcinoma. Histopathology. 2022;81:426–438. doi: 10.1111/his.14700. - DOI - PubMed
    1. Siegel R.L., Miller K.D., Jemal A. Cancer statistics. CA. Cancer J. Clin. 2019;69 doi: 10.3322/caac.21551. 2019. - DOI - PubMed

LinkOut - more resources