

Free-moving-state microscopic imaging of cerebral oxygenation and hemodynamics with a photoacoustic fiberscope
- PMID: 38163847
- PMCID: PMC10758391
- DOI: 10.1038/s41377-023-01348-3
Free-moving-state microscopic imaging of cerebral oxygenation and hemodynamics with a photoacoustic fiberscope
Abstract
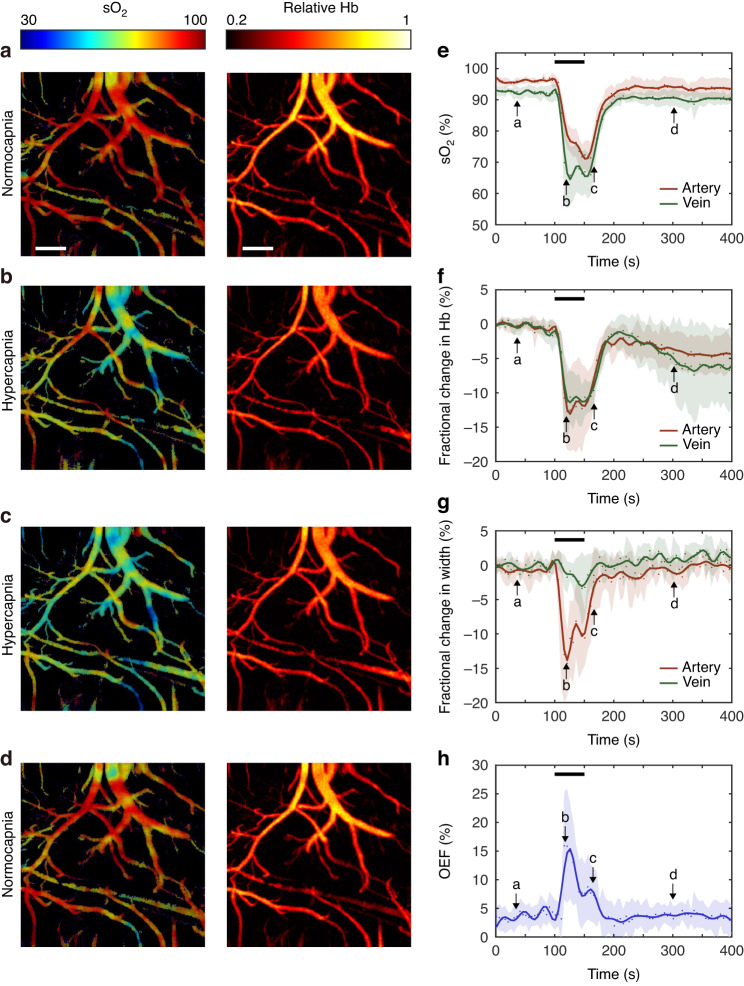
We report the development of a head-mounted photoacoustic fiberscope for cerebral imaging in a freely behaving mouse. The 4.5-gram imaging probe has a 9-µm lateral resolution and 0.2-Hz frame rate over a 1.2-mm wide area. The probe can continuously monitor cerebral oxygenation and hemodynamic responses at single-vessel resolution, showing significantly different cerebrovascular responses to external stimuli under anesthesia and in the freely moving state. For example, when subjected to high-concentration CO2 respiration, enhanced oxygenation to compensate for hypercapnia can be visualized due to cerebral regulation in the freely moving state. Comparative studies exhibit significantly weakened compensation capabilities in obese rodents. This new imaging modality can be used for investigating both normal and pathological cerebrovascular functions and shows great promise for studying cerebral activity, disorders and their treatments.
© 2024. The Author(s).
Conflict of interest statement
The authors declare no competing interests.
Figures


Similar articles
-
Simultaneous head-mounted imaging of neural and hemodynamic activities at high spatiotemporal resolution in freely behaving mice.Sci Adv. 2025 Mar 21;11(12):eadu1153. doi: 10.1126/sciadv.adu1153. Epub 2025 Mar 21. Sci Adv. 2025. PMID: 40117369 Free PMC article.
-
Multiparametric Brain Hemodynamics Imaging Using a Combined Ultrafast Ultrasound and Photoacoustic System.Adv Sci (Weinh). 2024 Aug;11(31):e2401467. doi: 10.1002/advs.202401467. Epub 2024 Jun 17. Adv Sci (Weinh). 2024. PMID: 38884161 Free PMC article.
-
A head-mounted photoacoustic fiberscope for hemodynamic imaging in mobile mice.Light Sci Appl. 2024 May 7;13(1):107. doi: 10.1038/s41377-024-01454-w. Light Sci Appl. 2024. PMID: 38714667 Free PMC article.
-
Sound out the impaired perfusion: Photoacoustic imaging in preclinical ischemic stroke.Front Neurosci. 2022 Dec 1;16:1055552. doi: 10.3389/fnins.2022.1055552. eCollection 2022. Front Neurosci. 2022. PMID: 36532279 Free PMC article. Review.
-
Functional photoacoustic microscopy of hemodynamics: a review.Biomed Eng Lett. 2022 Apr 10;12(2):97-124. doi: 10.1007/s13534-022-00220-4. eCollection 2022 May. Biomed Eng Lett. 2022. PMID: 35529339 Free PMC article. Review.
Cited by
-
Optogenetic Brain-Computer Interfaces.Bioengineering (Basel). 2024 Aug 12;11(8):821. doi: 10.3390/bioengineering11080821. Bioengineering (Basel). 2024. PMID: 39199779 Free PMC article. Review.
-
Simultaneous head-mounted imaging of neural and hemodynamic activities at high spatiotemporal resolution in freely behaving mice.Sci Adv. 2025 Mar 21;11(12):eadu1153. doi: 10.1126/sciadv.adu1153. Epub 2025 Mar 21. Sci Adv. 2025. PMID: 40117369 Free PMC article.
-
Wavelength-time-division multiplexed fiber-optic sensor array for wide-field photoacoustic microscopy.Photoacoustics. 2025 Apr 18;43:100725. doi: 10.1016/j.pacs.2025.100725. eCollection 2025 Jun. Photoacoustics. 2025. PMID: 40331015 Free PMC article.
-
A comprehensive review of high-performance photoacoustic microscopy systems.Photoacoustics. 2025 Jun 4;44:100739. doi: 10.1016/j.pacs.2025.100739. eCollection 2025 Aug. Photoacoustics. 2025. PMID: 40528993 Free PMC article. Review.
-
Emerging Wearable Acoustic Sensing Technologies.Adv Sci (Weinh). 2025 Feb;12(6):e2408653. doi: 10.1002/advs.202408653. Epub 2025 Jan 3. Adv Sci (Weinh). 2025. PMID: 39749384 Free PMC article. Review.
References
Grants and funding
LinkOut - more resources
Full Text Sources
