

Predicting the quality attributes related to geographical growing regions in red-fleshed kiwifruit by data fusion of electronic nose and computer vision systems
- PMID: 38163882
- PMCID: PMC10759769
- DOI: 10.1186/s12870-023-04661-6
Predicting the quality attributes related to geographical growing regions in red-fleshed kiwifruit by data fusion of electronic nose and computer vision systems
Abstract
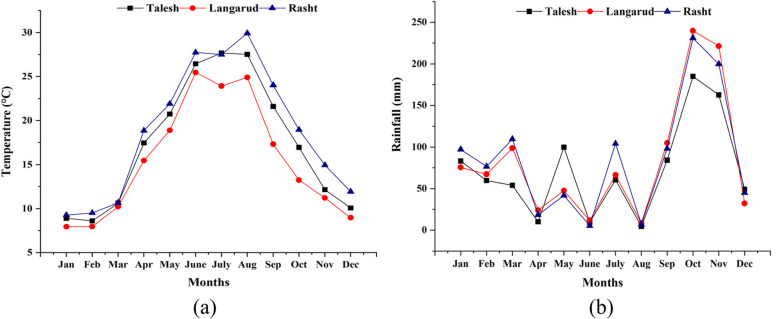
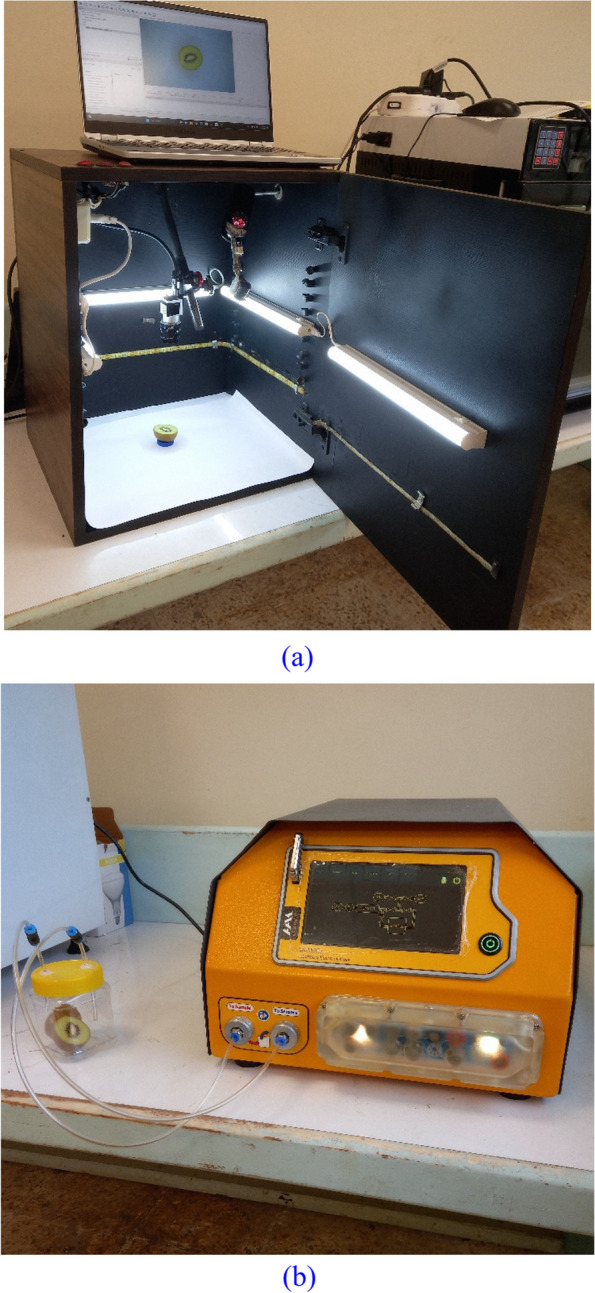
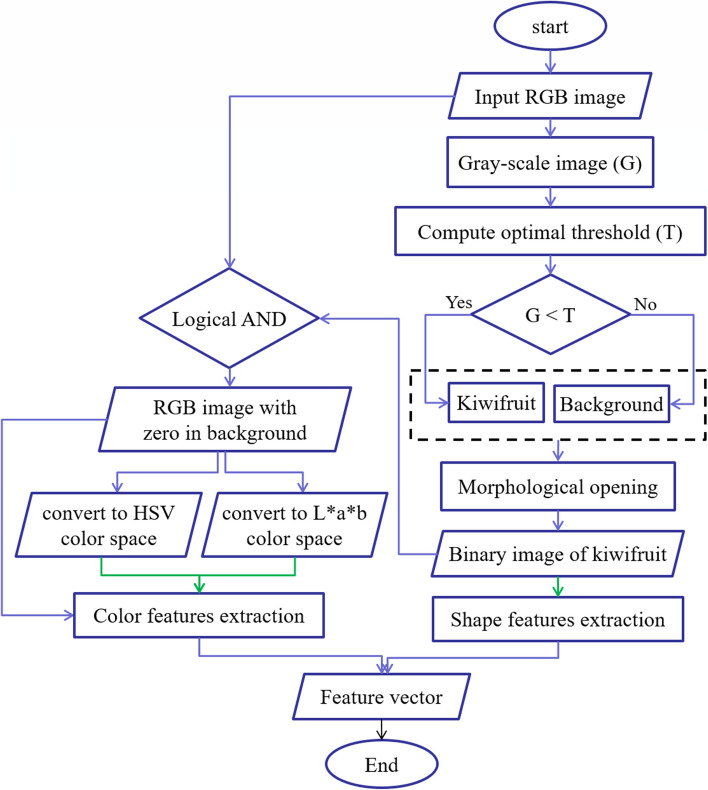
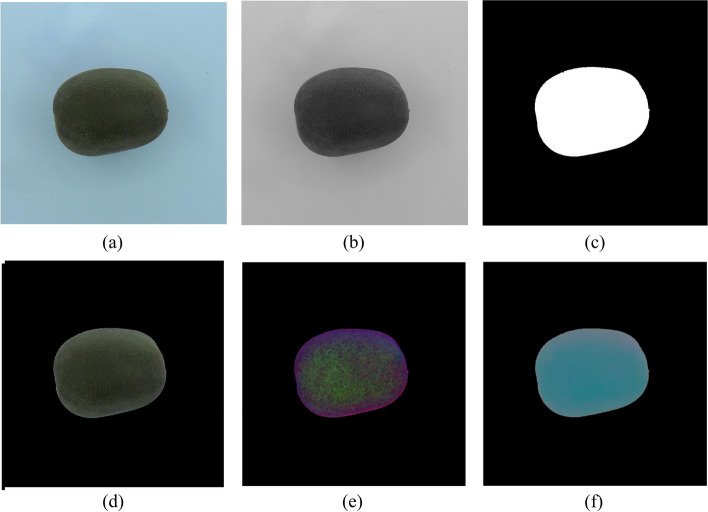
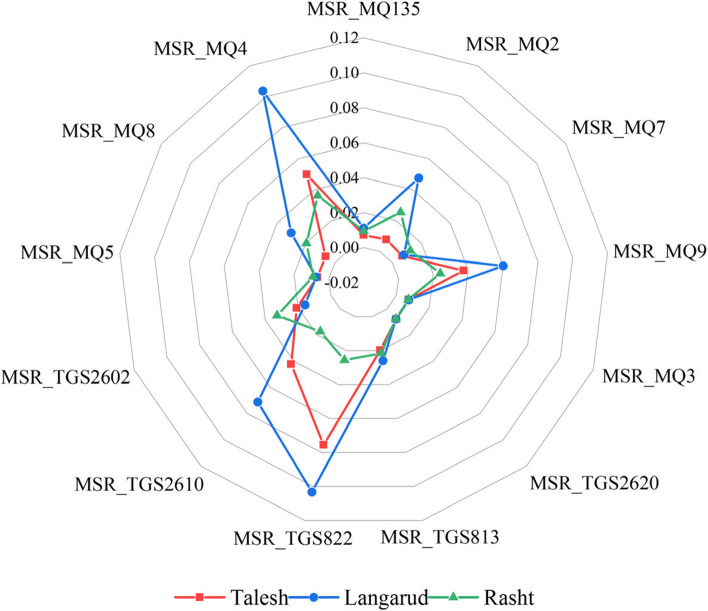
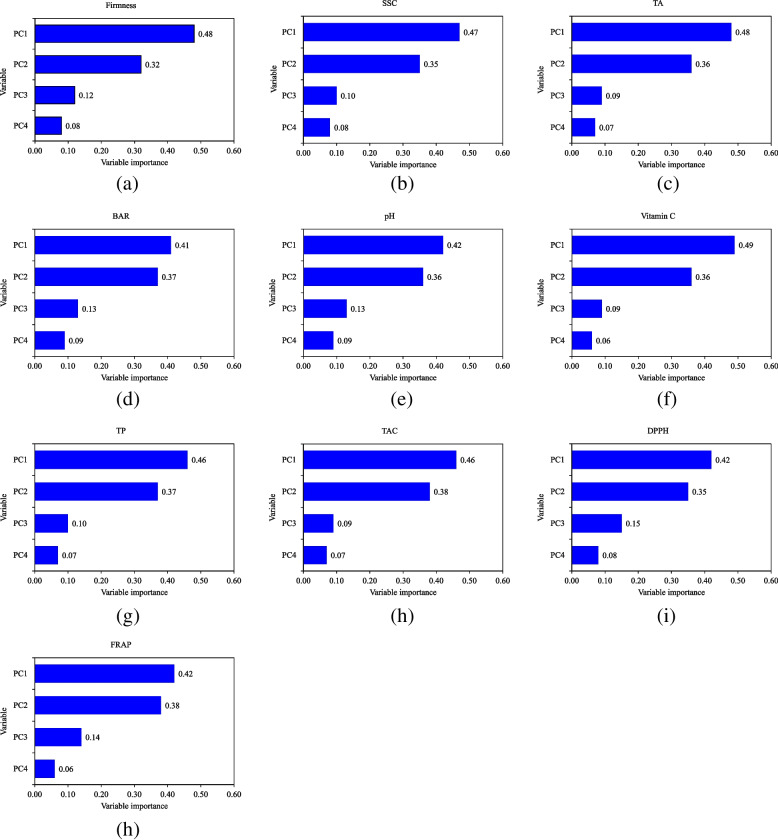
The ability of a data fusion system composed of a computer vision system (CVS) and an electronic nose (e-nose) was evaluated to predict key physiochemical attributes and distinguish red-fleshed kiwifruit produced in three distinct regions in northern Iran. Color and morphological features from whole and middle-cut kiwifruits, along with the maximum responses of the 13 metal oxide semiconductor (MOS) sensors of an e-nose system, were used as inputs to the data fusion system. Principal component analysis (PCA) revealed that the first two principal components (PCs) extracted from the e-nose features could effectively differentiate kiwifruit samples from different regions. The PCA-SVM algorithm achieved a 93.33% classification rate for kiwifruits from three regions based on data from individual e-nose and CVS. Data fusion increased the classification rate of the SVM model to 100% and improved the performance of Support Vector Regression (SVR) for predicting physiochemical indices of kiwifruits compared to individual systems. The data fusion-based PCA-SVR models achieved validation R2 values ranging from 90.17% for the Brix-Acid Ratio (BAR) to 98.57% for pH prediction. These results demonstrate the high potential of fusing artificial visual and olfactory systems for quality monitoring and identifying the geographical growing regions of kiwifruits.
Keywords: Image processing; Machine learning; Origin; Physicochemical attributes; Volatile Organic compounds.
© 2023. The Author(s).
Conflict of interest statement
The authors declare no competing interests.
Figures


Similar articles
-
A data fusion approach for nondestructive tracking of the ripening process and quality attributes of green Hayward kiwifruit using artificial olfaction and proximal hyperspectral imaging techniques.Food Sci Nutr. 2023 Jul 6;11(10):6116-6132. doi: 10.1002/fsn3.3548. eCollection 2023 Oct. Food Sci Nutr. 2023. PMID: 37823103 Free PMC article.
-
Comparative Study on Physicochemical and Nutritional Qualities of Kiwifruit Varieties.Foods. 2022 Dec 25;12(1):108. doi: 10.3390/foods12010108. Foods. 2022. PMID: 36613324 Free PMC article.
-
Ripeness Prediction of Postharvest Kiwifruit Using a MOS E-Nose Combined with Chemometrics.Sensors (Basel). 2019 Jan 21;19(2):419. doi: 10.3390/s19020419. Sensors (Basel). 2019. PMID: 30669613 Free PMC article.
-
Milk Source Identification and Milk Quality Estimation Using an Electronic Nose and Machine Learning Techniques.Sensors (Basel). 2020 Jul 30;20(15):4238. doi: 10.3390/s20154238. Sensors (Basel). 2020. PMID: 32751425 Free PMC article.
-
Tracing internal quality and aroma of a red-fleshed kiwifruit during ripening by means of GC-MS and E-nose.RSC Adv. 2019 Jul 8;9(37):21164-21174. doi: 10.1039/c9ra03506k. eCollection 2019 Jul 5. RSC Adv. 2019. PMID: 35521344 Free PMC article.
Cited by
-
Breeding of new kiwifruit (Actinidia chinensis) cultivars with yellow (golden) fleshed and superior characteristics.BMC Plant Biol. 2024 Nov 5;24(1):1045. doi: 10.1186/s12870-024-05768-0. BMC Plant Biol. 2024. PMID: 39497036 Free PMC article.
-
Destructive and Non-Destructive Evaluation of Anthocyanin Content and Quality Attributes in Red Kiwifruit Subjected to Plant Spray Treatment with Cis-3-Hexenyl Butyrate.Foods. 2025 Feb 2;14(3):480. doi: 10.3390/foods14030480. Foods. 2025. PMID: 39942073 Free PMC article.
References
-
- Ferguson AR. Botanical description. In: Testolin R, Huang HW, Ferguson A, editors. The Kiwifruit Genome. Compendium of Plant Genomes. Chams: Springer; 2016.
-
- Montefiori M, Espley RV, Stevenson D, Cooney J, Datson PM, Saiz A, Atkinson RG, Hellens RP, Allan AC. Identification and characterisation of F3GT1 and F3GGT1, two glycosyltransferases responsible for anthocyanin biosynthesis in red-fleshed kiwifruit (Actinidia chinensis) Plant J. 2011;65(1):106–118. doi: 10.1111/j.1365-313X.2010.04409.x. - DOI - PubMed
-
- Fabani MP, Arrúa RC, Vázquez F, Diaz MP, Baroni MV, Wunderlin DA. Evaluation of elemental profile coupled to chemometrics to assess the geographical origin of Argentinean wines. Food Chem. 2010;119(1):372–379. doi: 10.1016/j.foodchem.2009.05.085. - DOI
-
- Pilgrim TS, Watling RJ, Grice K. Application of trace element and stable isotope signatures to determine the provenance of tea (Camellia sinensis) samples. Food Chem. 2010;118(4):921–926. doi: 10.1016/j.foodchem.2008.08.077. - DOI
MeSH terms
LinkOut - more resources
Full Text Sources
