

Host-pathogen interaction between pitaya and Neoscytalidium dimidiatum reveals the mechanisms of immune response associated with defense regulators and metabolic pathways
- PMID: 38163897
- PMCID: PMC10759344
- DOI: 10.1186/s12870-023-04685-y
Host-pathogen interaction between pitaya and Neoscytalidium dimidiatum reveals the mechanisms of immune response associated with defense regulators and metabolic pathways
Abstract
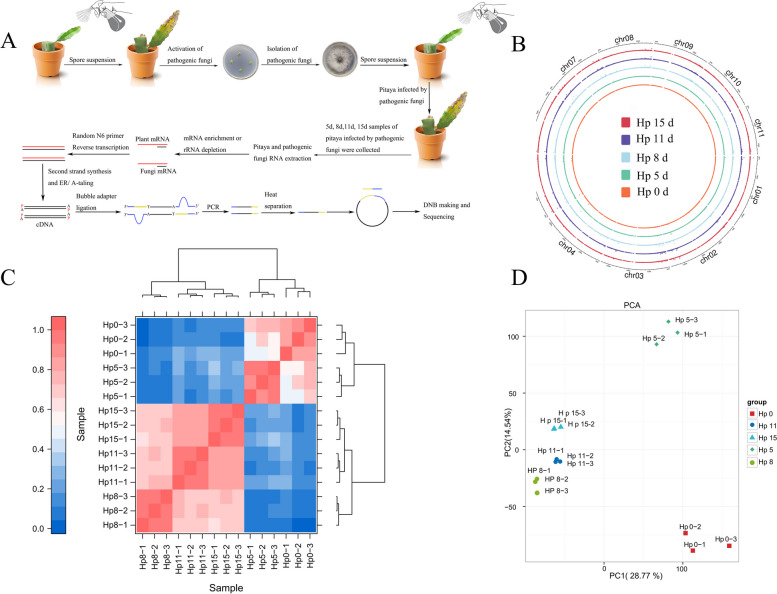
Background: Understanding how plants and pathogens regulate each other's gene expression during their interactions is key to revealing the mechanisms of disease resistance and controlling the development of pathogens. Despite extensive studies on the molecular and genetic basis of plant immunity against pathogens, the influence of pitaya immunity on N. dimidiatum metabolism to restrict pathogen growth is poorly understood, and how N. dimidiatum breaks through pitaya defenses. In this study, we used the RNA-seq method to assess the expression profiles of pitaya and N. dimidiatum at 4 time periods after interactions to capture the early effects of N. dimidiatum on pitaya processes.
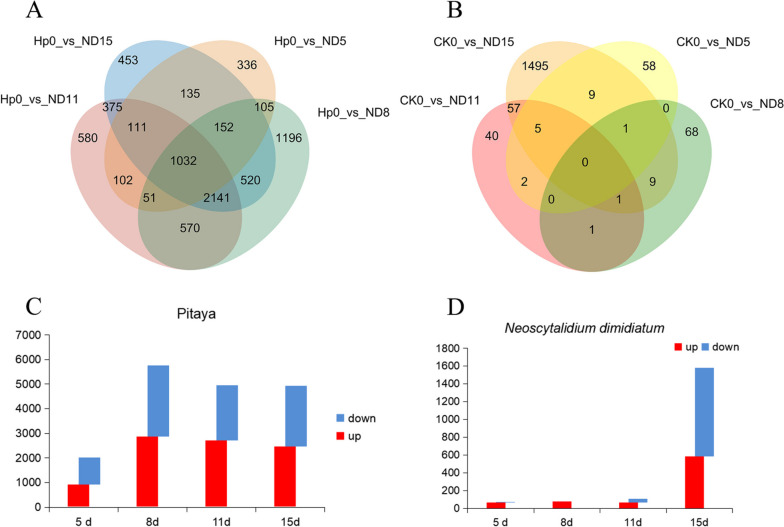
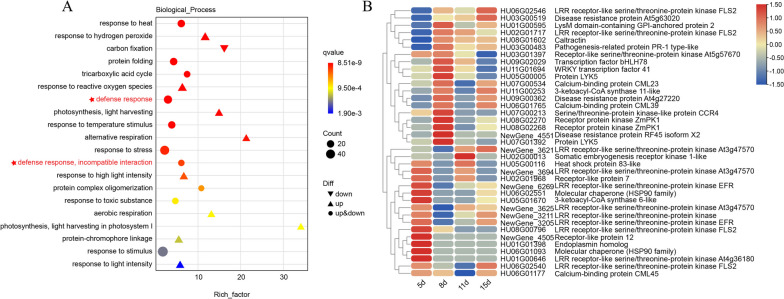
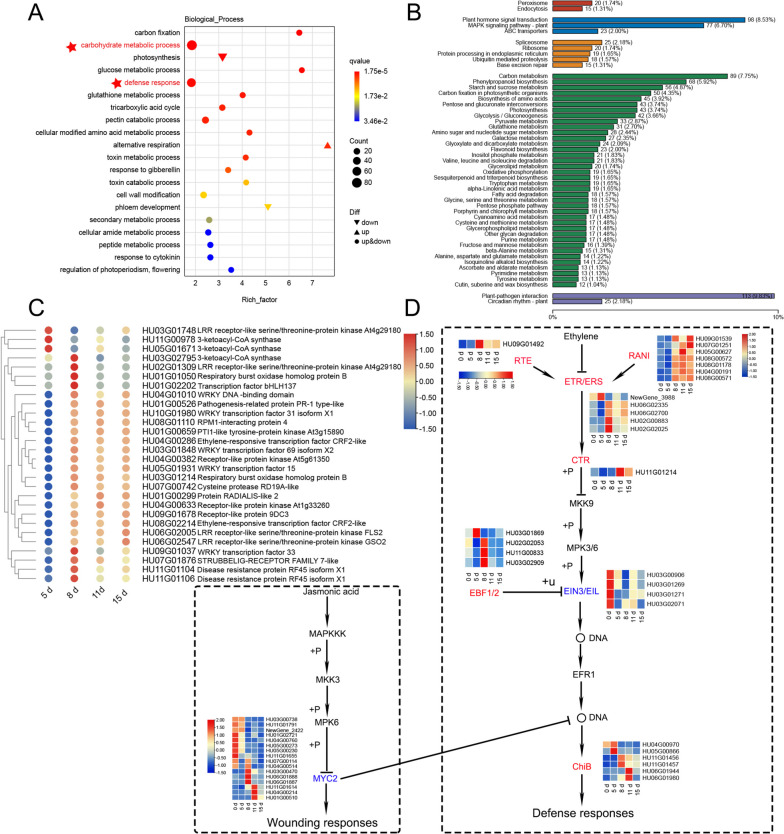
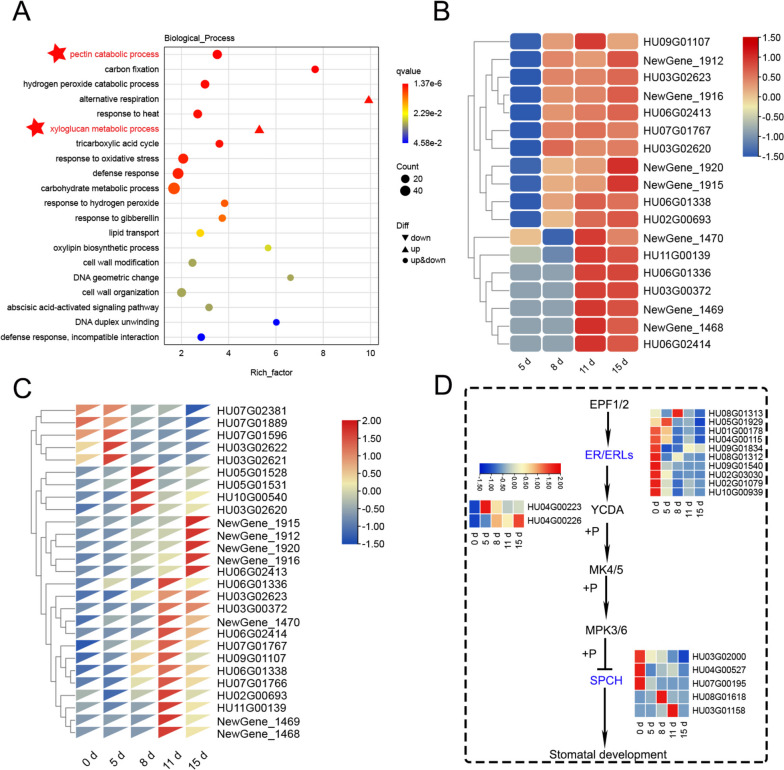
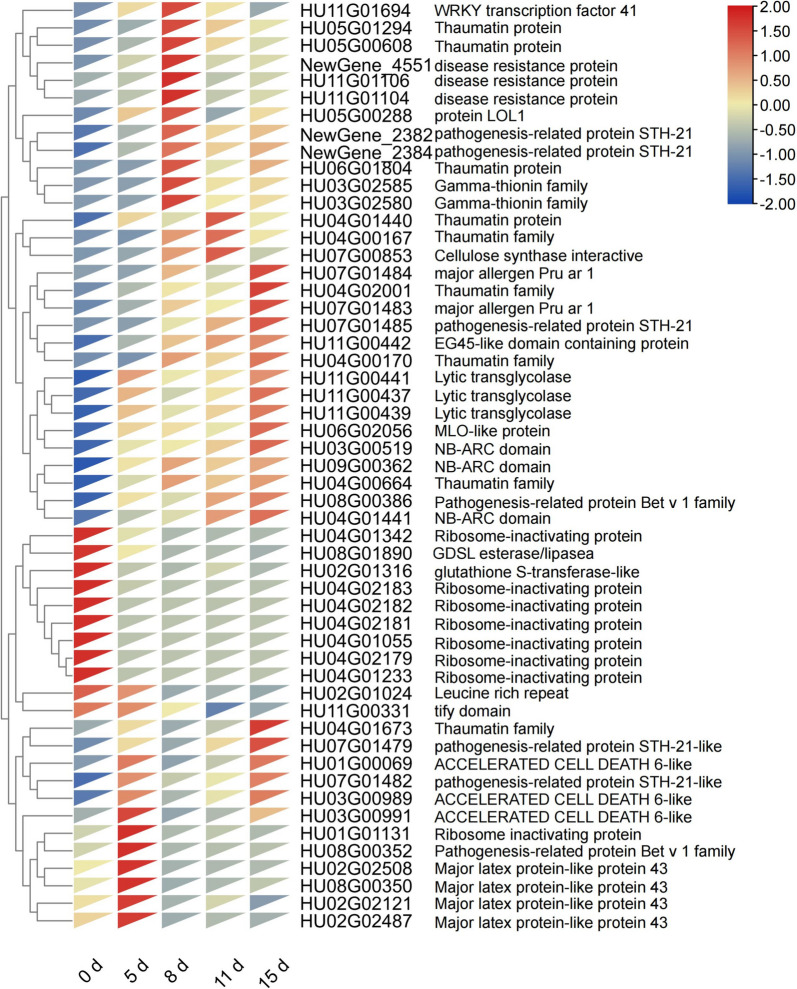
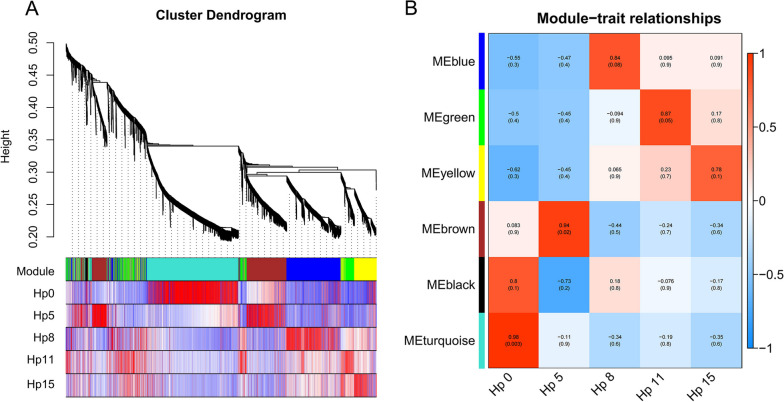
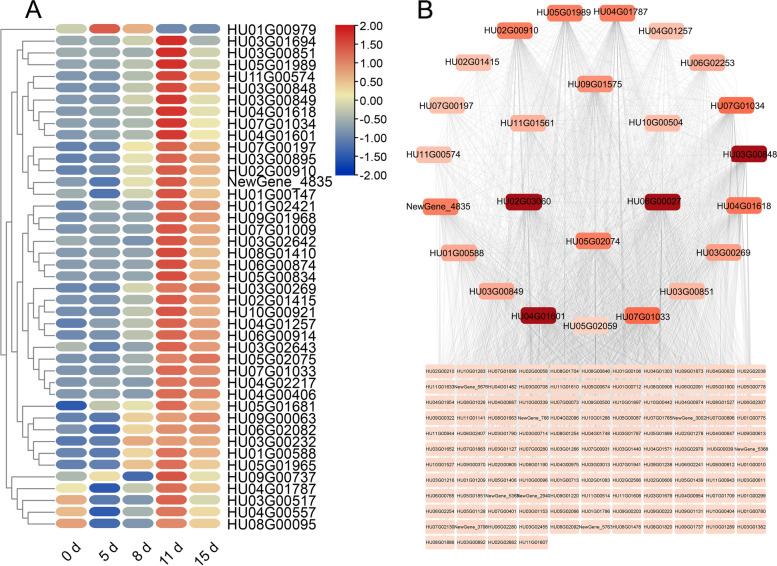
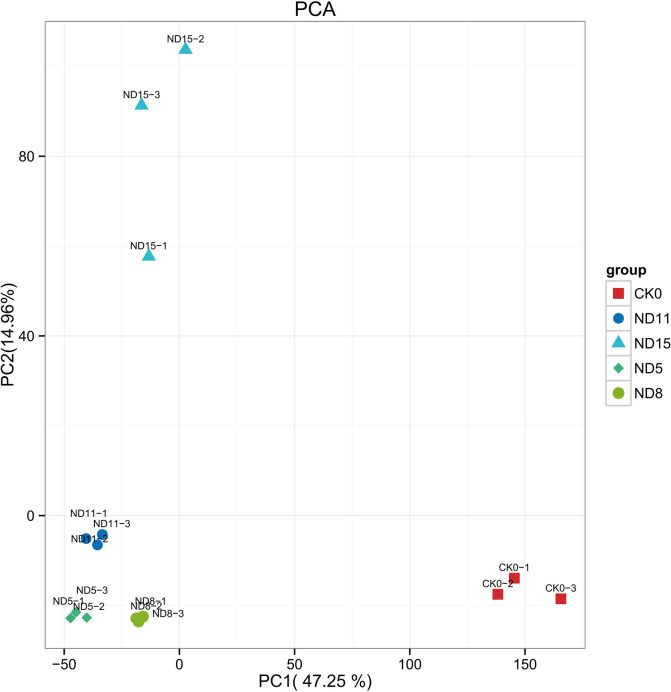
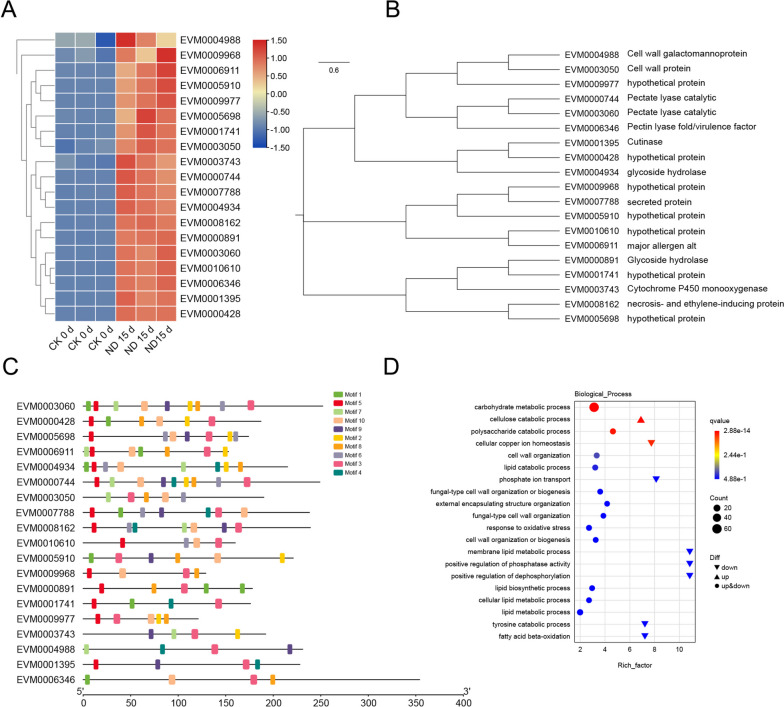
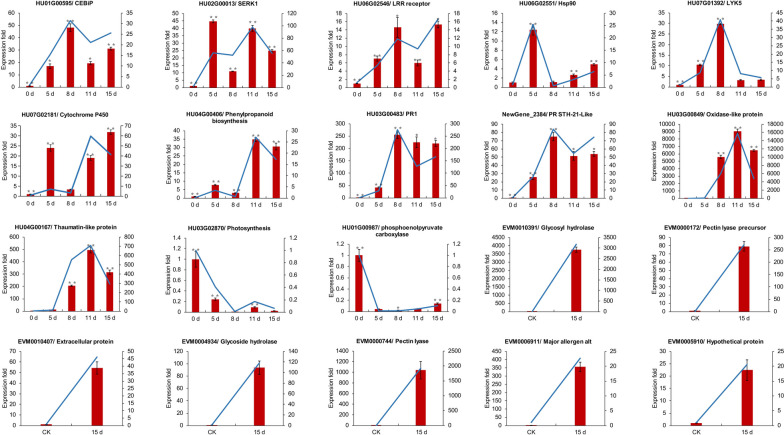
Results: The study defined the establishment of an effective method for analyzing transcriptome interactions between pitaya and N. dimidiatum and to obtain global expression profiles. We identified gene expression clusters in both the host pitaya and the pathogen N. dimidiatum. The analysis showed that numerous differentially expressed genes (DEGs) involved in the recognition and defense of pitaya against N. dimidiatum, as well as N. dimidiatum's evasion of recognition and inhibition of pitaya. The major functional groups identified by GO and KEGG enrichment were responsible for plant and pathogen recognition, phytohormone signaling (such as salicylic acid, abscisic acid). Furthermore, the gene expression of 13 candidate genes involved in phytopathogen recognition, phytohormone receptors, and the plant resistance gene (PG), as well as 7 effector genes of N. dimidiatum, including glycoside hydrolases, pectinase, and putative genes, were validated by qPCR. By focusing on gene expression changes during interactions between pitaya and N. dimidiatum, we were able to observe the infection of N. dimidiatum and its effects on the expression of various defense components and host immune receptors.
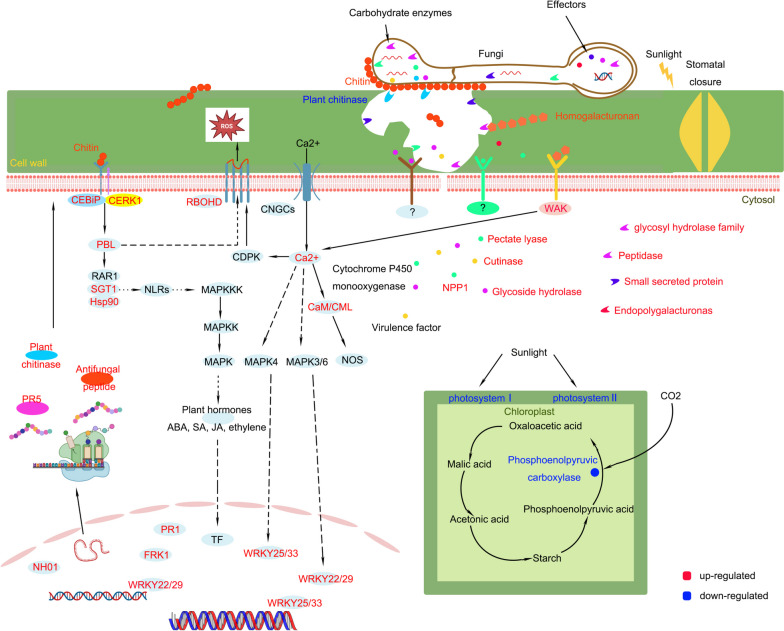
Conclusion: Our data show that various regulators of the immune response are modified during interactions between pitaya and N. dimidiatum. Furthermore, the activation and repression of these genes are temporally coordinated. These findings provide a framework for better understanding the pathogenicity of N. dimidiatum and its role as an opportunistic pathogen. This offers the potential for a more effective defense against N. dimidiatum.
Keywords: Host–pathogen interaction; N.dimidiatum; Pitaya canker; Transcriptomics.
© 2023. The Author(s).
Conflict of interest statement
The authors declare that they have no competing interests.
Figures
Similar articles
-
Transcriptional regulation of hormone signalling genes in black pepper in response to Phytophthora capsici.BMC Genomics. 2024 Sep 30;25(1):910. doi: 10.1186/s12864-024-10802-4. BMC Genomics. 2024. PMID: 39350031 Free PMC article.
-
Metabolome integrated with transcriptome, and genome analysis revealed higher accumulations of phytoalexins enhance resistance against Magnaporthe oryzae in new Zhefang rice variety diantun 506.BMC Plant Biol. 2025 Jul 2;25(1):836. doi: 10.1186/s12870-025-06856-5. BMC Plant Biol. 2025. PMID: 40604494 Free PMC article.
-
Comparative transcriptomics reveal contrasting strategies between a fungal plant pathogen and an endophyte during initial host colonization.Microbiol Spectr. 2025 Aug 5;13(8):e0022625. doi: 10.1128/spectrum.00226-25. Epub 2025 Jun 12. Microbiol Spectr. 2025. PMID: 40503835 Free PMC article.
-
Systemic pharmacological treatments for chronic plaque psoriasis: a network meta-analysis.Cochrane Database Syst Rev. 2021 Apr 19;4(4):CD011535. doi: 10.1002/14651858.CD011535.pub4. Cochrane Database Syst Rev. 2021. Update in: Cochrane Database Syst Rev. 2022 May 23;5:CD011535. doi: 10.1002/14651858.CD011535.pub5. PMID: 33871055 Free PMC article. Updated.
-
Immunogenicity and seroefficacy of pneumococcal conjugate vaccines: a systematic review and network meta-analysis.Health Technol Assess. 2024 Jul;28(34):1-109. doi: 10.3310/YWHA3079. Health Technol Assess. 2024. PMID: 39046101 Free PMC article.
Cited by
-
Genome-wide analysis of the PYL-PP2C-SnRK2s family in the ABA signaling pathway of pitaya reveals its expression profiles under canker disease stress.BMC Genomics. 2024 Aug 1;25(1):749. doi: 10.1186/s12864-024-10665-9. BMC Genomics. 2024. PMID: 39090531 Free PMC article.
References
-
- Janssen D, García C, Ruiz L. First report of schlumbergera virus x in dragon fruit (Hylocereus spp.) in Spain. Plant Dis. 2022;106:Pdis09211879pdn. doi: 10.1094/PDIS-09-21-1879-PDN. - DOI
MeSH terms
Substances
Supplementary concepts
Grants and funding
LinkOut - more resources
Full Text Sources
