

The der(1;7)(q10;p10) defining a distinct profile from -7/del(7q) in myelodysplastic syndromes: A systematic review and meta-analysis
- PMID: 38164059
- PMCID: PMC10807610
- DOI: 10.1002/cam4.6890
The der(1;7)(q10;p10) defining a distinct profile from -7/del(7q) in myelodysplastic syndromes: A systematic review and meta-analysis
Abstract
Background and objective: Myelodysplastic syndromes (MDS) are myeloid neoplasms characterized by ineffective hematopoiesis due to stem cell abnormalities. Monosomy 7q aberrations are a common cytogenetic abnormality in MDS. Specifically, an unbalanced translocation der(1;7)(q10;p10) [der(1;7)] has been identified in MDS patients, which is a monosomy 7q aberration variant like -7/del(7q). However, knowledge of der(1;7)'s features remains limited. Existing studies have compared the clinical and genetic characteristics of der(1;7) to those of -7/del(7q) but yielded inconsistent findings. Accordingly, we conducted meta-analyses comparing der(1;7) to -7/del(7q).
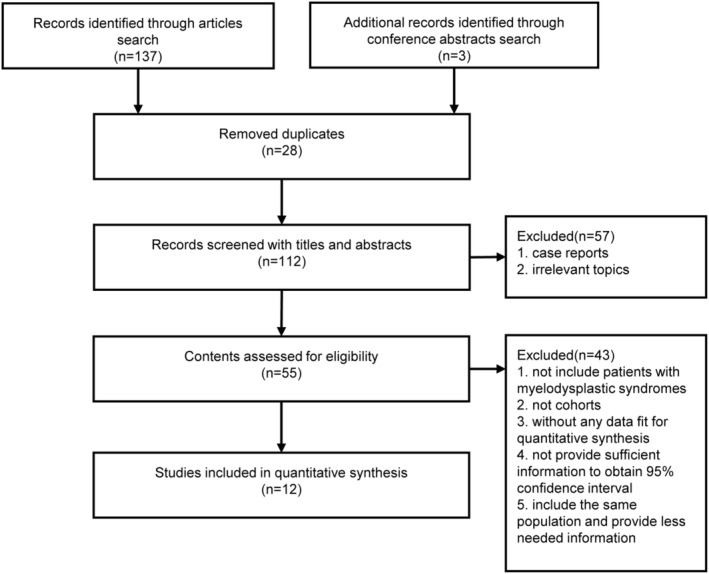
Methods: Publications were searched from the following databases up to January 10, 2023: Pubmed, Web of Science, Embase, Cochrane, and ClinicalTrials.gov. Eligible studies were assessed for risks of bias. Relevant data were extracted from included studies and analyzed using random-effects models. Publication bias was evaluated and sensitivity analyses were performed.
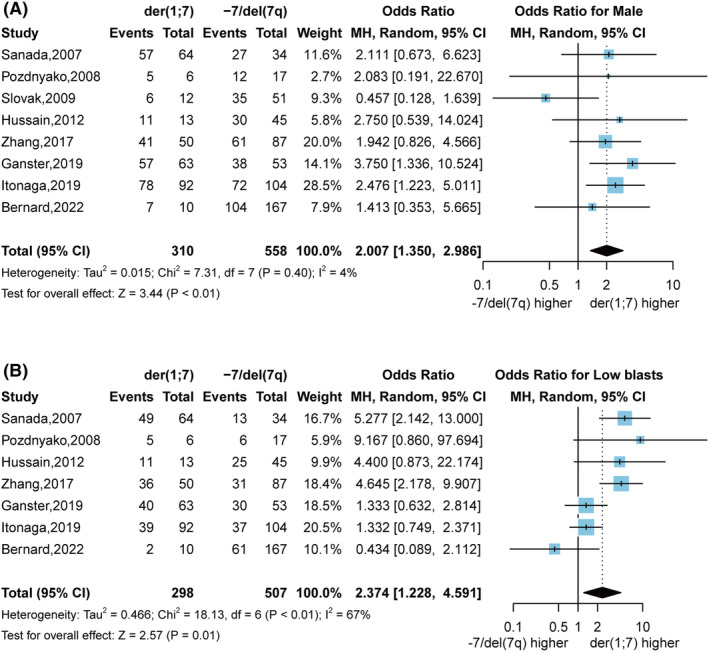
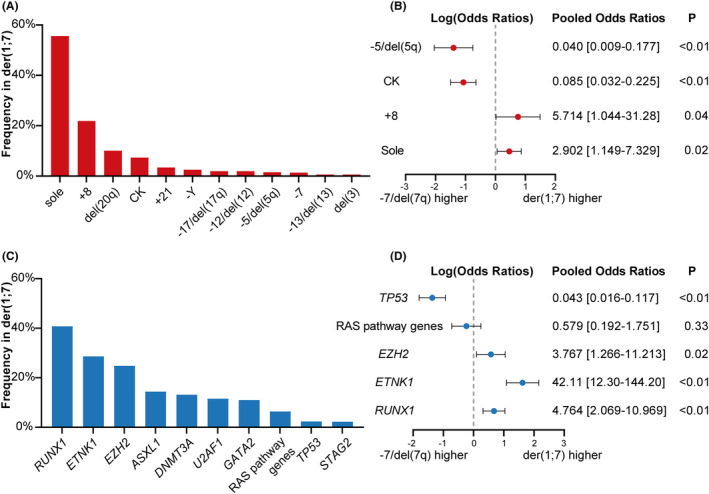
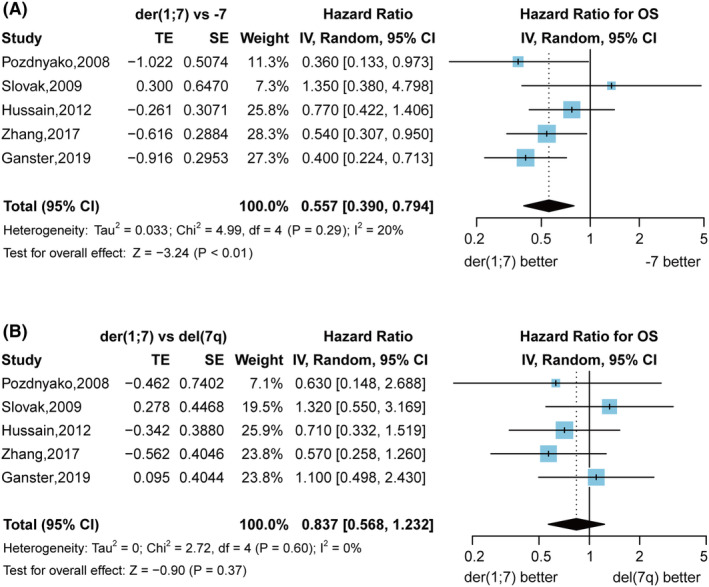
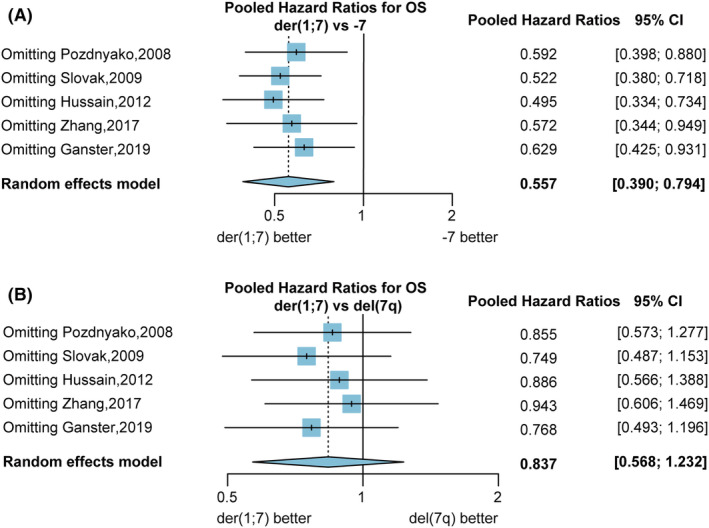
Results: The comparative meta-analyses included 405 MDS patients with der(1;7) from nine studies. The analysis revealed that der(1;7) was associated with a greater male preponderance (86.1% vs. 68.3%, Odds Ratios (ORs) 2.007, p < 0.01) than -7/del(7q), lower platelets counts compared to del(7q), higher hemoglobin levels than -7, lower absolute neutrophil counts, and higher percentage of patients with non-excess blasts (66.9% vs. 41.3%, ORs 2.374, p = 0.01) in comparison with -7/del(7q). The der(1;7) existed more as a sole karyotype aberration (55.6% vs. 37.0%, ORs 2.902, p = 0.02), co-occurred more often with +8 (22.7% vs. 4.2%, ORs 5.714, p = 0.04) whereas less -5/del(5q) (1.5% vs. 41.3%, ORs 0.040, p < 0.01) and complex karyotype (7.3% vs. 54.8%, OR 0.085, p < 0.01). The der(1;7) was associated with higher frequencies of RUNX1 (40.8% vs. 12.3%, ORs 4.764, p < 0.01), ETNK1 (28.1% vs. 2.5%, ORs 42.106, p < 0.01) and EZH2 (24.8% vs. 6.9%, ORs 3.767, p = 0.02) mutations, but less TP53 mutation (2.4% vs. 45.3%, ORs 0.043, p < 0.01). Moreover, der(1;7) patients had longer time to progression (Hazard Ratios (HRs) 0.331, p = 0.02), better overall survival (OS) than -7 patients (HRs 0.557, p < 0.01), but similar OS with del(7q) patients (HRs 0.837, p = 0.37).
Conclusion: The findings revealed distinct clinical, cytogenetic, and molecular characteristics distinguishing der(1;7) from -7/del(7q), indicating der(1;7) defines a unique subtype within MDS with monosomy 7q. These findings support classifying der(1;7) as a separate MDS entity in future.
Keywords: cytogenetics; meta‐analysis; mutations; myelodysplastic syndrome.
© 2023 The Authors. Cancer Medicine published by John Wiley & Sons Ltd.
Conflict of interest statement
No potential conflict of interest was reported by the authors.
Figures
Similar articles
-
Unbalanced translocation der(1;7)(q10;p10) defines a unique clinicopathological subgroup of myeloid neoplasms.Leukemia. 2007 May;21(5):992-7. doi: 10.1038/sj.leu.2404619. Epub 2007 Feb 22. Leukemia. 2007. PMID: 17315020
-
Does MDS with der(1;7)(q10;p10) constitute a distinct risk group? A retrospective single institutional analysis of clinical/pathologic features compared to -7/del(7q) MDS.Cancer Genet Cytogenet. 2009 Sep;193(2):78-85. doi: 10.1016/j.cancergencyto.2009.04.013. Cancer Genet Cytogenet. 2009. PMID: 19665067
-
Comprehensive analysis of isolated der(1;7)(q10;p10) in a large international homogenous cohort of patients with myelodysplastic syndromes.Genes Chromosomes Cancer. 2019 Oct;58(10):689-697. doi: 10.1002/gcc.22760. Epub 2019 Apr 30. Genes Chromosomes Cancer. 2019. PMID: 30994215
-
5q- syndrome-like features as the first manifestation of myelodysplastic syndrome in a patient with an unbalanced whole-arm translocation der(5;19)(p10;q10).Int J Hematol. 2017 May;105(5):692-696. doi: 10.1007/s12185-016-2160-6. Epub 2016 Dec 2. Int J Hematol. 2017. PMID: 27914067 Review.
-
[Characteristics of myelodysplastic syndromes with der(1;7)(q10;p10)].Rinsho Ketsueki. 2023;64(12):1519-1522. doi: 10.11406/rinketsu.64.1519. Rinsho Ketsueki. 2023. PMID: 38220152 Review. Japanese.
References
Publication types
MeSH terms
Supplementary concepts
Grants and funding
LinkOut - more resources
Full Text Sources
Medical
Research Materials
Miscellaneous
