. 2024 Mar;13(3):410-423.
doi: 10.1002/psp4.13092. Epub 2024 Jan 2.

Clofazimine pharmacokinetics in HIV-infected adults with diarrhea: Implications of diarrheal disease on absorption of orally administered therapeutics

Affiliations

Clofazimine pharmacokinetics in HIV-infected adults with diarrhea: Implications of diarrheal disease on absorption of orally administered therapeutics

Cindy X Zhang et al. CPT Pharmacometrics Syst Pharmacol. 2024 Mar.

Abstract

Oral drug absorption kinetics are usually established in populations with a properly functioning gastrointestinal tract. However, many diseases and therapeutics can alter gastrointestinal physiology and cause diarrhea. The extent of diarrhea-associated impact on drug pharmacokinetics has not been quantitatively described. To address this knowledge gap, we used a population pharmacokinetic modeling approach with data collected in a phase IIa study of matched human immunodeficiency virus (HIV)-infected adults with/without cryptosporidiosis and diarrhea to examine diarrhea-associated impact on oral clofazimine pharmacokinetics. A population pharmacokinetic model was developed with 428 plasma samples from 23 HIV-infected adults with/without Cryptosporidium infection using nonlinear mixed-effects modeling. Covariates describing cryptosporidiosis-associated diarrhea severity (e.g., number of diarrhea episodes, diarrhea grade) or HIV infection (e.g., viral load, CD4+ T cell count) were evaluated. A two-compartment model with lag time and first-order absorption and elimination best fit the data. Maximum diarrhea grade over the study duration was found to be associated with a more than sixfold reduction in clofazimine bioavailability. Apparent clofazimine clearance, intercompartmental clearance, central volume of distribution, and peripheral volume of distribution were 3.71 L/h, 18.2 L/h (interindividual variability [IIV] 45.0%), 473 L (IIV 3.46%), and 3434 L, respectively. The absorption rate constant was 0.625 h-1 (IIV 149%) and absorption lag time was 1.83 h. In conclusion, the maximum diarrhea grade observed for the duration of oral clofazimine administration was associated with a significant reduction in clofazimine bioavailability. Our results highlight the importance of studying disease impacts on oral therapeutic pharmacokinetics to inform dose optimization and maximize the chance of treatment success.


Conflict of interest statement

The authors declared no competing interests for this work.

Figures

FIGURE 1
FIGURE 1
Overview of clofazimine phase IIa clinical trial pharmacokinetic (PK) substudy. (a) The trial consisted of two parts, Parts A and B. Part A participants were HIV‐infected, tested positive for Cryptosporidium infection by qPCR, and had persistent diarrhea at enrollment. Part A participants were randomly assigned at approximately 1:1 to receive either clofazimine (n = 12) or placebo (n = 10) orally three times daily (t.i.d.) for 5 consecutive days. Part B participants were Cryptosporidium negative and diarrhea free at enrollment. All Part B participants (n = 11) received clofazimine orally t.i.d. for 5 days. The dose of clofazimine was determined by each participant's body weight at enrollment. Participants who weighed greater than or equal to 50 kg received 100 mg clofazimine each dose, whereas those who weighed less than 50 kg received 50 mg clofazimine each dose. Only data from Part A and Part B participants who received clofazimine treatment (n = 23) were included for the population PK analysis. (b) Dosing and sampling schemes for Part A and Part B participants who received clofazimine treatment. Oral clofazimine was administered at approximately 5 a.m., 11 a.m., and 6 p.m. on study Days 1–5. Blood samples were collected for PK measurements on Day 1 before the first dose; 2, 3, and 4 h after the first dose, and immediately before the second and third doses. On Days 2 and 3, predose blood samples were collected for every dose. On Day 5, predose samples for every dose and 2, 3, and 4 h post–first dose samples were taken.
FIGURE 2
FIGURE 2
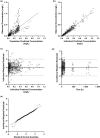
Goodness‐of‐fit plots of the final population pharmacokinetic model for clofazimine. (a) Observed plasma concentration against population predicted concentration, (b) observed plasma concentration against individual predicted concentration, (c) individual weighted residuals against individual predicted concentrations, (d) conditional weighted residuals against time, and (e) quantile–quantile plot of individual weighted residuals.
FIGURE 3
FIGURE 3
Prediction‐corrected visual predictive check for clofazimine concentration versus time spanning (a) the total duration of the study including the follow‐up visits and (b) the initial 6 days of the study. Open circles represent prediction‐corrected observed plasma concentrations. The observed 5th and 95th percentiles are depicted by dashed lines, and the observed median is represented by the solid line. The shaded regions represent the corresponding model‐predicted 90% confidence intervals around the predicted 5th and 95th percentiles and the median, based on 1000 simulations.
FIGURE 4
FIGURE 4
Clofazimine plasma concentrations categorized by overall maximum diarrhea grade. Gold open circles represent pharmacokinetic samples collected from participants who did not have diarrhea for the duration of the study. Dark blue triangles represent samples from participants who only had Grade 1 (mild) diarrhea during the study. Maroon diamonds represent samples from participants who had at least one episode of Grade 2 (severe) diarrhea during the study.

References

    1. Abuhelwa AY, Williams DB, Upton RN, Foster DJR. Food, gastrointestinal pH, and models of oral drug absorption. Eur J Pharm Biopharm. 2017;112:234‐248. doi:10.1016/j.ejpb.2016.11.034 - DOI - PubMed
    1. Effinger A, O'Driscoll CM, McAllister M, Fotaki N. Impact of gastrointestinal disease states on oral drug absorption – implications for formulation design – a PEARRL review. J Pharm Pharmacol. 2019;71(4):674‐698. doi:10.1111/jphp.12928 - DOI - PubMed
    1. Jamei M, Turner D, Yang J, et al. Population‐based mechanistic prediction of Oral drug absorption. AAPS J. 2009;11(2):225‐237. doi:10.1208/s12248-009-9099-y - DOI - PMC - PubMed
    1. Kostewicz ES, Aarons L, Bergstrand M, et al. PBPK models for the prediction of in vivo performance of oral dosage forms. Eur J Pharm Sci. 2014;57:300‐321. doi:10.1016/j.ejps.2013.09.008 - DOI - PubMed
    1. Vinarov Z, Abdallah M, Agundez JAG, et al. Impact of gastrointestinal tract variability on oral drug absorption and pharmacokinetics: an UNGAP review. Eur J Pharm Sci. 2021;162:105812. doi:10.1016/j.ejps.2021.105812 - DOI - PubMed

Publication types