. 2023 Dec 18:14:1264179.
doi: 10.3389/fimmu.2023.1264179. eCollection 2023.

Two birds with one stone: human SIRPα nanobodies for functional modulation and in vivo imaging of myeloid cells

Affiliations

Two birds with one stone: human SIRPα nanobodies for functional modulation and in vivo imaging of myeloid cells

Teresa R Wagner et al. Front Immunol. .

Abstract

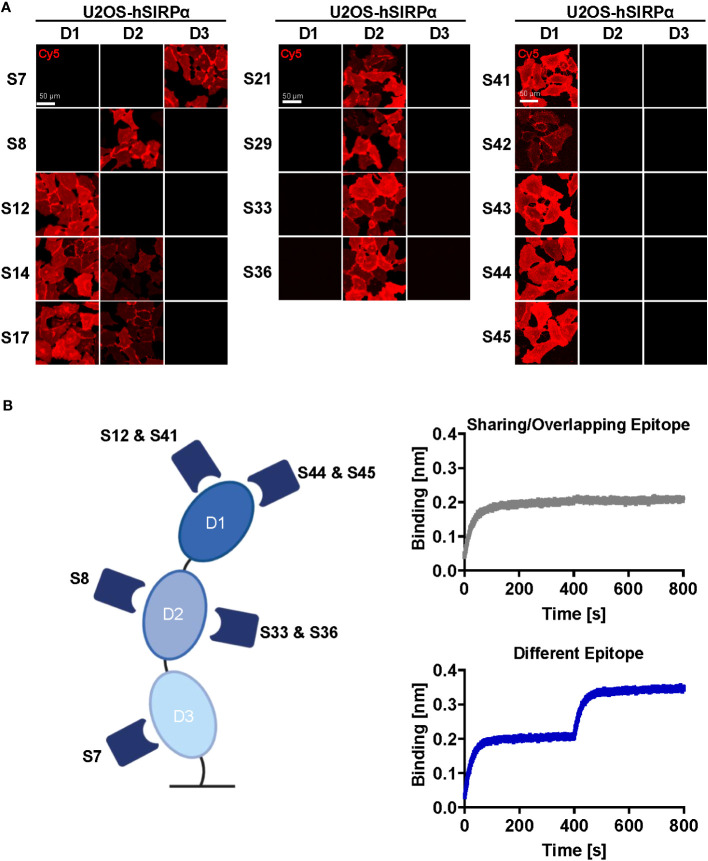
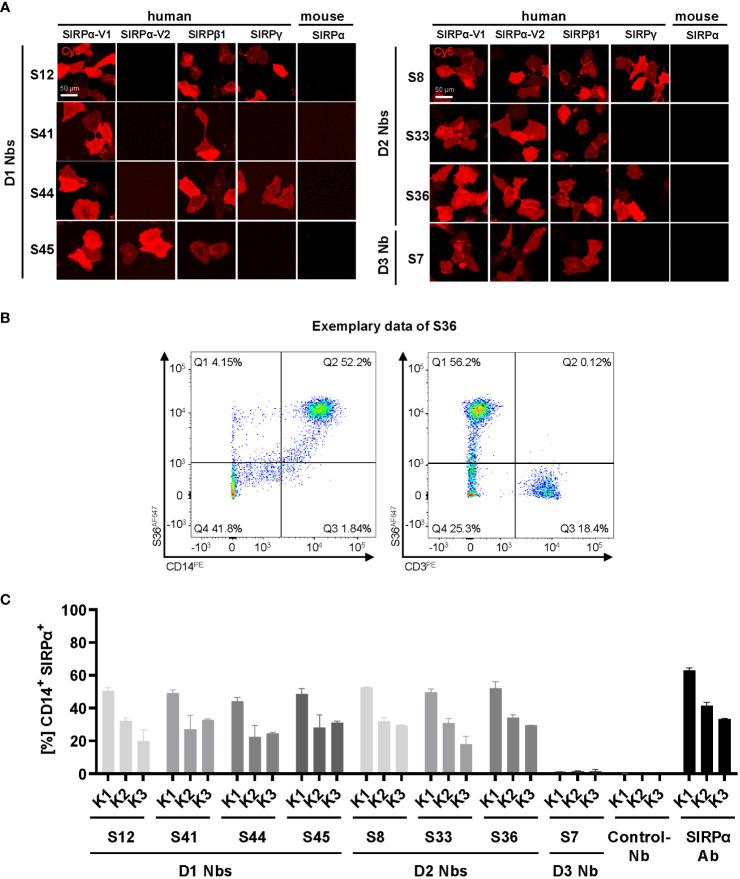
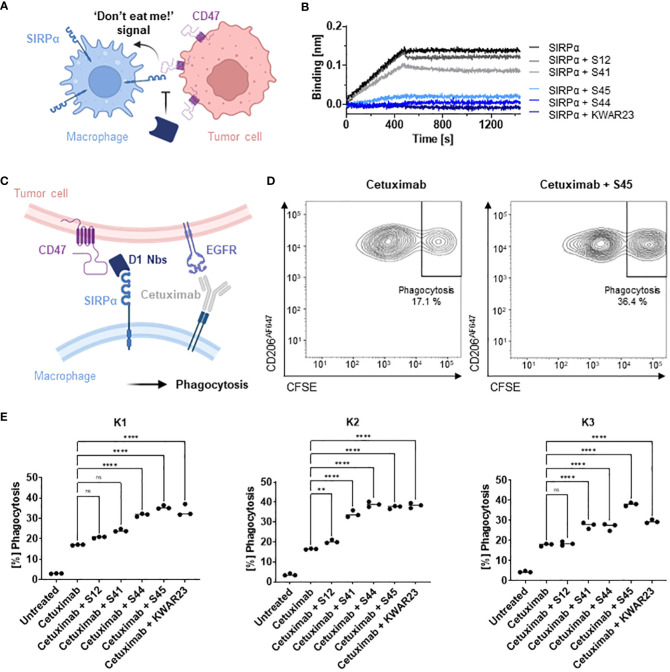
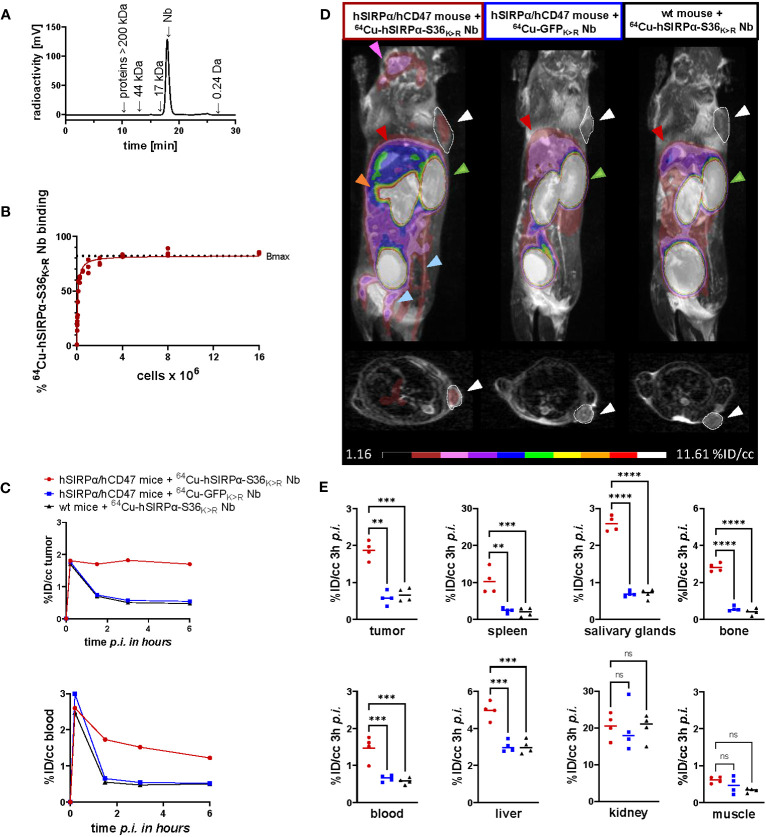
Signal-regulatory protein α (SIRPα) expressed by myeloid cells is of particular interest for therapeutic strategies targeting the interaction between SIRPα and the "don't eat me" ligand CD47 and as a marker to monitor macrophage infiltration into tumor lesions. To address both approaches, we developed a set of novel human SIRPα (hSIRPα)-specific nanobodies (Nbs). We identified high-affinity Nbs targeting the hSIRPα/hCD47 interface, thereby enhancing antibody-dependent cellular phagocytosis. For non-invasive in vivo imaging, we chose S36 Nb as a non-modulating binder. By quantitative positron emission tomography in novel hSIRPα/hCD47 knock-in mice, we demonstrated the applicability of 64Cu-hSIRPα-S36 Nb to visualize tumor infiltration of myeloid cells. We envision that the hSIRPα-Nbs presented in this study have potential as versatile theranostic probes, including novel myeloid-specific checkpoint inhibitors for combinatorial treatment approaches and for in vivo stratification and monitoring of individual responses during cancer immunotherapies.

Keywords: PET imaging tracer; SIRPalpha; immune checkpoint inhibitor (ICI); myeloid cells; nanobodies (Nbs); theranostics.


Conflict of interest statement

DSo, MK, BP, TW, BT, PK, and UR are named as inventors on a patent application claiming the use of the described nanobodies for diagnosis and therapeutics filed by the NMI Natural and Medical Sciences Institute and the University of Tübingen. AR, FS, and KT are employees of the company genOway. The remaining authors declare that the research was conducted in the absence of any commercial or financial relationships that could be construed as a potential conflict of interest.

Figures

Figure 1
Figure 1
Biochemical characterization of hSIRPα Nbs. (A) Amino acid (aa) sequences of the complementarity-determining region (CDR) 3 from 14 unique hSIRPα Nbs (complete sequences shown in Supplementary Table 1 ) identified by a bidirectional screening strategy. Nbs S7 to S36 were selected against full-length hSIRPα and Nbs S41 to 45 against domain 1 of hSIRPα (hSIRPαD1). (B) Recombinant expression and purification of hSIRPα Nbs using immobilized metal affinity chromatography (IMAC) and size exclusion chromatography (SEC). Coomassie staining of purified Nbs is shown. (C) Stability analysis using nano–differential scanning fluorimetry (nanoDSF) displaying fluorescence ratio (350 nm/330 nm) and light intensity loss due to scattering shown as first derivative exemplarily shown for Nb S36 (upper panel). Data are shown as mean value of three technical replicates. BLI-based affinity measurements exemplarily shown for Nb S36 (bottom panel). Biotinylated hSIRPα was immobilized on streptavidin biosensors. Kinetic measurements were performed using four concentrations of purified Nbs ranging from 0.625 nM to 5 nM (displayed with gradually darker shades of color). The binding affinity (KD) was calculated from global 1:1 fits shown as dashed lines. (D) Summary table of stability and affinity analysis of selected hSIRPα Nbs. Melting temperature (TM) and aggregation temperature (TAgg) determined by nanoDSF shown as mean ± SD of three technical replicates. Affinities (KD), association constants (k on), and dissociation constants (k off) determined by BLI using four concentrations of purified Nbs shown as mean ± SD. (E) Representative images of hSIRPα and GFP-coexpressing U2OS cells stained with hSIRPα Nbs of three technical replicates. Images show individual Nb staining detected with anti-VHH-Cy5 (red), intracellular IRES-derived GFP signal (green), nuclei staining (Hoechst, blue), and merged signals; scale bar, 50 µm.
Figure 2
Figure 2
Epitope characterization of hSIRPα Nbs. (A) Domain mapping analysis by immunofluorescence staining with hSIRPα Nbs on U2OS cells displaying human hSIRPα domain 1 (D1), domain 2 (D2), or domain 3 (D3) at their surface. Representative images of live cells stained with individual Nbs in combination with Cy5-labeled anti-VHH of three technical replicates are shown; scale bar, 50 µm. (B) Epitope binning analysis of hSIRPα Nbs by BLI. Graphical summary of epitope binning analysis on the different hSIRPα domains (left panel). Representative sensograms (n = 1) of combinatorial Nb binding to recombinant hSIRPα on sharing/overlapping epitopes or on different epitopes (right panel).
Figure 3
Figure 3
Cross-reactivity and binding specificity of hSIRPα Nbs. (A) Cross-reactivity analysis of hSIRPα Nbs by immunofluorescence staining on U2OS cells displaying hSIRPα-V1, hSIRPα-V2, hSIRPβ1, hSIRPγ, or mouse SIRPα at their surface. Representative images of live cells stained with individual Nbs in combination with Cy5-labeled anti-VHH are shown of three technical replicates; scale bar, 50 µm. (B) Flow cytometry analysis of human peripheral blood mononuclear cells (PBMCs) stained with fluorescently labeled hSIRPα Nbs (AlexaFluor 647, AF647). Flow cytometry plots of Nb S36 staining on CD14+ and CD3+ PBMC populations derived from human donor K1 are shown as an example. (C) Flow cytometry analysis of hSIRPα Nbs staining CD14+ PBMCs of three different human donors (K1, K2, and K3). As control, PBMCs were stained with a Pep Nb (Control-Nb) and a SIRPα-antibody (positive control). Data are presented as mean ± SD of three technical replicates.
Figure 4
Figure 4
Potential of hSIRPαD1 Nbs to augment phagocytosis of tumor cells. (A) Graphical illustration of hSIRPα/hCD47 interaction leading to suppression of macrophage-mediated phagocytosis of tumor cells. (B) Competition analysis of hSIRPα-binding to hCD47 in the presence of hSIRPαD1 Nbs (S12, S41, S44, and S45) by BLI (n = 1). Biotinylated hCD47 was immobilized on streptavidin biosensors, and a mixture of 20 nM hSIRPα and 250 nM of hSIRPαD1 Nbs or 5 nM of KWAR23 was applied to elucidate potential inhibition of hSIRPα binding to hCD47. (C) Schematic illustration of macrophage-mediated phagocytosis of tumor cells by hSIRPαD1 Nbs and tumor-opsonizing antibodies (e.g., the anti-EGFR antibody cetuximab). (D) Phagocytosis of CFSE–labeled DLD-1 cells by human monocyte-derived macrophages. A representative flow cytometry plot of the phagocytosis assay of cetuximab only and combinatorial treatment of cetuximab and hSIRPα Nb S45 with donor K1–derived macrophages is shown. (E) Quantitative analysis of the phagocytosis assay. Percent of phagocytosis of CFSE-labeled DLD-1 cells analyzed for macrophages derived from three different donors (K1, left; K2, center; K3, right) in different conditions is shown. Data are shown as individual and mean value of three technical replicates. p < 0.05 was considered statistically significant (*) and marked as ** for p < 0.01, *** for p < 0.001, and **** for p < 0.0001; non-significant results were marked with ns.
Figure 5
Figure 5
PET imaging with 64Cu-hSIRPα-S36K>R Nb. (A) Radiochemical purity of 64Cu-hSIRPα-S36K>R Nb was assessed using high-performance liquid chromatography (HPLC). (B) Antigen excess binding assay to determine the maximum binding (Bmax) of 64Cu-hSIRPα-S36K>R Nb, referred to as immunoreactive fraction. 64Cu-hSIRPα-S36K>R Nb (1 ng) was applied to an increasing number of HT1080-hSIRPα cells of three technical replicates and binding curves were analyzed using the one-site nonlinear regression model. (C) Quantification of 64Cu-hSIRPα-S36K>R Nb tumor and blood uptake of s.c. MC38-hCD47 colon carcinoma-bearing hSIRPα/hCD47 mice over 6 h after injection. 64Cu-hSIRPα-S36K>R Nb accumulation is compared to the control groups injected with control Nb or in MC38 wt mice injected with 64Cu-hSIRPα-S36K>R Nb. The resulting values were decay-corrected and presented as percentage of injected dose per cubic centimeter (%ID/cc). Representative data of one animal per group is shown. (D) Representative fused MIP (maximum intensity projection) PET/MR images of mice 3 h after 64Cu-hSIRPα-S36K>R (n = 4) or control Nb injection (each n = 4). PET signal in hSIRPα expressing myeloid cell–rich organs is compared to both control groups. Sites with increased 64Cu-hSIRPα-S36K>R Nb uptake are marked by colored arrows indicating the tumor (white and outlined), spleen (orange), bone (blue), salivary glands (purple), kidneys (green), and liver (red). In addition, axial sections of PET/MR images are shown where the tumors are highlighted with white circles and arrows. (E) Quantification of 64Cu-hSIRPα-S36K>R Nb in hSIRPα expressing myeloid cell–rich organs. High accumulation was also detected in sites of excretion, namely, the kidney and liver. The resulting values were decay-corrected and presented as percentage of injected dose per cubic centimeter (%ID/cc). Data are shown as individual plots and mean value (n = 4). p < 0.05 was considered statistically significant (*) and marked as ** for p < 0.01, *** for p < 0.001, and **** for p < 0.0001; non-significant results were marked with ns.

References

    1. Binnewies M, Roberts EW, Kersten K, Chan V, Fearon DF, Merad M, et al. . Understanding the tumor immune microenvironment (TIME) for effective therapy. Nat Med (2018) 24(5):541–50. doi: 10.1038/s41591-018-0014-x - DOI - PMC - PubMed
    1. DeNardo DG, Ruffell B. Macrophages as regulators of tumour immunity and immunotherapy. Nat Rev Immunol (2019) 19(6):369–82. doi: 10.1038/s41577-019-0127-6 - DOI - PMC - PubMed
    1. Jin M-Z, Jin W-L. The updated landscape of tumor microenvironment and drug repurposing. Signal transduction targeted Ther (2020) 5(1):1–16. doi: 10.1038/s41392-020-00280-x - DOI - PMC - PubMed
    1. Labani-Motlagh A, Ashja-Mahdavi M, Loskog A. The tumor microenvironment: a milieu hindering and obstructing antitumor immune responses. Front Immunol (2020) 11:940. doi: 10.3389/fimmu.2020.00940 - DOI - PMC - PubMed
    1. Mantovani A, Allavena P, Sica A, Balkwill F. Cancer-related inflammation. Nature (2008) 454(7203):436–44. doi: 10.1038/nature07205 - DOI - PubMed

Publication types

Substances