. 2024 Jan 1;14(1):1-16.
doi: 10.7150/thno.89913. eCollection 2024.

Bile acid-containing lipid nanoparticles enhance extrahepatic mRNA delivery

Affiliations

Bile acid-containing lipid nanoparticles enhance extrahepatic mRNA delivery

Savan K Patel et al. Theranostics. .

Abstract

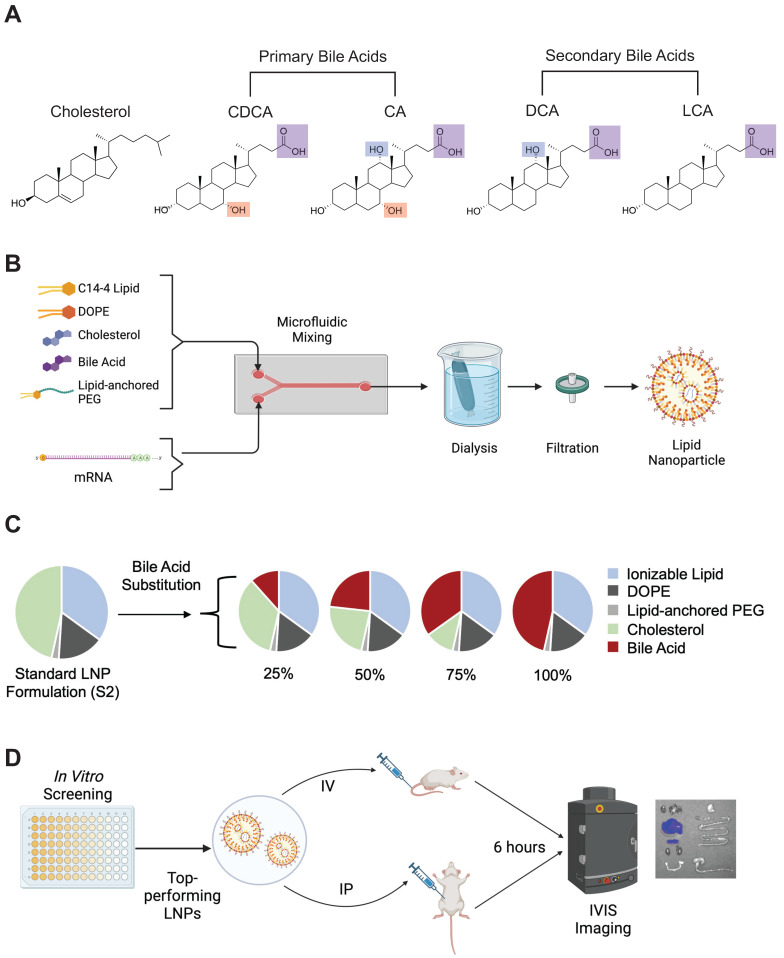
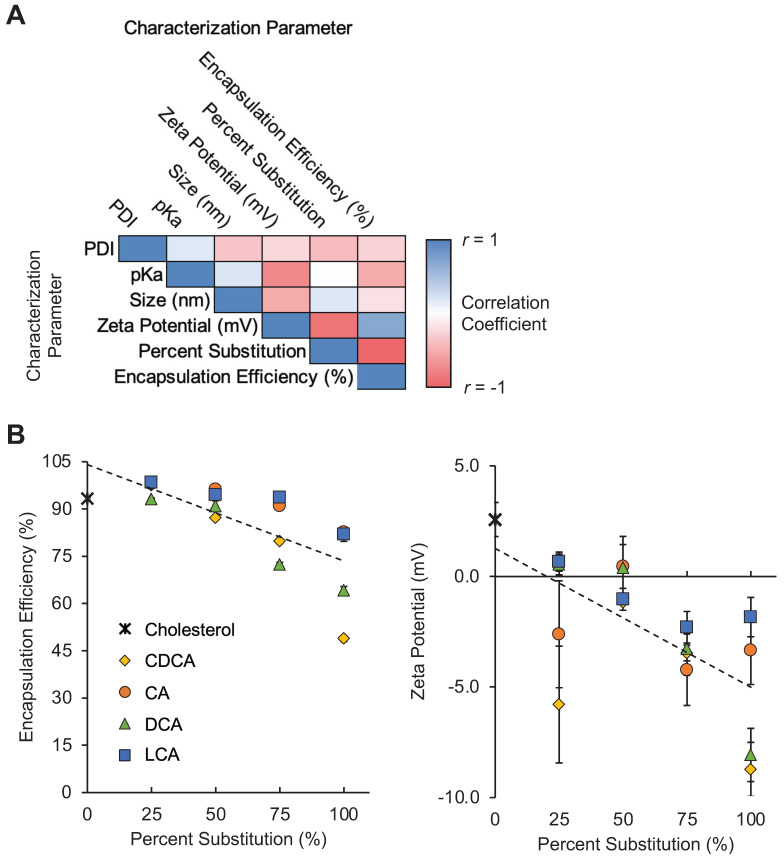
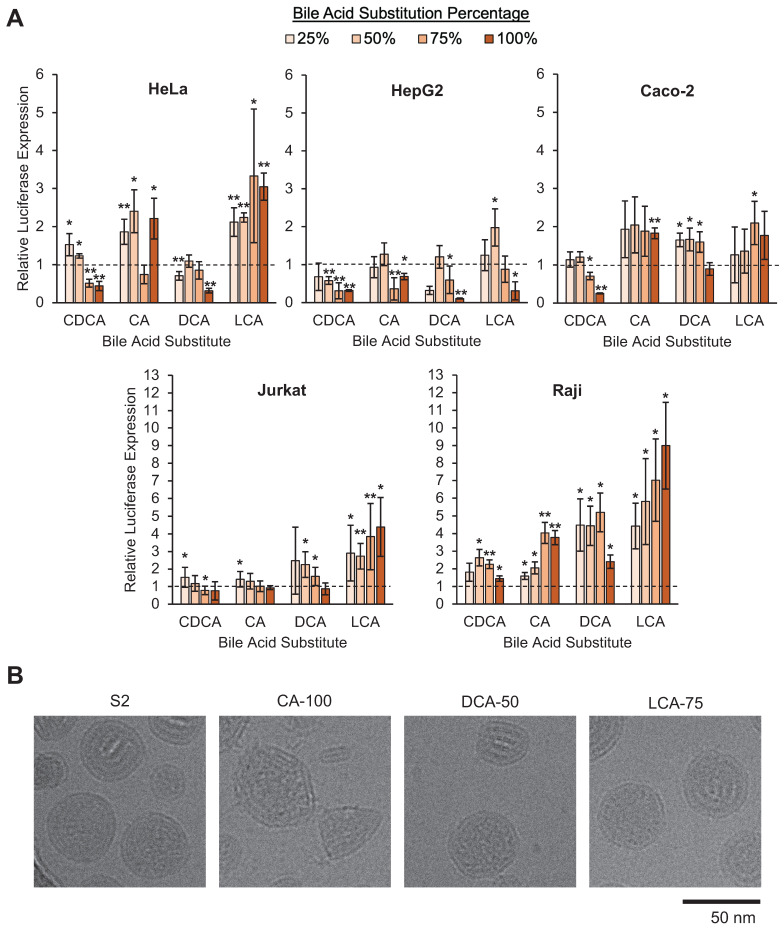
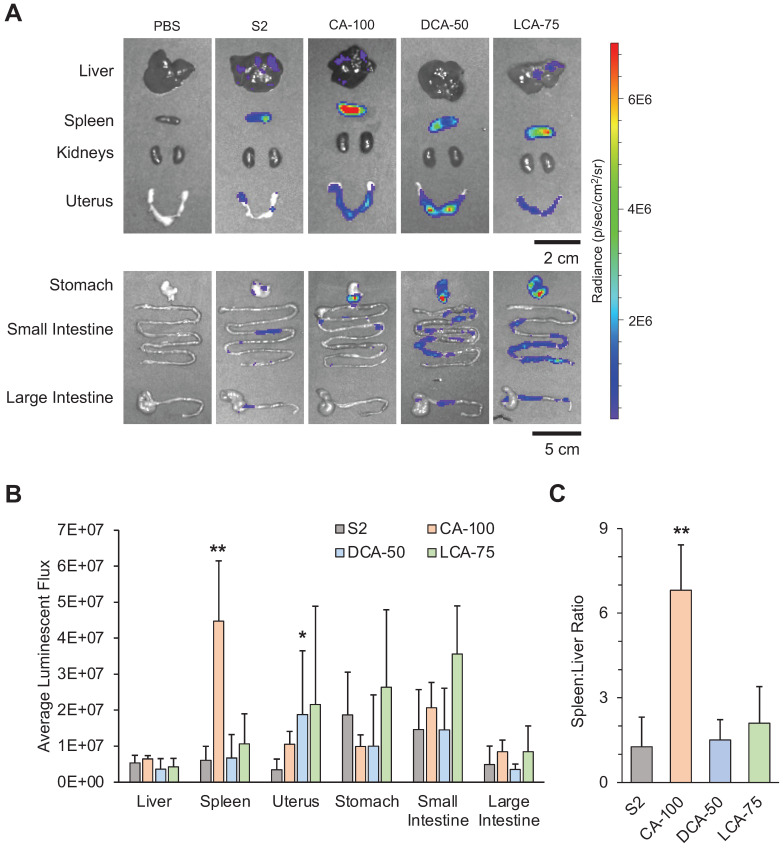
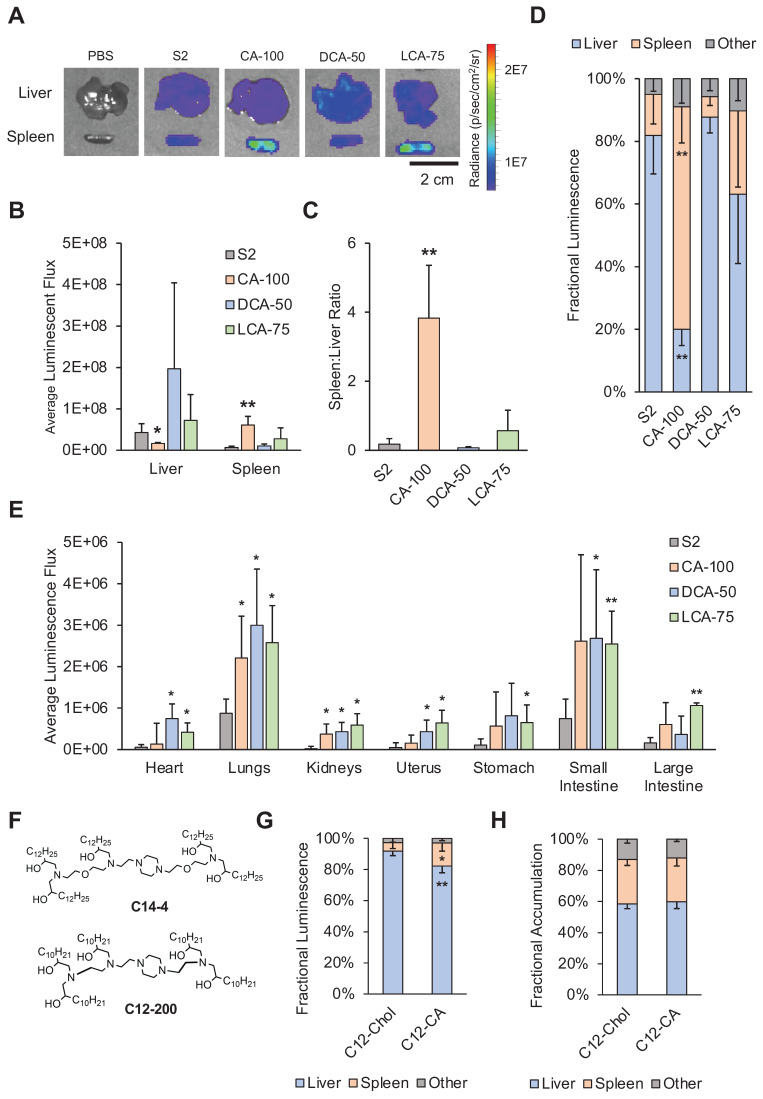
Lipid nanoparticles (LNPs) have emerged as a viable, clinically-validated platform for the delivery of mRNA therapeutics. LNPs have been utilized as mRNA delivery systems for applications including vaccines, gene therapy, and cancer immunotherapy. However, LNPs, which are typically composed of ionizable lipids, cholesterol, helper lipids, and lipid-anchored polyethylene glycol, often traffic to the liver which limits the therapeutic potential of the platform. Several approaches have been proposed to resolve this tropism such as post-synthesis surface modification or the addition of synthetic cationic lipids. Methods: Here, we present a strategy for achieving extrahepatic delivery of mRNA involving the incorporation of bile acids, a naturally-occurring class of cholesterol analogs, during LNP synthesis. We synthesized a series of bile acid-containing C14-4 LNPs by replacing cholesterol with bile acids (cholic acid, chenodeoxycholic acid, deoxycholic acid, or lithocholic acid) at various ratios. Results: Bile acid-containing LNPs (BA-LNPs) were able to reduce delivery to liver cells in vitro and improve delivery in a variety of other cell types, including T cells, B cells, and epithelial cells. Our subsequent in vivo screening of selected LNP candidates injected intraperitoneally or intravenously identified a highly spleen tropic BA-LNP: CA-100, a four-component LNP containing cholic acid and no cholesterol. These screens also identified BA-LNP candidates demonstrating promise for other mRNA therapeutic applications such as for gastrointestinal or immune cell delivery. We further found that the substitution of cholic acid for cholesterol in an LNP formulation utilizing a different ionizable lipid, C12-200, also shifted mRNA delivery from the liver to the spleen, suggesting that this cholic acid replacement strategy may be generalizable. Conclusion: These results demonstrate the potential of a four-component BA-LNP formulation, CA-100, for extrahepatic mRNA delivery that could potentially be utilized for a range of therapeutic and vaccine applications.

Keywords: extrahepatic delivery; lipid nanoparticles; mRNA.


Conflict of interest statement

Competing Interests: SKP, MMB, and MJM are inventors on patents related to this work filed by the Trustees of the University of Pennsylvania.

Figures

Figure 1
Figure 1
Bile acid-containing lipid nanoparticle (BA-LNP) design, synthesis, and optimization. (A) Structures of cholesterol, primary bile acids (chenodeoxycholic acid [CDCA] and cholic acid [CA]), and secondary bile acids (deoxycholic acid [DCA] and lithocholic acid [LCA]) with carboxylic acid groups highlighted in purple, C7 hydroxy groups highlighted in red, and C12 hydroxy groups highlighted in blue. (B) Schematic of LNP components, formulation, post-synthesis processing, and expected structure. (C) Design of an LNP library incorporating the substitution of various bile acids for unmodified cholesterol. (D) High throughput screening of LNPs in vitro to identify LNP formulation candidates for in vivo evaluation. Top-performing LNPs from the in vitro screen are assessed for biodistribution following either intraperitoneal (IP) injection or intravenous (IV) injection.
Figure 2
Figure 2
Characterization of LNP formulations containing various amounts of bile acids. (A) Correlation matrix of characterization parameters for the 17 LNPs in the library (16 BA-LNP formulations and 1 base formulation). LNPs were grouped by percentage substitution (0, 25, 50, 75, or 100%). Measured characterization parameters include hydrodynamic size, PDI, encapsulation efficiency, zeta potential, and pKa. n = 3 for all measured characterization parameters. (B) Scatter plots of encapsulation efficiency (left) and zeta potential (right) versus bile acid substitution percentage for the LNP library. Least squares linear regression lines were used to visualize trends. n = 3. Error bars denote standard deviation.
Figure 3
Figure 3
In vitro screening of the LNP library and morphologic characterization of selected candidates. (A) Luciferase mRNA delivery in various cell lines. Luciferase expression was normalized to cells treated with S2, the base formulation, after background was subtracted. HeLa cervical cancer cells were treated at 10 ng mRNA / 10,000 cells. HepG2 hepatocytes were treated at 10 ng mRNA / 5,000 cells. Caco-2 intestinal epithelial cells were treated at 100 ng mRNA / 25,000 cells. Jurkat T cells and Raji B cells were treated at 60 ng mRNA / 60,000 cells. Legend denotes percent substitution of each bile acid into the S2 formulation. n = 3 biological replicates. Error bars denote standard deviation. An ANOVA was used to determine if treatment group means differed significantly. *: p<0.05. **: p<0.01 in a post hoc Student's t-test between LNP candidate and S2. (B) Representative cryo-electron microscopy images of S2, CA-100, DCA-50, and LCA-75 to identify morphological variation amongst selected LNPs.
Figure 4
Figure 4
Luciferase mRNA delivery following intraperitoneal injection (1 mg mRNA / kg) of LNPs into mice. Mice were dissected and imaged 6 hours after treatment. (A) Representative IVIS images of mouse organs from each treatment group (PBS, S2, CA-100, DCA-50, and LCA-75). (B) Quantification of total luminescent flux in several organs of the peritoneal cavity (liver, spleen, uterus, stomach, small intestine, and large intestine) following IP injection with S2, CA-100, DCA-50, or LCA-75. Total flux is reported after subtracting background signal from each image. An ANOVA was used to determine if treatment group means differed significantly. (C) Liver-to-spleen total luminescent flux ratios for S2, CA-100, DCA-50, and LCA-75 treatment groups. n = 3 mice per group. Error bars denote standard deviation. For all statistical tests, *: p<0.05. **: p<0.01 in a post hoc Student's t-test between LNP candidate and S2.
Figure 5
Figure 5
Biodistribution studies following intravenous injection of LNPs into mice. For (A) - (F), mice were injected with 1 mg luciferase mRNA / kg and then dissected and imaged 6 hours after treatment. (A) Representative IVIS images of liver and spleen from each treatment group (PBS, S2, CA-100, DCA-50, and LCA-75). (B) Quantification of total luminescent flux in the liver and spleen following IV injection with S2, CA-100, DCA-50, or LCA-75. (C) Liver-to-spleen total luminescent flux ratios for S2, CA-100, DCA-50, and LCA-75 treatment groups. (D) Fractional distribution of luminescence amongst organs (liver, spleen, and all other imaged organs) for mice treated with S2, CA-100, DCA-50, or LCA-75, where other imaged organs include heart, lungs, kidneys, uterus, stomach, small intestine, and large intestine. (E) Quantification of total luminescent flux in heart, lungs, kidneys, uterus, stomach, small intestine, and large intestine following IV injection with S2, CA-100, DCA-50, or LCA-75. (F) Chemical structures of ionizable lipids used in LNP formulations: C14-4 and C12-200. For (G) - (H), mice were injected with DiR-labeled C12-200 LNPs at 1 mg luciferase mRNA / kg and then dissected and imaged 6 hours after treatment. (G) Fractional distribution of luminescence amongst organs (liver, spleen, and all other imaged organs) for mice treated with C12-Chol or C12-CA. (H) Fractional distribution of LNP accumulation, measured by fluorescent signal of DiR, amongst organs (liver, spleen, and all other imaged organs) for mice treated with C12-Chol or C12-CA, where other imaged organs include heart, lungs, kidneys, uterus, stomach, small intestine, and large intestine. For all experiments, n = 4 mice per group. Error bars denote standard deviation. For all statistical tests, *: p<0.05. **: p<0.01 in a post hoc Student's t-test between LNP candidate and S2. Where applicable, an ANOVA was first used to determine if treatment group means differed significantly.

References

    1. Damase TR, Sukhovershin R, Boada C, Taraballi F, Pettigrew RI, Cooke JP. The limitless future of RNA therapeutics. Front Bioeng Biotechnol. 2021;9:628137. - PMC - PubMed
    1. Verma M, Ozer I, Xie W, Gallagher R, Teixeira A, Choy M. The landscape for lipid-nanoparticle-based genomic medicines. Nat Rev Drug Discov. 2023;22:349–50. - PubMed
    1. Wang C, Liu H. Factors influencing degradation kinetics of mRNAs and half-lives of microRNAs, circRNAs, lncRNAs in blood in vitro using quantitative PCR. Sci Rep. 2022;12:7259. - PMC - PubMed
    1. Schoenmaker L, Witzigmann D, Kulkarni JA, Verbeke R, Kersten G, Jiskoot W. et al. mRNA-lipid nanoparticle COVID-19 vaccines: Structure and stability. Int J Pharm. 2021;601:120586. - PMC - PubMed
    1. Mitchell MJ, Billingsley MM, Haley RM, Wechsler ME, Peppas NA, Langer R. Engineering precision nanoparticles for drug delivery. Nat Rev Drug Discov. 2021;20:101–24. - PMC - PubMed