Efficient 3D imaging and pathological analysis of the human lymphoma tumor microenvironment using light-sheet immunofluorescence microscopy
- PMID: 38164148
- PMCID: PMC10750216
- DOI: 10.7150/thno.86221
Efficient 3D imaging and pathological analysis of the human lymphoma tumor microenvironment using light-sheet immunofluorescence microscopy
Abstract
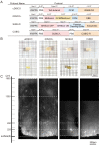
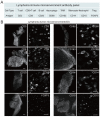
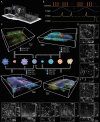
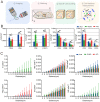
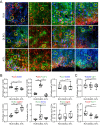
Rationale: The composition and spatial structure of the lymphoma tumor microenvironment (TME) provide key pathological insights for tumor survival and growth, invasion and metastasis, and resistance to immunotherapy. However, the 3D lymphoma TME has not been well studied owing to the limitations of current imaging techniques. In this work, we take full advantage of a series of new techniques to enable the first 3D TME study in intact lymphoma tissue. Methods: Diverse cell subtypes in lymphoma tissues were tagged using a multiplex immunofluorescence labeling technique. To optically clarify the entire tissue, immunolabeling-enabled three-dimensional imaging of solvent-cleared organs (iDISCO+), clear, unobstructed brain imaging cocktails and computational analysis (CUBIC) and stabilization to harsh conditions via intramolecular epoxide linkages to prevent degradation (SHIELD) were comprehensively compared with the ultimate dimensional imaging of solvent-cleared organs (uDISCO) approach selected for clearing lymphoma tissues. A Bessel-beam light-sheet fluorescence microscope (B-LSFM) was developed to three-dimensionally image the clarified tissues at high speed and high resolution. A customized MATLAB program was used to quantify the number and colocalization of the cell subtypes based on the acquired multichannel 3D images. By combining these cutting-edge methods, we successfully carried out high-efficiency 3D visualization and high-content cellular analyses of the lymphoma TME. Results: Several antibodies, including CD3, CD8, CD20, CD68, CD163, CD14, CD15, FOXP3 and Ki67, were screened for labeling the TME in lymphoma tumors. The 3D imaging results of the TME from three types of lymphoma, reactive lymphocytic hyperplasia (RLN), diffuse large B-cell lymphoma (DLBCL), and angioimmunoblastic T-cell lymphoma (AITL), were quantitatively analyzed, and their cell number, localization, and spatial correlation were comprehensively revealed. Conclusion: We present an advanced imaging-based method for efficient 3D visualization and high-content cellular analysis of the lymphoma TME, rendering it a valuable tool for tumor pathological diagnosis and other clinical research.
Keywords: 3D spatial analysis.; light-sheet microscopy; lymphoma tumor microenvironment; three-dimensional imaging; tissue clearing.
© The author(s).
Conflict of interest statement
Competing Interests: The authors have declared that no competing interest exists.
Figures

Similar articles
-
Increased Multiplexity in Optical Tissue Clearing-Based Three-Dimensional Immunofluorescence Microscopy of the Tumor Microenvironment by Light-Emitting Diode Photobleaching.Lab Invest. 2024 Jun;104(6):102072. doi: 10.1016/j.labinv.2024.102072. Epub 2024 Apr 26. Lab Invest. 2024. PMID: 38679160 Free PMC article.
-
Correlative multiscale 3D imaging of mouse primary and metastatic tumors by sequential light sheet and confocal fluorescence microscopy.bioRxiv [Preprint]. 2024 May 19:2024.05.14.594162. doi: 10.1101/2024.05.14.594162. bioRxiv. 2024. Update in: iScience. 2025 Feb 03;28(3):111934. doi: 10.1016/j.isci.2025.111934. PMID: 38798657 Free PMC article. Updated. Preprint.
-
Multiplex immunofluorescence staining and image analysis assay for diffuse large B cell lymphoma.J Immunol Methods. 2020 Mar;478:112714. doi: 10.1016/j.jim.2019.112714. Epub 2019 Nov 26. J Immunol Methods. 2020. PMID: 31783023
-
3D light-sheet fluorescence microscopy in preclinical and clinical drug discovery.Drug Discov Today. 2024 Nov;29(11):104196. doi: 10.1016/j.drudis.2024.104196. Epub 2024 Oct 4. Drug Discov Today. 2024. PMID: 39368696 Review.
-
Whole-mouse clearing and imaging at the cellular level with vDISCO.Nat Protoc. 2023 Apr;18(4):1197-1242. doi: 10.1038/s41596-022-00788-2. Epub 2023 Jan 25. Nat Protoc. 2023. PMID: 36697871 Review.
Cited by
-
From Multi-Omics to Visualization and Beyond: Bridging Micro and Macro Insights in CAR-T Cell Therapy.Adv Sci (Weinh). 2025 May;12(20):e2501095. doi: 10.1002/advs.202501095. Epub 2025 May 11. Adv Sci (Weinh). 2025. PMID: 40349154 Free PMC article. Review.
References
MeSH terms
Substances
LinkOut - more resources
Full Text Sources
Research Materials

