. 2024 Jan 1;15(1):149-165.
doi: 10.7150/jca.89616. eCollection 2024.

Sarcosine dehydrogenase as an immune infiltration-associated biomarker for the prognosis of hepatocellular carcinoma

Affiliations

Sarcosine dehydrogenase as an immune infiltration-associated biomarker for the prognosis of hepatocellular carcinoma

Haixiang Xie et al. J Cancer. .

Abstract

This study was aimed to investigate the prognostic value and clinical significance of sarcosine dehydrogenase (SARDH) in hepatocellular carcinoma (HCC) and to explore the underlying mechanisms. The Cancer Genome Atlas (TCGA), Gene Expression Omnibus (GEO), HPA and CPTAC databases were adopted to analyze the expression of SARDH mRNA and protein between normal liver tissue and HCC, and examine their relationship with clinicopathological features. Kaplan-Meier analysis, Cox regression, as well as nomogram were adopted to explore the prognostic value of SARDH in HCC. Gene Ontology (GO), Kyoto Gene and Genome Encyclopedia (KEGG) together with Gene Set Enrichment Analysis (GSEA) were adopted to analyze the molecular mechanisms and biological functions of SARDH in HCC; while MethSurv, STRING, GeneMANIA, TIMER database data and single-sample gene set enrichment analysis (ssGSEA) algorithm were used for other bioinformatic analysis. Furthermore, immunohistochemistry was used to verify the expression of SARDH. Compared to normal liver tissue, SARDH expression was markedly lower in HCC. A lower SARDH expression was linked with Pathologic T stage (T3&T4), pathologic stage (Stage III&IV), and histologic grade (G3&4), which further indicates worse prognosis. Besides, results of bioinformatic analysis proved that SARDH expression was correlated with immune infiltration. In addition, SARDH hypermethylation was related to a poorer prognosis. SARDH expression was related to several key genes in the Ferroptosis pathway.

Keywords: Biomarkers; Hepatocellular carcinoma; Immune infiltration; Prognostic; Sarcosine dehydrogenase.


Conflict of interest statement

Competing Interests: The authors have declared that no competing interest exists.

Figures

Figure 1
Figure 1
Pan-cancer analysis of SARDH and expression of SARDH in HCC and adjacent normal tissues. (A) Pan-cancer analysis of SARDH in TCGA and GTEx databases. (B) TCGA database of HCC and unpaired normal liver tissues. (C) TCGA database of HCC and paired normal liver tissues. (D) GSE14520. (E) GSE62232. (F) GSE136247. (G) GSE121248. ns: p ≥ 0.05; *p < 0.05; **p < 0.01; ***p < 0.001.
Figure 2
Figure 2
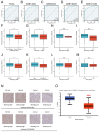
ROC analysis and relationship between SARDH and clinicopathological features. (A) ROC of TCGA. (B) ROC of GSE14520. (C) ROC of GSE62232. (D) ROC of GSE136247. (E) ROC of GSE121248. (F) Pathological stage. (G) T stage. (H) M stage. (I) N stage. (J) Histologic grade. (K) Adjacent liver tissue inflammation. (L) Vascular invasion. (M) AFP. Typical immunohistochemical images of SARDH expression in HCC tissues and normal liver tissues from the HPA database (N) and SARDH protein expression in HCC tissues and normal liver tissues from the CPTAC database in the UALCAN website (O). AFP, alpha-fetoprotein. ns: p ≥ 0.05; *p < 0.05; **p < 0.01; ***p < 0.001.
Figure 3
Figure 3
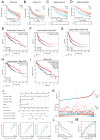
Kaplan-Meier analysis of SARDH in HCC. (A) Survival curves of OS in TCGA. (B) Survival curves of PFI in TCGA. (C) Survival curves of OS in GSE14520. (D) Survival curves of RFS in GSE14520. (E) Survival curves of OS in Kaplan-Meier Plotter. (F) Survival curves of RFS in Kaplan-Meier Plotter. (G) Survival curves of PFS in Kaplan-Meier Plotter. (H) Survival curves of DSS in Kaplan-Meier Plotter. (I) Survival curves for OS in GEPIA. (J)A nomogram and calibration curves for prediction of 1, 3, 5 year overall survival rates of patients with HCC. (K) Risk score, survival time distribution, and gene expression heat map of SARDH in TCGA. (L) Kaplan-Meier survival analysis of OS between high-risk and low-risk groups. (M) Time-dependent ROC curve for risk score models in TCGA. OS, Overall Survival. PFI: Progression Free Interval. RFS, Recurrence Free Survival. PFS, Progression Free Survival. DSS, Disease Free Survival.
Figure 4
Figure 4
Analysis of differentially expressed genes and functional enrichment of SARDH in HCC. (A) Volcano plot of DEGs, with up-regulated genes in red and down-regulated genes in blue, and the top 5 up-regulated and down-regulated genes are labeled by name. (B) Heat map showing the correlation of the top up-regulated and down-regulated genes with SARDH expression. (C) Results of GO-BP enrichment analysis. (D) Results of GO-CC enrichment analysis. (E) Results of GO-MF enrichment analysis. (F) Results of KEGG enrichment analysis.
Figure 5
Figure 5
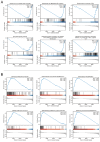
GSEA gene set enrichment results. (A) Enrichment results of GSEA gene set in SARDH low expression group. (B) Enrichment results of GSEA gene set in the SARDH high expression group.
Figure 6
Figure 6
DNA methylation levels of SARDH and its impact on the prognosis of patients with HCC. (A) Correlation between SARDH expression levels and methylation levels and their prognosis. (B-D) Kaplan-Meier curves of 3 methylation sites in SARDH.STRING Protein Interaction Network and GeneMANIA Gene Interaction Network. (E) Protein- Protein interaction network (PPI) and annotation and correlation coefficients of 15 SARDH-related proteins. (F) Gene interaction network.
Figure 7
Figure 7
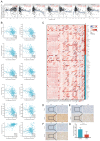
Correlation of SARDH with related genes in ferroptosis pathway. (A) Expression of ferroptosis-related genes in the high and low SARDH expression groups. (B) Heat map of the correlation between SARDH expression and ferroptosis-related genes. Correlation of SARDH with immune infiltration. (C) Comparison of immune infiltration levels of immune cells between high SARDH expression and low SARDH expression groups and correlation between SARDH expression and immune infiltration levels of 24 immune cells. (D)Correlation between SARDH expression and ESTIMATEScore. (E) Correlation between SARDH expression and ImmuneScore. (F) Correlation between SARDH expression and StromalScore. *p < 0.05; **p < 0.01; ***p < 0.001.
Figure 8
Figure 8
(A) Correlation of SARDH in TIMER with the infiltration status of 6 immune cells. (B) Scatter plot of the correlation between SARDH expression and immune infiltration level of immune cells. (C) Heat map of the correlation between SARDH expression and immune checkpoint expression. Typical immunohistochemical images of local hepatocellular carcinoma tissue and corresponding paraneoplastic tissue. (D-F) Typical immunohistochemical images. (G) Histogram of IHC results. ***p < 0.001.

References

    1. Sung H, Ferlay J, Siegel RL, Laversanne M, Soerjomataram I, Jemal A. et al. Global Cancer Statistics 2020: GLOBOCAN Estimates of Incidence and Mortality Worldwide for 36 Cancers in 185 Countries. CA: a cancer journal for clinicians. 2021;71:209–49. - PubMed
    1. Bray F, Ferlay J, Soerjomataram I, Siegel RL, Torre LA, Jemal A. Global cancer statistics 2018: GLOBOCAN estimates of incidence and mortality worldwide for 36 cancers in 185 countries. CA: a cancer journal for clinicians. 2018;68:394–424. - PubMed
    1. Chen S, Cao Z, Prettner K, Kuhn M, Yang J, Jiao L. et al. Estimates and Projections of the Global Economic Cost of 29 Cancers in 204 Countries and Territories From 2020 to 2050. JAMA Oncol. 2023;9:465–72. - PMC - PubMed
    1. Li X, Ramadori P, Pfister D, Seehawer M, Zender L, Heikenwalder M. The immunological and metabolic landscape in primary and metastatic liver cancer. Nat Rev Cancer. 2021;21:541–57. - PubMed
    1. Anwanwan D, Singh SK, Singh S, Saikam V, Singh R. Challenges in liver cancer and possible treatment approaches. Biochim Biophys Acta Rev Cancer. 2020;1873:188314. - PMC - PubMed