

IL1A regulates the inflammation in gout through the Toll-like receptors pathway
- PMID: 38164346
- PMCID: PMC10750337
- DOI: 10.7150/ijms.88447
IL1A regulates the inflammation in gout through the Toll-like receptors pathway
Abstract
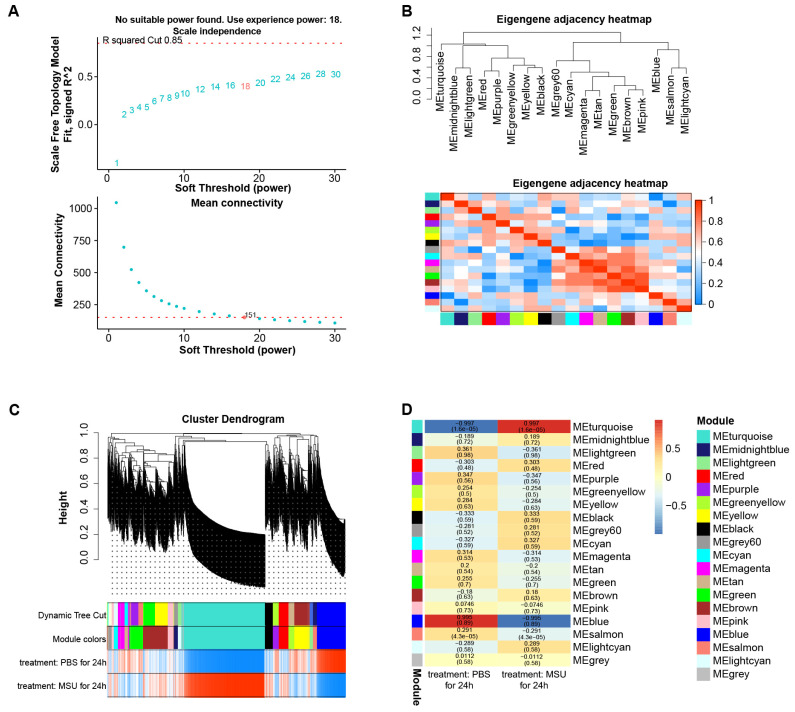
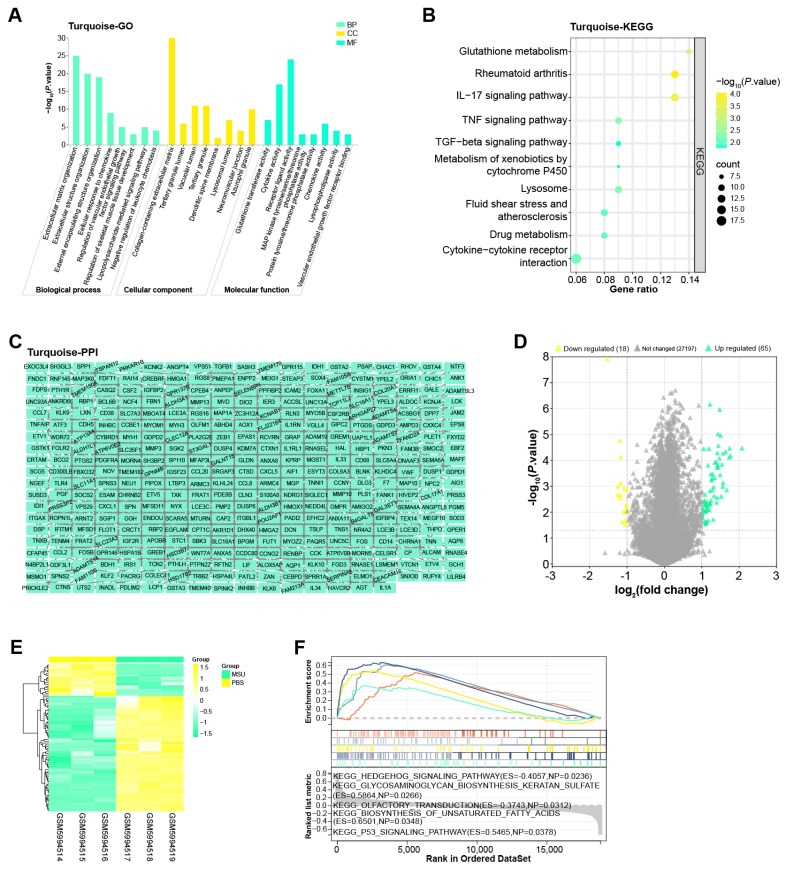
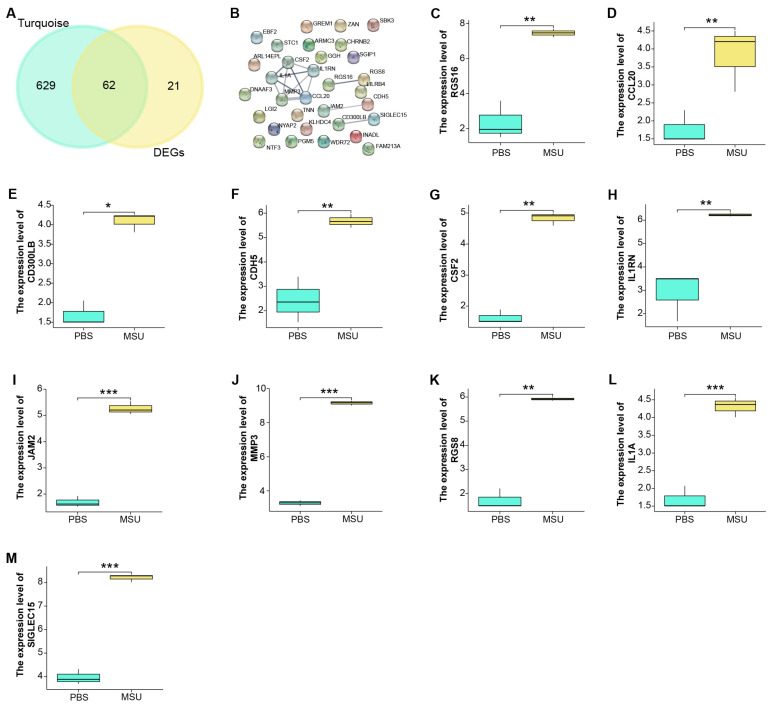
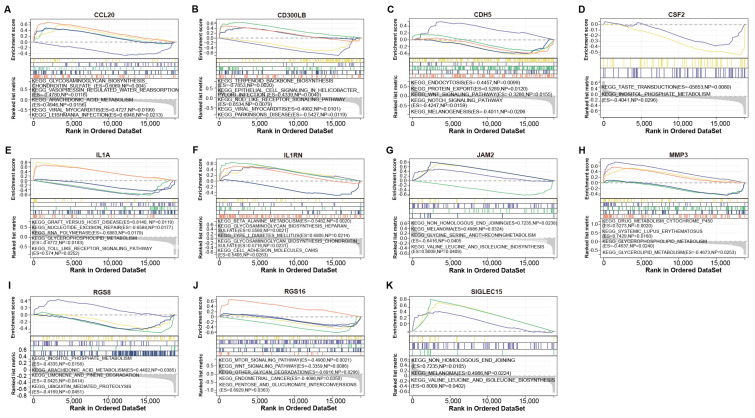
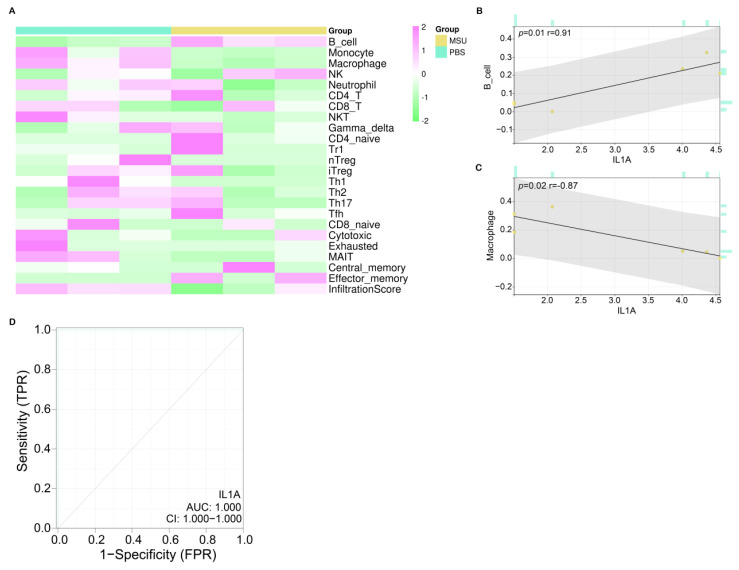
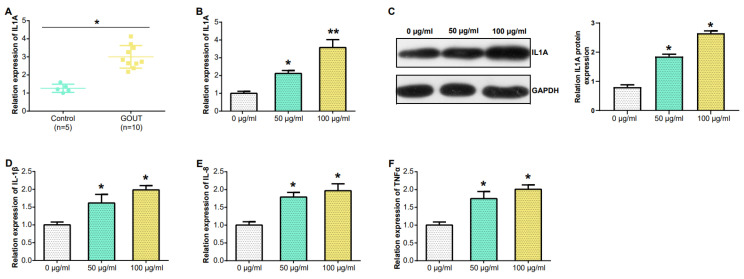
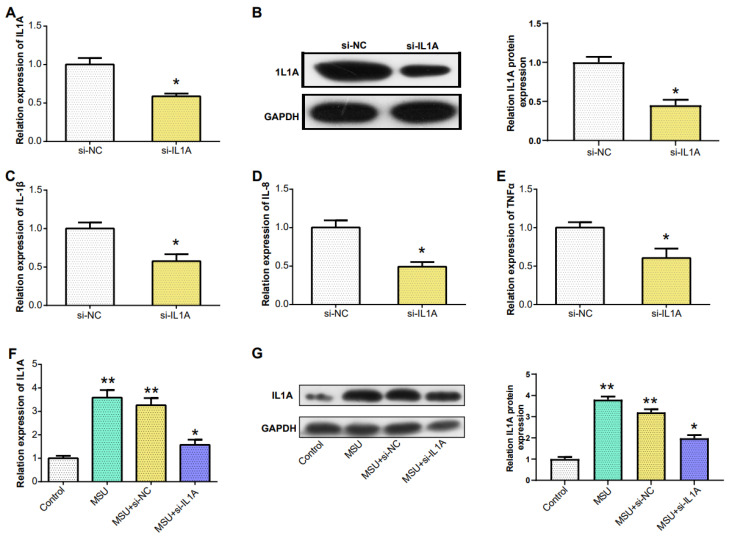
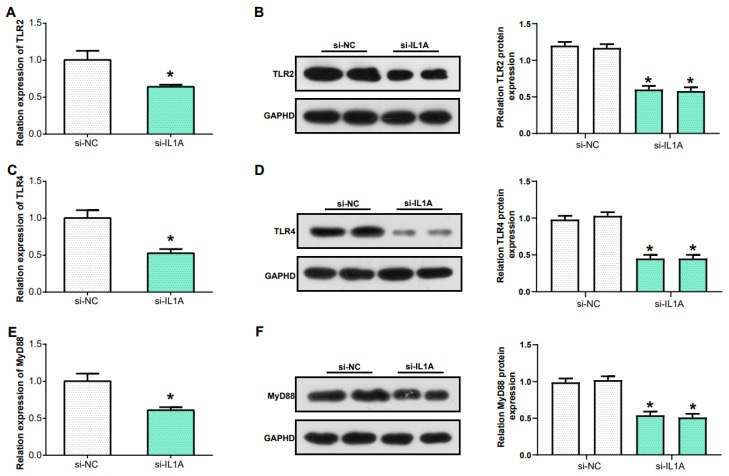
Objective: Gout is a dangerous metabolic condition related to monosodium urate (MSU). Our aim is to study the molecular mechanisms underlying gout and to identify potential clinical biomarkers by bioinformatics analysis and experimental validation. Methods: In this study, we retrieved the overlapping genes between GSE199950-Differential Expressed Genes (DEGs) dataset and key module in Weighted Gene Co-Expression Network Analysis (WGCNA) on GSE199950. These genes were then analyzed by protein-protein interaction (PPI) network, expression and Gene Set Enrichment Analysis to identify the hub gene related to gout. Then, the gene was investigated by peripheral blood mononuclear cells (PBMCs), immunoassay and cell experiments like western blotting to uncover its underlying mechanism in gout cells. Results: From the turquoise module and 83 DEGs, we identified 62 overlapping genes, only 11 genes had mutual interactions in PPI network and these genes were highly expressed in MSU-treated samples. Then, it was found that the IL1A (interleukin 1 alpha) was the only one gene related to Toll-like receptor signaling pathway that was associated with the occurrence of gout. Thus, IL1A was determined as the hub gene in this study. In immunoassay, IL1A was significantly positively correlated with B cells and negatively correlated with macrophages. Moreover, IL1A is highly expressed in gout patients,it has a good clinical diagnostic value. Finally, the results of in vitro experiments showed that after knocking down IL1A, the expressions of pro-inflammatory cytokines and Toll-like receptor signaling pathway-related proteins (TLR2, TLR4, MyD88) were all reduced. Conclusion: It is confirmed that IL1A is a promoting gene in gout with a good diagnostic value, and specifically it affects the inflammation in gout through Toll-like receptor pathway. Our research offers fresh perspectives on the pathophysiology of gout and valuable directions for future diagnosis and treatment.
Keywords: GSE199950; Gout; IL1A; Monosodium urate; Toll like receptor signaling pathway; WGCNA.
© The author(s).
Conflict of interest statement
Competing Interests: The authors have declared that no competing interest exists.
Figures
Similar articles
-
Genetic and Epigenetic Regulation of the Innate Immune Response to Gout.Immunol Invest. 2023 Apr;52(3):364-397. doi: 10.1080/08820139.2023.2168554. Epub 2023 Feb 6. Immunol Invest. 2023. PMID: 36745138 Review.
-
Effect of Berberine on Activation of TLR4-NFκB Signaling Pathway and NLRP3 Inflammasome in Patients with Gout.Chin J Integr Med. 2023 Jan;29(1):10-18. doi: 10.1007/s11655-022-3720-7. Epub 2022 Sep 20. Chin J Integr Med. 2023. PMID: 36125615
-
HSP60 Regulates Monosodium Urate Crystal-Induced Inflammation by Activating the TLR4-NF-κB-MyD88 Signaling Pathway and Disrupting Mitochondrial Function.Oxid Med Cell Longev. 2020 Dec 31;2020:8706898. doi: 10.1155/2020/8706898. eCollection 2020. Oxid Med Cell Longev. 2020. PMID: 33488933 Free PMC article.
-
Identification of potential biomarkers of gout through competitive endogenous RNA network analysis.Eur J Pharm Sci. 2022 Jun 1;173:106180. doi: 10.1016/j.ejps.2022.106180. Epub 2022 Apr 1. Eur J Pharm Sci. 2022. PMID: 35378210
-
Recent advances in crystal-induced acute inflammation.Curr Opin Rheumatol. 2007 Mar;19(2):146-50. doi: 10.1097/BOR.0b013e328014529a. Curr Opin Rheumatol. 2007. PMID: 17278929 Review.
Cited by
-
IL1A regulates MSU-induced apoptosis and inflammatory response through TLR4/MyD88/NF-κB signaling pathway.Int J Med Sci. 2025 Jun 23;22(12):3070-3083. doi: 10.7150/ijms.112102. eCollection 2025. Int J Med Sci. 2025. PMID: 40657393 Free PMC article.
-
Modulation of IRAK4 as a Therapeutic Strategy Against Monosodium Urate- and Xanthine-Induced Inflammation in Macrophages and HepG2 Cells.Res Sq [Preprint]. 2025 Jul 16:rs.3.rs-6908346. doi: 10.21203/rs.3.rs-6908346/v1. Res Sq. 2025. PMID: 40709261 Free PMC article. Preprint.
-
Clinical observations on arthroscopic removal of urate deposits in the knee: a seven-case series.Eur J Orthop Surg Traumatol. 2025 Jun 23;35(1):268. doi: 10.1007/s00590-025-04399-x. Eur J Orthop Surg Traumatol. 2025. PMID: 40549027
References
-
- Schreiner O, Wandel E, Himmelsbach F, Galle PR, Märker-Hermann E. Reduced secretion of proinflammatory cytokines of monosodium urate crystal-stimulated monocytes in chronic renal failure: an explanation for infrequent gout episodes in chronic renal failure patients? Nephrology Dialysis Transplantation. 2000;15(5):644–9. - PubMed
MeSH terms
Substances
LinkOut - more resources
Full Text Sources
Medical
