

Grazing exclusion alters soil methane flux and methanotrophic and methanogenic communities in alpine meadows on the Qinghai-Tibet Plateau
- PMID: 38164400
- PMCID: PMC10757936
- DOI: 10.3389/fmicb.2023.1293720
Grazing exclusion alters soil methane flux and methanotrophic and methanogenic communities in alpine meadows on the Qinghai-Tibet Plateau
Abstract
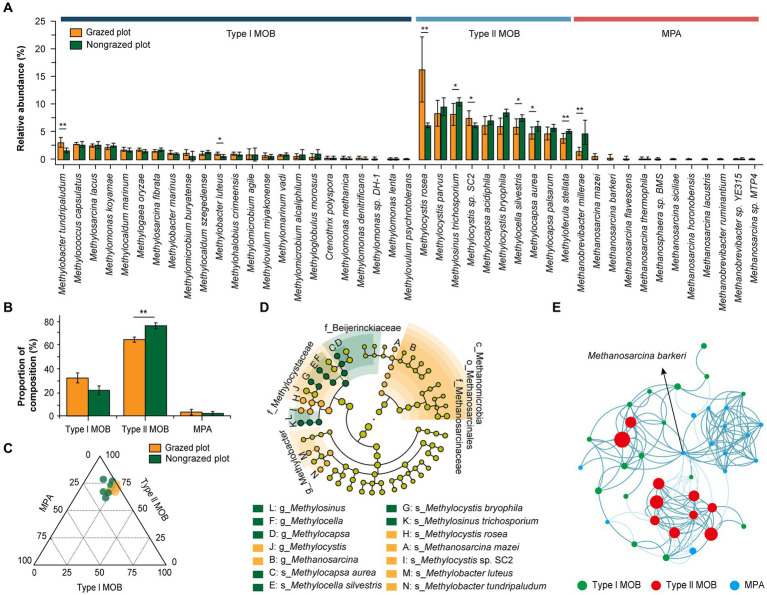
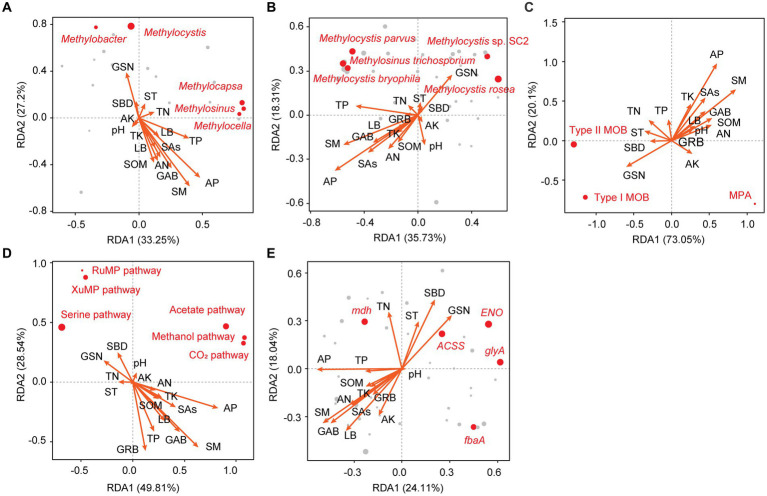
Grazing exclusion (GE) is an effective measure for restoring degraded grassland ecosystems. However, the effect of GE on methane (CH4) uptake and production remains unclear in dominant bacterial taxa, main metabolic pathways, and drivers of these pathways. This study aimed to determine CH4 flux in alpine meadow soil using the chamber method. The in situ composition of soil aerobic CH4-oxidizing bacteria (MOB) and CH4-producing archaea (MPA) as well as the relative abundance of their functional genes were analyzed in grazed and nongrazed (6 years) alpine meadows using metagenomic methods. The results revealed that CH4 fluxes in grazed and nongrazed plots were -34.10 and -22.82 μg‧m-2‧h-1, respectively. Overall, 23 and 10 species of Types I and II MOB were identified, respectively. Type II MOB comprised the dominant bacteria involved in CH4 uptake, with Methylocystis constituting the dominant taxa. With regard to MPA, 12 species were identified in grazed meadows and 3 in nongrazed meadows, with Methanobrevibacter constituting the dominant taxa. GE decreased the diversity of MPA but increased the relative abundance of dominated species Methanobrevibacter millerae from 1.47 to 4.69%. The proportions of type I MOB, type II MOB, and MPA that were considerably affected by vegetation and soil factors were 68.42, 21.05, and 10.53%, respectively. Furthermore, the structural equation models revealed that soil factors (available phosphorus, bulk density, and moisture) significantly affected CH4 flux more than vegetation factors (grass species number, grass aboveground biomass, grass root biomass, and litter biomass). CH4 flux was mainly regulated by serine and acetate pathways. The serine pathway was driven by soil factors (0.84, p < 0.001), whereas the acetate pathway was mainly driven by vegetation (-0.39, p < 0.05) and soil factors (0.25, p < 0.05). In conclusion, our findings revealed that alpine meadow soil is a CH4 sink. However, GE reduces the CH4 sink potential by altering vegetation structure and soil properties, especially soil physical properties.
Keywords: alpine meadow; grazing management; greenhouse gas; methane flux; methane sink; methane-oxidizing bacteria.
Copyright © 2023 Wang, Chen, Li, Gong, Wang and Cao.
Conflict of interest statement
The authors declare that the research was conducted in the absence of any commercial or financial relationships that could be construed as a potential conflict of interest.
Figures


Similar articles
-
Response of soil microbial compositional and functional heterogeneity to grazing exclusion in alpine shrub and meadows in the Qinghai-Tibet Plateau.Front Microbiol. 2022 Nov 30;13:1038805. doi: 10.3389/fmicb.2022.1038805. eCollection 2022. Front Microbiol. 2022. PMID: 36532507 Free PMC article.
-
[Soil CO2,CH4 and N2O Fluxes from Alpine Meadows on the Plateau of Southern Qinghai Province During Snow Cover Period and Growing Seasons].Huan Jing Ke Xue. 2016 Aug 8;37(8):2914-2923. doi: 10.13277/j.hjkx.2016.08.012. Huan Jing Ke Xue. 2016. PMID: 29964715 Chinese.
-
High Temporal and Spatial Variability of Atmospheric-Methane Oxidation in Alpine Glacier Forefield Soils.Appl Environ Microbiol. 2017 Aug 31;83(18):e01139-17. doi: 10.1128/AEM.01139-17. Print 2017 Sep 15. Appl Environ Microbiol. 2017. PMID: 28687652 Free PMC article.
-
[Vegetation and soil characteristics of degraded alpine meadows on the Qinghai-Tibet Pla-teau, China: A review].Ying Yong Sheng Tai Xue Bao. 2020 Jun;31(6):2109-2118. doi: 10.13287/j.1001-9332.202006.002. Ying Yong Sheng Tai Xue Bao. 2020. PMID: 34494765 Review. Chinese.
-
Metabolic versatility of aerobic methane-oxidizing bacteria under anoxia in aquatic ecosystems.Environ Microbiol Rep. 2024 Oct;16(5):e70002. doi: 10.1111/1758-2229.70002. Environ Microbiol Rep. 2024. PMID: 39232853 Free PMC article. Review.
Cited by
-
Biodiversity in mountain soils above the treeline.Biol Rev Camb Philos Soc. 2025 Oct;100(5):1877-1949. doi: 10.1111/brv.70028. Epub 2025 May 14. Biol Rev Camb Philos Soc. 2025. PMID: 40369817 Free PMC article. Review.
-
Ecosystem carbon storage and carbon metabolizing microorganisms in three types of grasslands on the Qinghai-Tibet Plateau.Front Microbiol. 2025 Jul 25;16:1627840. doi: 10.3389/fmicb.2025.1627840. eCollection 2025. Front Microbiol. 2025. PMID: 40785789 Free PMC article.
References
-
- Bao S. (2000). Soil Chemical Analysis of Agriculture. Beijing: Chinese Agriculture Press.
-
- Bhardwaj Y., Dubey S. K. (2020). Changes in pmoA gene containing methanotrophic population and methane oxidation potential of dry deciduous tropical forest soils. Curr. Sci. 118, 750–758. doi: 10.18520/cs/v118/i5/750-758 - DOI
LinkOut - more resources
Full Text Sources