. 2024 Jan 25;11(1):ENEURO.0074-23.2023.
doi: 10.1523/ENEURO.0074-23.2023. Print 2024 Jan.

Gordon Holmes Syndrome Model Mice Exhibit Alterations in Microglia, Age, and Sex-Specific Disruptions in Cognitive and Proprioceptive Function

Affiliations

Gordon Holmes Syndrome Model Mice Exhibit Alterations in Microglia, Age, and Sex-Specific Disruptions in Cognitive and Proprioceptive Function

Arlene J George et al. eNeuro. .

Abstract

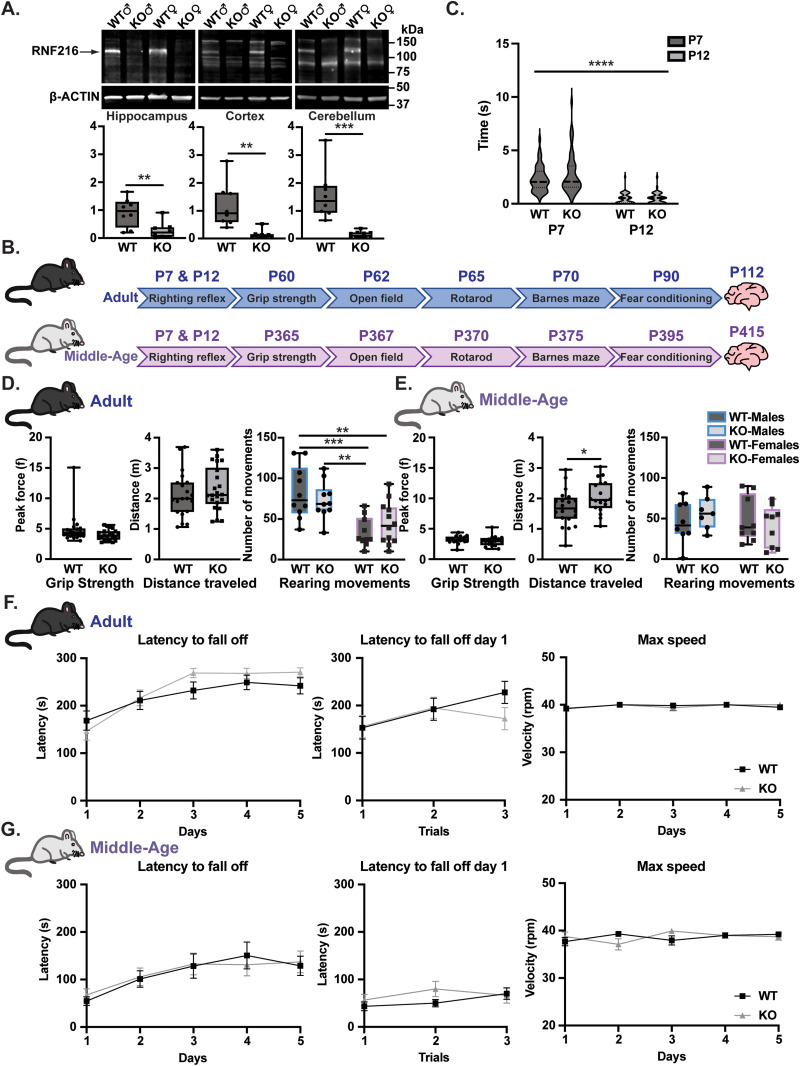
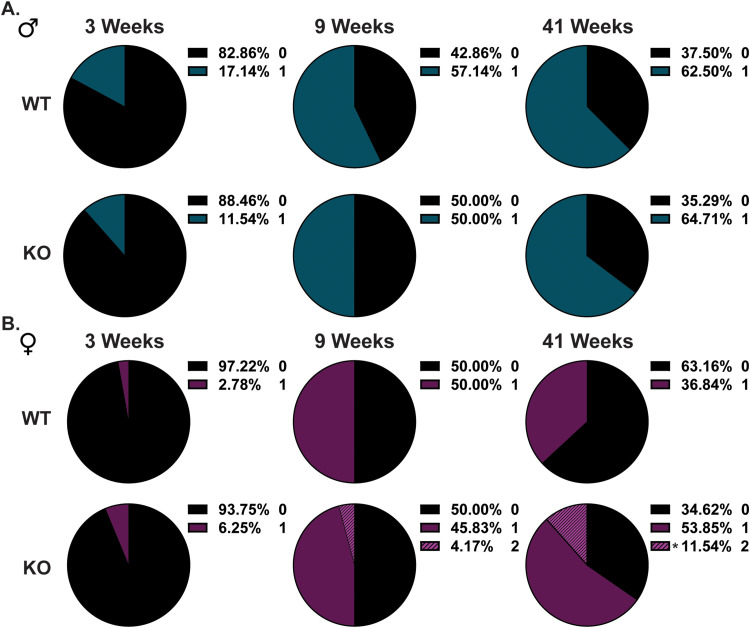
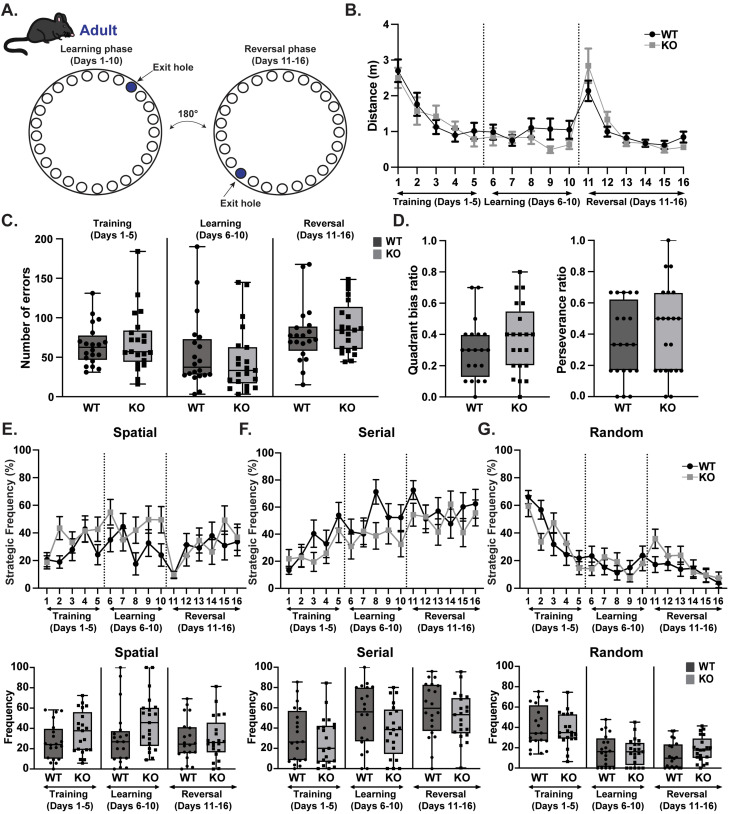
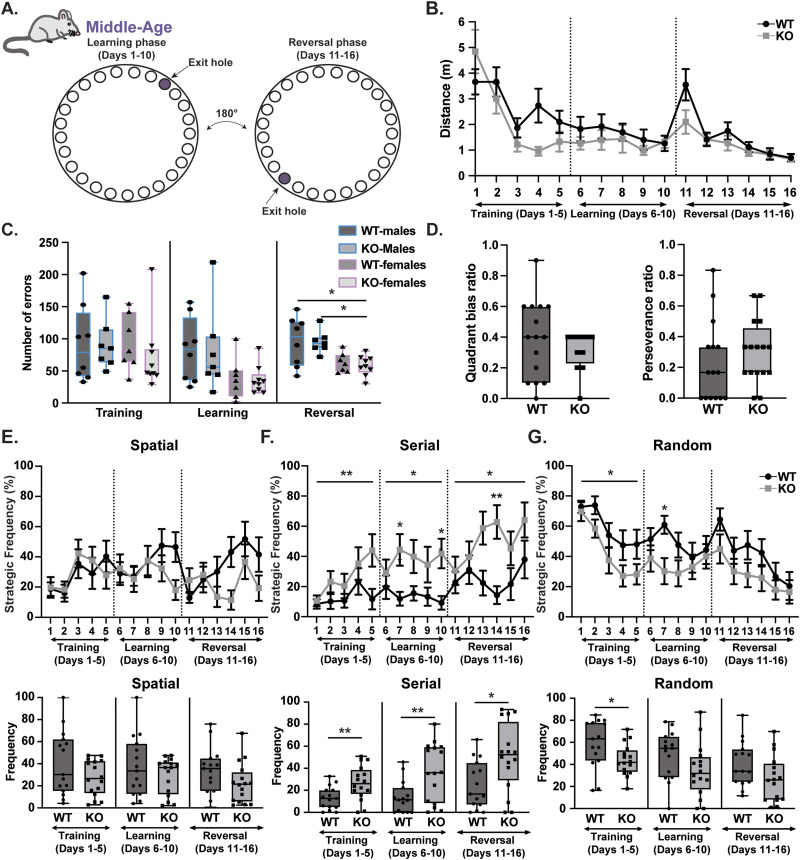
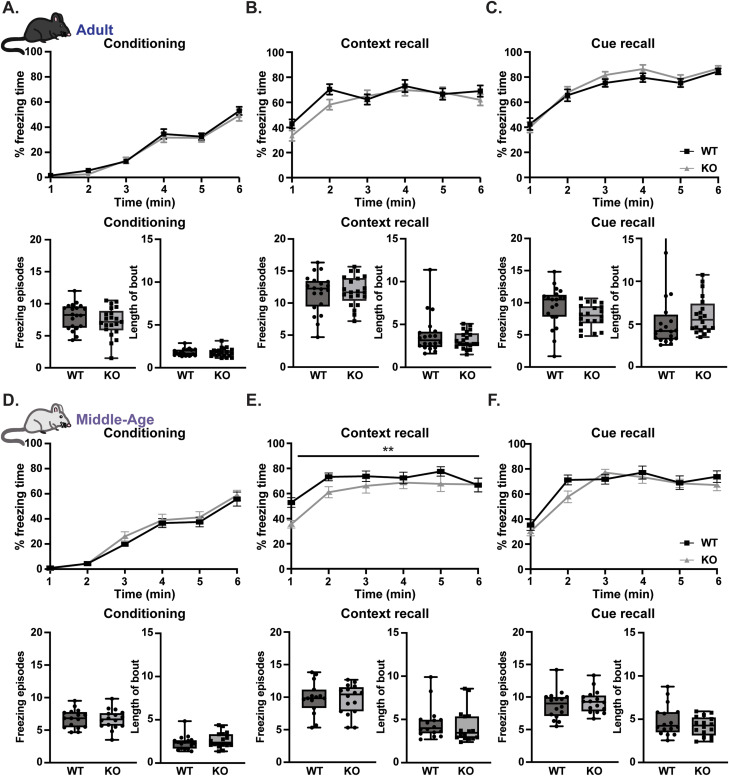
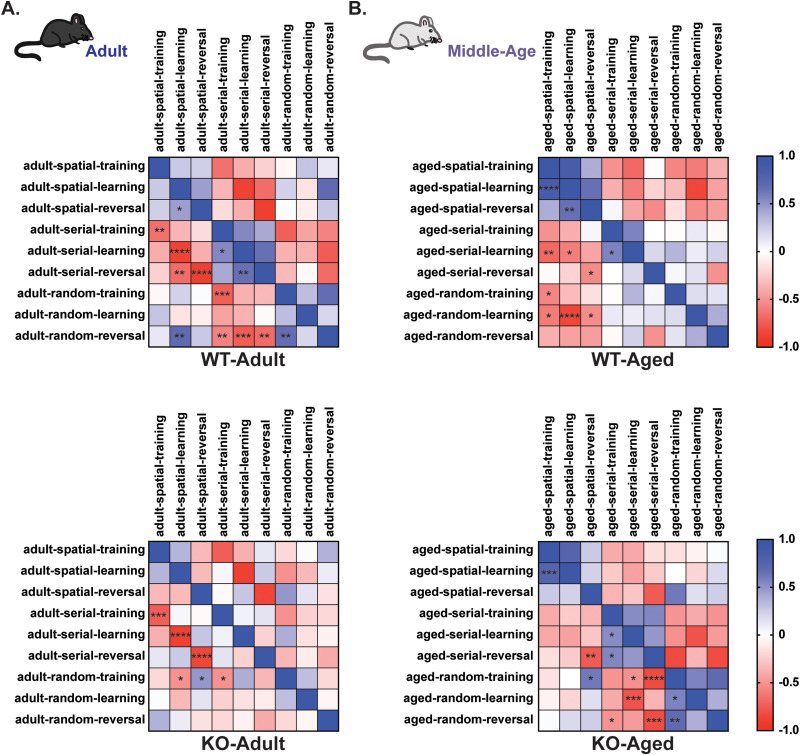
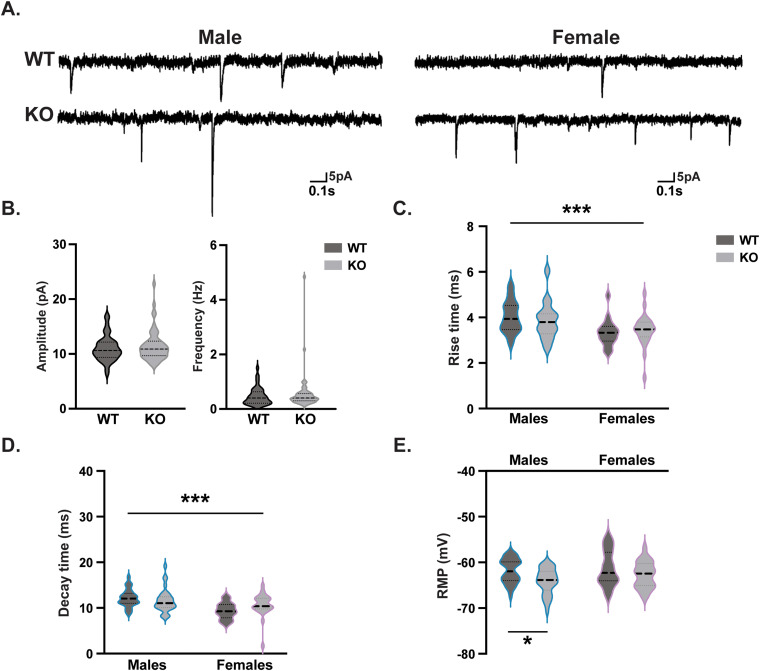
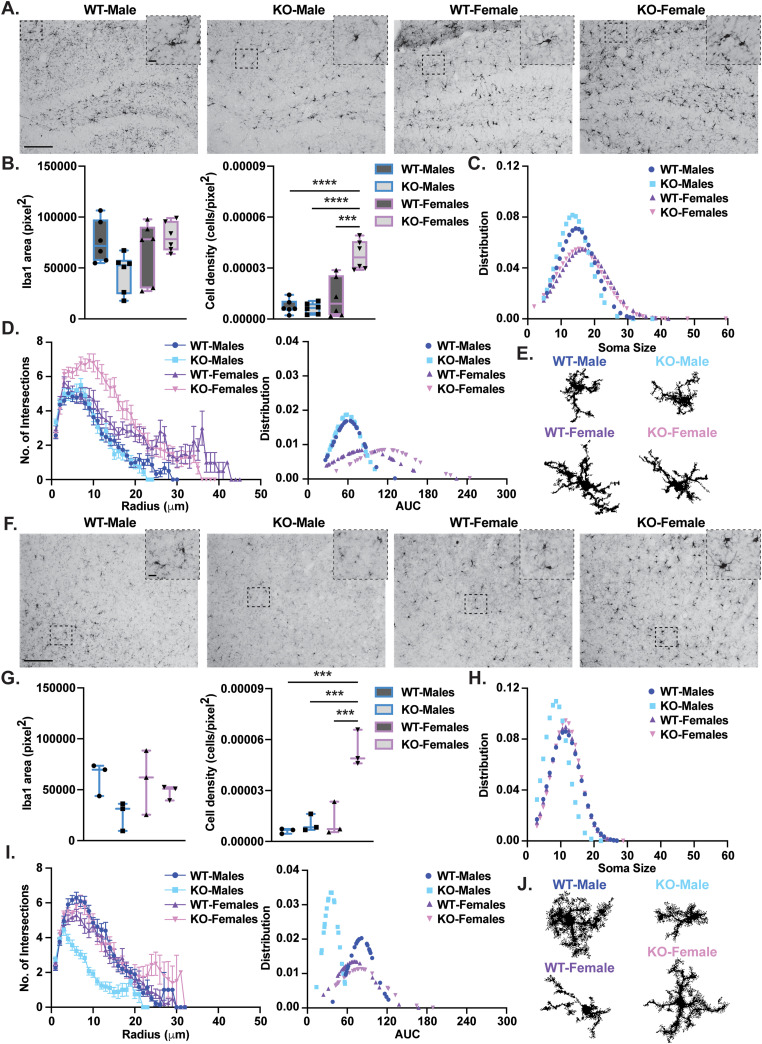
Gordon Holmes syndrome (GHS) is a neurological disorder associated with neuroendocrine, cognitive, and motor impairments with corresponding neurodegeneration. Mutations in the E3 ubiquitin ligase RNF216 are strongly linked to GHS. Previous studies show that deletion of Rnf216 in mice led to sex-specific neuroendocrine dysfunction due to disruptions in the hypothalamic-pituitary-gonadal axis. To address RNF216 action in cognitive and motor functions, we tested Rnf216 knock-out (KO) mice in a battery of motor and learning tasks for a duration of 1 year. Although male and female KO mice did not demonstrate prominent motor phenotypes, KO females displayed abnormal limb clasping. KO mice also showed age-dependent strategy and associative learning impairments with sex-dependent alterations of microglia in the hippocampus and cortex. Additionally, KO males but not females had more negative resting membrane potentials in the CA1 hippocampus without any changes in miniature excitatory postsynaptic current (mEPSC) frequencies or amplitudes. Our findings show that constitutive deletion of Rnf216 alters microglia and neuronal excitability, which may provide insights into the etiology of sex-specific impairments in GHS.

Keywords: Gordon Holmes syndrome; RNF216; ataxia; cognitive; microglia; ubiquitin.


Figures

Figure 1.
Figure 1.
Neuromuscular and motor functions are unaffected in adult and middle-aged Rnf216 KO mice. A, Top, Representative Western blots for RNF216 in male and female Rnf216+/+ (WT) and Rnf216−/− (KO) mice. Bottom, RNF216 protein levels in WT and KO mice. RNF216 values were normalized to ACTIN. For the hippocampus, t(14) = 3.583, **p = 0.0030; cortex, t(14) = 3.676, **p = 0.0025; and cerebellum, t(14) = 4.337, ***p = 0.0007. Unpaired t test. N = 4 per genotype/sex for each brain region. Data are represented as box and whisker plots. B, Behavior battery timeline for adults (P60; top) and middle-aged (P365) mice (bottom). C, No differences in righting reflex in KO mice. FTime(1,96) = 210.8, ****p < 0.0001; FGenotype(1,96) = 1.943, p = 0.1666; FTime*Genotype(1,96) = 2.261, p = 0.1359. Two-way ANOVA. N = 49 mice per genotype. Data are represented as a violin plot. D, Left, Average peak force of grip strength for adult mice. t(40) = 1.684, p = 0.0999. Middle, Total distance traveled in adult mice in an open field. t(40) = 0.7746, p = 0.4431. Unpaired t test. N = 20 for WT and N = 23 for KO. Right, Total rearing movements in adult in an open field. FSex(1,38) = 23.80, ****p < 0.0001; FGenotype(1,38) = 0.004722, p = 0.9456; FSex*Genotype(1,38) = 1.721, p = 0.1974. Post hoc: WT-Males vs WT-Females, ***p = 0.0007; WT-Males vs KO-Females, **p = 0.0067; WT-Females vs KO-Males, **p = 0.0078. Two-way ANOVA with Tukey’s multiple comparisons. N = 10–12 mice per sex/genotype. Data are represented as box and whisker plots. E, Left, Average peak force of grip strength in middle-aged mice t(31) = 0.7981, p = 0.4309. Middle, Total distance traveled in middle-aged mice in an open field. t(31) = 2.081, *p = 0.0457. Unpaired t test. N = 17 for WT and N = 16 for KO. Right, Total rearing movements in adult in an open field. FSex(1,29) = 0.5386, p = 0.4689; FGenotype(1,29) = 0.05047, *p = 0.8238; FSex*Genotype(1,29) = 1.199, p = 0.2826. Two-way ANOVA. N = 7–9 mice per genotype/sex. Data are represented as box and whisker plots. F, No genotypic differences in adult male and female KO mice in latency to fall off the rotating rod (left), latency to fall off the rotating rod for each trial on day 1 (middle), or maximum velocity (right). N = 20–22 per genotype. G, No significant differences in middle-aged male and female KO mice. N = 16–17 per genotype. Error bars measured as ±SEM in F and G.
Figure 2.
Figure 2.
Emergence of abnormal limb-clasping in Rnf216 female KO mice. A, Pie charts of limb-clasping in WT- and KO-Males. Limb-clasping was scored based on the following parameters: 0, no clasping (black); 1, forelimb clasping only (teal); 2, forelimb and hindlimb clasping. B, Pie charts of limb-clasping in WT- and KO-Females. Limb-clasping was scored based on the following parameters: 0, no clasping (black); 1, forelimb clasping only (purple); 2, forelimb and hindlimb clasping (striped purple). KO-Females began to show hindlimb clasping at 9 and 41 weeks. At 41 weeks for females, [χ2 (1, N = 45) = 4.724; *p= 0.0297; chi-square for trend]. For 3 weeks, N = 35–36 for WT and 26–32 for KO; for 9 weeks, N = 22–31 for WT and 18–24 for KO; and for 41 weeks, N = 19–24 for WT and 17–26 for KO mice per sex/genotype.
Figure 3.
Figure 3.
Lack of spatial learning deficits in adult Rnf216 KO mice. A, Schematic of Barnes maze task to evaluate spatial and reversal learning. Learning phase consisted of training (days 1–5) followed by assessments of learning (days 6–10). During the reversal phase (days 11–16), the exit hole was rotated 180°. B, Adult (∼P70) WT and KO mice show no difference in total distance traveled on the maze before finding the exit hole. C, No difference in the number of errors during the training, learning, or reversal phase. D, Left, No differences in quadrant bias ratio. Right, no difference in perseverance ratio in KO mice. E, Top, No differences in spatial strategy during each day across phases. Bottom, No differences in spatial strategy consolidated for each phase. F, Top, No differences in serial strategy during each day across phases. Bottom, No differences in serial strategy consolidated for each phase. G, Top, No differences in random strategy during each day across phases. Bottom, No differences in random strategy consolidated for each phase. N = 20 for WT and N = 21 for KO. Error bars are represented as ±SEM on top graphs in EG and as box and whisker plots on bottom graphs.
Figure 4.
Figure 4.
Altered search strategies in middle-aged Rnf216 KO mice. A, Schematic of Barnes maze task to evaluate spatial and reversal learning. Learning phase consisted of training (days 1–5) followed by assessments of learning (days 6–10). During the reversal phase (days 11–16), the exit hole was rotated 180°. B, Middle-aged (∼P375) WT and KO mice show no difference in total distance traveled on the maze before finding the exit hole. C, No genotypic differences in the number of errors in both males and females during training, learning, and reversal phase. There were sex differences during the reversal phase. KO-Males have a higher number of errors than KO-Females. FGenotype(1,27) = 0.09622, p = 0.7588; FSex(1,27) = 16.42, ***p = 0.0004; FSex*Genotype(1,27) = 0.04985, p = 0.8250. Post hoc: WT-Males vs KO-Females, *p = 0.0156; KO-Males vs KO-Females, *p = 0.0239. Two-way ANOVA with Tukey’s multiple comparisons. D, Left, No differences in quadrant bias ratio. Right, No difference in perseverance ratio. E, Top, No differences in spatial strategy during each day across phases. Bottom, No differences in spatial strategy consolidated for each phase. F, Top, Differences in serial strategy during each phase. Training: FTime(2.770,79.62) = 2.583, p = 0.0637; FGenotype(1,29) = 8.306, **p = 0.0074; FTime*Genotype(4,115) = 1.121, p = 0.3502; learning: FTime(3.436,99.63) = 0.1508, p = 0.9463; FGenotype(1,29) = 8.537, **p = 0.0067; FTime*Genotype(4,116) = 0.9341, p = 0.4468. Post hoc: day 7, *p = 0.0482; day 10, *p = 0.0309; reversal: FTime(4.011,116.3) = 1.960, p = 0.1050; FGenotype(1,29) = 6.954, *p = 0.0133; FTime*Genotype(5,145) = 1.849, p = 0.1070. Post hoc: day 14, **p = 0.0050. Two-way ANOVA with Sidak’s multiple comparisons. Bottom, differences in serial strategy consolidated for each phase. Training: t(29) = 2.838, **p = 0.0082; learning: t(29) = 2.984, **p = 0.0057; reversal: t(29) = 2.648, *p = 0.0130. Unpaired t test. G, Top, Differences in random strategy during the training phase. FTime(3.475,99.90) = 11.99, ****p < 0.0001; FGenotype(1,29) = 5.205, *p = 0.0300; FTime*Genotype(4,115) = 0.5664, p = 0.6875. Mixed-effects model. Bottom, Differences in random strategy during the consolidated training phase. t(29) = 2.252, *p = 0.0320. Unpaired t test. N = 15 for WT and N = 16 for KO.
Figure 5.
Figure 5.
Decreased context recall in middle-aged Rnf216 KO mice. A, No differences in time spent freezing during conditioning on day 1 in adult WT and KO mice or average number of freezing episodes (bottom left) or length of bout (bottom right). B, No differences in time spent freezing during context recall on day 2 in adult WT and KO mice or average number of freezing episodes (bottom left) or length of bout (bottom right). C, No differences in time spent freezing during cue recall on day 3 in adult WT and KO mice or average number of freezing episodes (bottom left) or length of bout (bottom right). N = 10–11 mice per sex/genotype. D, No differences in time spent freezing during conditioning on day 1 in aged WT and KO mice or average number of freezing episodes (bottom left) or length of bout (bottom right). E, Middle-aged KO mice spent less time freezing during context recall on day 2. FTime(4.038,121.1) = 12.15, ****p < 0.0001; FGenotype(1,30) = 5.380, *p = 0.0274; FTime*Genotype(5,150) = 1.089, p = 0.3690. Two-way ANOVA with Sidak’s multiple comparisons. There were no differences on average number of freezing episodes (bottom left) or length of bout (bottom right). F, No differences in time spent freezing during cue recall on day 3 in middle-aged WT and KO mice or average number of freezing episodes (bottom left) or length of bout (bottom right). N = 7–9 mice per genotype/sex. Top, Error bars are represented as ±SEM. Bottom, Data are represented as box and whisker plots.
Figure 6.
Figure 6.
Middle-aged Rnf216 KO mice exhibit search strategies that are more tuned to adult WT mice. A, Pearson’s correlation in adult WT (top) and KO (bottom) mice using behavioral output parameter-related strategy search in the Barnes maze. B, Pearson’s correlation in middle-aged WT (top) and KO (bottom) mice using behavioral output parameters related to open field, strategy search in the Barnes maze. *p < 0.05, **p < 0.005, ***p < 0.0005, ****p < 0.00005.
Figure 7.
Figure 7.
Decreased intrinsic excitability in the hippocampus of Rnf216 KO male mice. A, Representative miniature excitatory postsynaptic potential (mEPSP) traces from WT and KO male and female mice. There were no differences in (B) amplitude or frequency. C, Sex differences were observed in rise time. FSex(1,94) = 13.45, ***p = 0.0004; FGenotype(1,94) = 0.04758, p = 0.8278; FSex*Genotype(1,94) = 0.8068, p = 0.3714. Post hoc: WT-Males vs WT-Females, *p = 0.0181; WT-Males vs KO-Females, *p = 0.0262. Two-way ANOVA with Tukey’s multiple comparisons. D, There were sex differences in decay time. FSex(1, 94) = 15.77, ***p = 0.0001; FGenotype(1,94) = 0.4680, p = 0.4956; FSex*Genotype(1,94) = 3.839, p = 0.0530. Post hoc: WT-Males vs WT-Females, **p = 0.0011; KO-Male vs WT-Female, *p = 0.0109. Two-way ANOVA with Tukey’s multiple comparisons. E, More negative RMP in KO male mice. FSex(1, 94) = 2.363, p = 0.1276; FGenotype(1,94) = 8.877, **p = 0.0037; FSex*Genotype(1,94) = 0.4267, p = 0.5152. Post hoc: WT-Males vs KO-Males, *p = 0.0258; KO-Males vs WT-Females, *p = 0.0144. Two-way ANOVA with Tukey’s multiple comparisons. N = 4 mice per sex/genotype and n = 16 cells for WT-Females, 24 for KO-Females, 37 for WT-Males, and 43 for KO-Males.
Figure 8.
Figure 8.
Altered microglia in the hippocampus and cortex of adult Rnf216 KO mice. A, Top, Representative images of microglia stained with Iba1 in the hippocampus in adult (∼P112) WT and KO males (left) and females (right) imaged at 20× magnification. Scale bar represents 100 µm, inset represents 10 µm. B, Left, Area of Iba1. FSex(1,20) = 2.087, p = 0.1641; FGenotype(1,20) = 0.9083, p = 0.3519; FSex*Genotype(1,20) = 6.251, *p = 0.0212. Two-way ANOVA. Right, Density of Iba1-positive cells. There were significant increases in cell density but not area in KO-Females. FSex(1,20) = 33.08, ****p < 0.0001; FGenotype(1,20) = 14.13, **p = 0.0012; FSex*Genotype(1,20) = 16.69, ***p = 0.0006. Post hoc: WT-Males vs KO-Females, ****p < 0.0001; KO-Males vs Female KO, ****p < 0.0001; WT-Females vs KO-Females, ***p = 0.0001. Two-way ANOVA with Tukey’s multiple comparisons. N = 3 per sex/genotype with 1–2 sections per mouse represented in summary plots. C, Distribution of soma size in WT and KO mice. Male KO mice have smaller soma size. Welch’s t values for WT-Male vs KO-Male −0.472 (p = 0.033), WT-Male vs WT-Female −4.620 (p < 0.001), KO-Male vs KO-Female −12.116 (p < 0.001). N = 127–293 cells per genotype/sex. D, Left, Sholl analysis of reconstructed microglia measuring number of intersections in proximity to the soma. Right, AUC fittings using hierarchical bootstrapping for individual microglia. Female microglia had more intersections than male microglia. Welch’s t value for WT-Male vs WT-Female 7.071 (p < 0.001) and KO-Male vs KO-Female 6.752 (p < 0.001). N = 3 mice per genotype/sex, n = 30 reconstructed cells per group. Error bars are represented as ± SEM. E, Example 3D reconstructions of microglia from each group. F, Top, Representative images of microglia stained with Iba1 in the cortex in adult (∼P112) WT and KO males (left) and females (right) imaged at 20× magnification. Scale bar represents 100 µm, inset represents 10 µm. G, Left, Area of Iba1. FSex(1,8) = 0.6448, p = 0.4452; FGenotype(1,8) = 4.515, p = 0.0663; FSex*Genotype(1,8) = 1.305, p = 0.2863. Two-way ANOVA. Right, Density of Iba1-positive cells. There were significant increases in cell density but not area in KO females. FSex(1,8) = 29.89, ***p = 0.0006; FGenotype(1,8) = 26.11, ***p = 0.0009; FSex*Genotype(1,8) = 17.33, **p = 0.0032. Post hoc: WT-Males vs KO-Females, ***p = 0.0003; KO-Males vs KO-Females, ***p = 0.0006; WT-Females vs KO-Females, ***p = 0.0008. Two-way ANOVA with Tukey’s multiple comparisons. N = 3 per sex/genotype with 1 section per mouse represented in summary plots. H, Distribution of soma size in WT and KO mice. Male KO mice have smaller soma size. Welch’s t values for WT-Male vs KO-Male 5.663 (p < 0.001) and KO-Male vs KO-Female −7.267 (p < 0.001). N = 128–267 cells per genotype/sex. I, Left, Sholl analysis of reconstructed microglia measuring number of intersections in proximity to the soma. Right, AUC fittings using hierarchical bootstrapping for individual microglia. All groups were significantly different from one another with KO male microglia exhibiting the greatest reduction in intersection number. Welch’s t value for WT-Male vs KO-Male −4.330 (p < 0.001), WT-Female vs KO-Female 2.029 (p = 0.04), WT-Male vs WT-Female 3.267 (p = 0.002), KO-Male vs KO-Female 8.398 (p < 0.001). N = 3 mice per genotype/sex, n = 30 reconstructed cells per group. Error bars are represented as ±SEM. J, Example 3D reconstructions of microglia from each group.

Similar articles

References

    1. Alqwaifly M, Bohlega S (2016) Ataxia and hypogonadotropic hypogonadism with intrafamilial variability caused by RNF216 mutation. Neurol Int 8:6444–6444. 10.4081/ni.2016.6444 - DOI - PMC - PubMed
    1. Bordi F, LeDoux JE (1994) Response properties of single units in areas of rat auditory thalamus that project to the amygdala. II. Cells receiving convergent auditory and somatosensory inputs and cells antidromically activated by amygdala stimulation. Exp Brain Res 98:275–286. 10.1007/BF00228415 - DOI - PubMed
    1. Bordt EA, Block CL, Petrozziello T, Sadri-Vakili G, Smith CJ, Edlow AG, Bilbo SD (2020) Isolation of microglia from mouse or human tissue. STAR Protoc 1:100035. 10.1016/j.xpro.2020.100035 - DOI - PMC - PubMed
    1. Calandra CR, Mocarbel Y, Vishnopolska SA, Toneguzzo V, Oliveri J, Cazado EC, Biagioli G, Turjanksi AG, Marti M (2019) Gordon Holmes syndrome caused by RNF216 novel mutation in 2 Argentinean siblings. Mov Disord Clin Pract 6:259–262. 10.1002/mdc3.12721 - DOI - PMC - PubMed
    1. Carpenter AE, et al. (2006) CellProfiler: image analysis software for identifying and quantifying cell phenotypes. Genome Biol 7:R100–R100. 10.1186/gb-2006-7-10-r100 - DOI - PMC - PubMed

Substances

Supplementary concepts