. 2024 Jan 10;105(2):104-115.
doi: 10.1124/molpharm.123.000795.

Signaling Specificity and Kinetics of the Human Metabotropic Glutamate Receptors

Affiliations

Signaling Specificity and Kinetics of the Human Metabotropic Glutamate Receptors

Tyler W McCullock et al. Mol Pharmacol. .

Abstract

Metabotropic glutamate receptors (mGluRs) are obligate dimer G protein coupled receptors that can all function as homodimers. Here, each mGluR homodimer was examined for its G protein coupling profile using a bioluminescence resonance energy transfer-based assay that detects the interaction between a split YFP-tagged Gβ 1γ2 and a Nanoluciferase tagged free Gβγ sensor, MAS-GRK3-ct- nanoluciferase with 14 specific Gα proteins heterologously expressed, representing each family. Canonically, the group II and III mGluRs (2 and 3 and 4, 6, 7, and 8, respectively) are thought to couple to Gi/o exclusively. In addition, the group I mGluRs (1 and 5) are known to couple to the Gq/11 family and generally thought to also couple to the pertussis toxin-sensitive Gi/o family some reports have suggested Gs coupling is possible as cAMP elevations have been noted. In this study, coupling was observed with all eight mGluRs through the Gi/o proteins and only mGluR1 and mGluR5 through Gq/11, and, perhaps surprisingly, not G14 None activated any Gs protein. Interestingly, coupling was seen with the group I and II but not the group III mGluRs to G16 Slow but significant coupling to Gz was also seen with the group II receptors. SIGNIFICANCE STATEMENT: Metabotropic glutamate receptor (mGluR)-G protein coupling has not been thoroughly examined, and some controversy remains about whether some mGluRs can activate Gαs family members. Here we examine the ability of each mGluR to activate representative members of every Gα protein family. While all mGluRs can activate Gαi/o proteins, only the group I mGluRs couple to Gαq/11, and no members of the family can activate Gαs family members, including the group I receptors alone or with positive allosteric modulators.


Figures

Fig. 1.
Fig. 1.
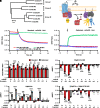
Evaluation of the mGluR-optimized protocol for all human mGluRs. (A) Dendrogram illustrating homology of all eight human mGluRs and their distribution into three groups. (B) Schematic illustrating the setup of the NanoBRET system. Panel B was made with BioRender using an institutional license to T.W.M., agreement #YO25L7S2XM. (C and D) Example protocol of cells expressing mGluR2-GoA prepared under the standard protocol (C) or mGluR optimized protocol (D) to 100 μM glutamate (green), 100 μM LY341495 (red), or the combination of the two (blue). The stimulus was delivered at time = 0 as indicated by the arrow. Summary data describing the basal BRET ratio (E), the LY341495 response (F), the glutamate response (G), and responses to Glu+LY34 (H) of all eight mGluRs in the experiments as shown in (C) and (D). Bars describe the average ± S.E.M. Statistics show the results of a two-way ANOVA with Holm-Šídák post hoc test, * P < 0.05, ** P < 0.005, *** P < 0.0005, **** P < 0.0001.
Fig. 2.
Fig. 2.
Group I mGluR signaling profiles. Signaling profiles of mGluR1 (A–C), and mGluR5 (D–F), through a panel of 14 Gα proteins in response to 1 mM glutamate. Each stimulus was delivered at time = 0. The dark solid line indicates the average response of three biologic replicates and the light shading indicates the S.E.M. for each trace. Maximum ΔBRET induced by glutamate (B and E) and initial rates (C and F) for mGluR1 and 5, respectively, are displayed as the average ± S.E.M. Raw measurements for each replicate are shown as open circles (○) in each bar graph.
Fig. 3.
Fig. 3.
Group II mGluR signaling profiles. Signaling profiles of mGluR2 (A–C), and mGluR3 (D–F), through a panel of 14 Gα proteins in response to 1 mM glutamate. Each stimulus was delivered at time = 0. The dark solid line indicates the average response of three biologic replicates and the light shading indicates the S.E.M. for each trace. Maximum ΔBRET induced by glutamate (B and E) and initial rates (C and F) for mGluR1 and 5, respectively, are displayed as the average ± S.E.M. Raw measurements for each replicate are shown as open circles (○) in each bar graph.
Fig. 4.
Fig. 4.
Group III (mGluR4 and mGluR6) signaling profiles. Signaling profiles of mGluR4 (A–C), and mGluR6 (D–F), through a panel of 14 Gα proteins in response to 1 mM glutamate. Each stimulus was delivered at time = 0. The dark solid line indicates the average response of three biologic replicates and the light shading indicates the S.E.M. for each trace. Maximum ΔBRET induced by glutamate (B and E) and initial rates (C and F) for mGluR1 and mGluR5, respectively, are displayed as the average ± S.E.M. Raw measurements for each replicate are shown as open circles (○) in each bar graph.
Fig. 5.
Fig. 5.
Group III (mGluR7 and mGlur8) signaling profiles. Signaling profiles of mGluR7 (A–C), and mGluR8 (D–F), through a panel of 14 Gα proteins in response to 1 mM glutamate. Each stimulus was delivered at time = 0. The dark solid line indicates the average response of three biologic replicates and the light shading indicates the S.E.M. for each trace. Maximum ΔBRET induced by glutamate (B and E) and initial rates (C and F) for mGluR1 and 5, respectively, are displayed as the average ± S.E.M. Raw measurements for each replicate are shown as open circles (○) in each bar graph. Gray = not determined.
Fig. 6.
Fig. 6.
Glutamate dose response curves illustrating relative efficacy and potency of responses of each mGluR through each responding G protein. (A) Glutamate dose response curves for the indicated Gα proteins when coexpressed with mGluRs1–8. Note that mGluR7 only showed responses to GoA and only at glutamate concentrations above 1 mM, so accurate efficacy and potency estimates were not possible. Heat maps are also shown, illustrating calculated EC50 values (B) and Hill coefficients (C) for the indicated mGluR homodimer with each responding Gα protein in the NanoBRET assay.
Fig. 7.
Fig. 7.
Summary of mGluR-G protein responses of all mGluR homodimers. (A) Summary of signal amplitude data displayed as raw ΔBRET according to blue intensity scale shown below for each mGluR-G protein pair. (B) Initial rate data displayed as Log10 transformed initial rates according to the color scale shown below for each mGluR-G protein pair. Heatmaps in both (A) and (B) display the average value of three biologic replicates. Data are from the same experimental replicates shown in Figs. 2–5. Gray boxes in (B) indicate “not determined.”

Update of

References

    1. Abreu N, Acosta-Ruiz A, Xiang G, Levitz J (2021) Mechanisms of differential desensitization of metabotropic glutamate receptors. Cell Rep 35:109050. - PMC - PubMed
    1. Atwood BK, Lopez J, Wager-Miller J, Mackie K, Straiker A (2011) Expression of G protein-coupled receptors and related proteins in HEK293, AtT20, BV2, and N18 cell lines as revealed by microarray analysis. BMC Genomics 12:14. - PMC - PubMed
    1. Avet C, Mancini A, Breton B, Le Gouill C, Hauser AS, Normand C, Kobayashi H, Gross F, Hogue M, Lukasheva V, et al. (2022) Effector membrane translocation biosensors reveal G protein and βarrestin coupling profiles of 100 therapeutically relevant GPCRs. eLife 11:e74101. - PMC - PubMed
    1. Avet C, Sturino C, Grastilleur S, Gouill CL, Semache M, Gross F, Gendron L, Bennani Y, Mancini JA, Sayegh CE, et al. (2020) The PAR2 inhibitor I-287 selectively targets Gαq and Gα12/13 signaling and has anti-inflammatory effects. Commun Biol 3:719. - PMC - PubMed
    1. Choi JJ, Nam KH, Min B, Kim SJ, Söll D, Kwon ST (2006) Protein trans-splicing and characterization of a split family B-type DNA polymerase from the hyperthermophilic archaeal parasite Nanoarchaeum equitans. J Mol Biol 356:1093–1106. - PubMed

LinkOut - more resources