. 2024 Jan 26;11(1):ENEURO.0371-23.2023.
doi: 10.1523/ENEURO.0371-23.2023. Print 2024 Jan.

Bilateral Retinofugal Pathfinding Impairments Limit Behavioral Compensation in Near-Congenital One-Eyed Xenopus laevis

Affiliations

Bilateral Retinofugal Pathfinding Impairments Limit Behavioral Compensation in Near-Congenital One-Eyed Xenopus laevis

Michael Forsthofer et al. eNeuro. .

Abstract

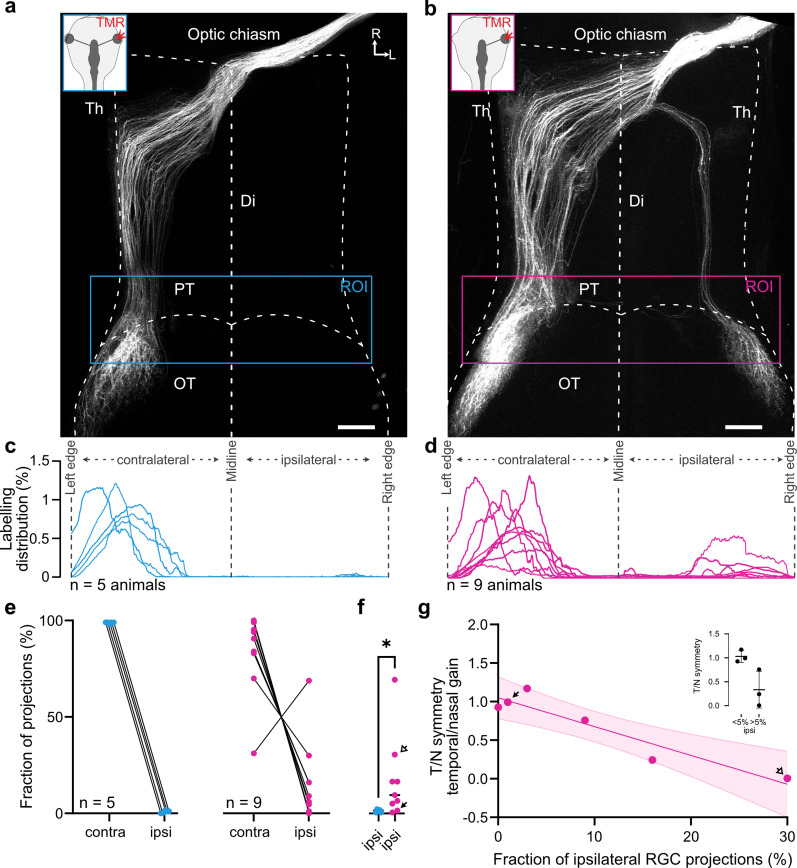
To generate a coherent visual percept, information from both eyes must be appropriately transmitted into the brain, where binocular integration forms the substrate for visuomotor behaviors. To establish the anatomical substrate for binocular integration, the presence of bilateral eyes and interaction of both optic nerves during retinotectal development play a key role. However, the extent to which embryonic monocularly derived visual circuits can convey visuomotor behaviors is unknown. In this study, we assessed the retinotectal anatomy and visuomotor performance of embryonically generated one-eyed tadpoles. In one-eyed animals, the axons of retinal ganglion cells from the singular remaining eye exhibited striking irregularities in their central projections in the brain, generating a noncanonical ipsilateral retinotectal projection. This data is indicative of impaired pathfinding abilities. We further show that these novel projections are correlated with an impairment of behavioral compensation for the loss of one eye.

Keywords: OKR; eye extirpation; frog; optokinetic reflex; plasticity; retinotectal.


Figures

Figure 1.
Figure 1.
Methodology of eye removals and behavioral tracking. a, Schematic of the experimental timeline, consisting of embryonic removal of the left optic vesicle at stages 26–28 (left, total of 83 animals, 22 successful) and behavioral tracking in a visual stimulation paradigm following maturation at stages 52–54 (right). Insets depict representative immunohistochemical staining of the eye region in a one-eyed (left) and a control (right) tadpole at stage 46, showing nerves (tubulin, green), muscles (MyoVI, red), and a nuclear counter-stain (DAPI, blue). Arrows indicate the trajectory of the oculomotor nerve. b, Representative images of 1-week-old one-eyed (top) tadpoles in comparison to controls (bottom). c, Representative traces of right eye motion in response to sinusoidal motion stimulation (top, 6,28°/s peak velocity at 0.1 Hz) or constant velocity unidirectional motion (bottom, 6.28°/s) in a single control animal. Eye motion depicted in blue, stimulus motion in black. Scale bars: a, 200 µm; b, 500 µm. II, optic nerve; III, oculomotor nerve; IV, trochlear nerve; V, trigeminal nerve; VII, facial nerve; C, caudal; cg, cement gland; D, dorsal; Le, leftward; M, medial; op, otic placode; R, rostral; Ri, rightward; V, ventral.
Figure 2.
Figure 2.
Responses of the right eye to sinusoidal motion stimulation. a, Eye motion traces (colored lines) of the right eye of binocular (n = 12), left eye lesioned (n = 12), and monocular tadpoles (n = 12) in response to sinusoidal stimulus motion (dotted lines). Thin lines represent average responses per animal (8–30 cycles per animal); thick lines in plots and in the inset represent the average response across animals. Schematics depict stimulation paradigm. b, Gain values (eye motion amplitude/stimulus amplitude) for the binocular, lesioned, and monocular paradigms. c, Average phase values of the eye following motion respective stimulus motion in degrees and seconds. Data points represent animals, with standard deviation bars outside the circle. 0° represents the peak at the leftward to rightward direction change, 180° the reverse. d, Top, Mean vectors (length, vector strength) of the data plotted in c; bottom, timing values are given in relation to the stimulus motion peak corresponding to the leftward or rightward eye motion peak. Data re-used from panel c. L, left to right peak; R, right to left peak.
Figure 3.
Figure 3.
Left–right asymmetries in binocular and monocular tadpoles. a, Conjugations of the left and right eye for leftward (blue) and rightward (red) unidirectional motion and for sinusoidal motion (black) in control animals (n = 12). A slope of 1 represents conjugate eye motion, >1 stronger motion of the left, and <1 of the right eye. Slope of leftward and rightward motion are 1.12 ± 0.005 and 0.69 ± 0.005, respectively, while sinusoidal conjugation is intermediate at 0.92 ± 0.06. b, Conjugations of the left and right eye for leftward (blue) and rightward (red) components of sinusoidal motion. Slope of leftward and rightward motion are 0.95 ± 0.01 and 0.93 ± 0.01, respectively. c, Plot taken from b on nasal and temporal gains during unidirectional stimuli of binocular and lesioned tadpoles. Added are gray dots which represent a summation of corresponding nasal and temporal values of lesioned animals (mean ± SD, 0.31 ± 0.08; p = 0.08; two-way ANOVA; Bonferroni's multiple comparison). d, Plot from c, with added gray dots which represent symmetry values of the lesioned nasal component, with the temporal component substituted with summed nasal and temporal gains calculated in panel (mean ± SD, 1.64 ± 0.54; p > 0.99; Kruskal–Wallis test with Dunn's multiple comparison). e, Correlation of nasal (red) and temporal (light blue) gains of embryonic monocular tadpoles (same individuals from Fig. 5g) with the amount of ipsilateral fraction of RGC projections. Nasal, r2 = 0.002; fit, y = −0.04y + 0.2. Temporal, r2 = 0.67; fit, y = −0.87y + 0.23.
Figure 4.
Figure 4.
Responses of the right eye to unidirectional motion stimulation. a, Motion traces (colored lines) of the right eye of binocular (n = 12), left eye lesioned (n = 11), and monocular tadpoles (n = 12) in response to unidirectional stimulus motion (dotted lines). Thin lines represent average responses per animal (1–4 stimulus bouts per direction); thick lines in plots and in the inset represent the average response across animals. b, Gain values (eye velocity/stimulus velocity) within the first 2 s of motion onset for the three paradigms. Connected dots represent nasal (N) and temporal (T) motion of the same eye. c, Symmetry indices (temporal gain/nasal gain) for the three paradigms. Values >1 indicate stronger motion toward the right and <1 motion toward the left. 1 (gray dotted line) indicates equal motion to the left and the right and a symmetric response. Arrowheads indicate low and high representative data points corresponding to anatomical values in Figure 5f and comparisons of anatomy and function in Figure 5g. d, Histograms of the distribution of symmetries in binocular and lesioned (top) versus monocular (bottom) animals. Data taken from panel c. Bin width on the x-axis is 0.25. Green shading highlights the distribution of lesioned animals for easier comparison with monocular animals.
Figure 5.
Figure 5.
RGC projections in control and one-eyed tadpoles at stages 52–54. Representative confocal z-stacks of cleared whole brains of one control (a) and monocular (b) tadpole with RGC axons labeled. White background insets indicate dye application site (colored arrowheads), and colored boxes indicate the region of interest used for quantification of projections. c, d, Histograms of the amount of above threshold labeling within ROIs in a and b across the mediolateral axis of the brain at the anterior tectum for all control (n = 5) and monocular (n = 9) preparations. e, Cumulative sum per animal of the sections of the histograms corresponding to the contralateral or ipsilateral part of the ROI in control (blue) and monocular (magenta) animals. f, Statistical comparison of the amount of ipsilateral signal in control and monocular animals. Arrows indicate data points corresponding to two representative data points for low and high ipsilateral projection values as found in panel g and Figure 4c. g, Correlation of the fraction of ipsilateral RGC projections and symmetry of OKR in animals with anatomical and behavioral data (n = 6). Negative slope indicates a negative correlation between the amount of ipsilateral RGC projections and OKR symmetry. r2 = 0.884; fit, y = −3.734y + 1.049. Inset shows comparison of symmetry values between two groups of animals, grouped based on an anatomical threshold (>5% ipsilateral projections). Th, thalamus; PT, pretectum; OT, optic tectum; Di, diencephalon; OT, optic tectum; R, rostral; L, lateral; ROI, region of interest. Scale bar, 200 µm.

Similar articles

References

    1. Bauer J, Weiler S, Fernholz MH, Laubender D, Scheuss V, Hübener M, Bonhoeffer T, Rose T (2021) Limited functional convergence of eye-specific inputs in the retinogeniculate pathway of the mouse. Neuron 109:2457–2468.e12. 10.1016/j.neuron.2021.05.036 - DOI - PubMed
    1. Beazley LD (1975) Factors determining decussation at the optic chiasma by developing retinotectal fibres in Xenopus. Exp Brain Res 23:491–504. 10.1007/BF00234917 - DOI - PubMed
    1. Blackiston DJ, Levin M (2013) Ectopic eyes outside the head in Xenopus tadpoles provide sensory data for light-mediated learning. J Exp Biol 216:1031–1040. 10.1242/jeb.074963 - DOI - PMC - PubMed
    1. Boyden ES, Katoh A, Raymond JL (2004) Cerebellum-dependent learning: the role of multiple plasticity mechanisms. Annu Rev Neurosci 27:581–609. 10.1146/annurev.neuro.27.070203.144238 - DOI - PubMed
    1. Branoner F, Straka H (2018) Semicircular canal influences on the developmental tuning of the translational vestibulo-ocular reflex. Front Neurol 9:404. 10.3389/fneur.2018.00404 - DOI - PMC - PubMed

LinkOut - more resources