. 2024 Jan 2;134(1):e173564.
doi: 10.1172/JCI173564.

Human fertilization in vivo and in vitro requires the CatSper channel to initiate sperm hyperactivation

Affiliations

Human fertilization in vivo and in vitro requires the CatSper channel to initiate sperm hyperactivation

Samuel Young et al. J Clin Invest. .

Abstract

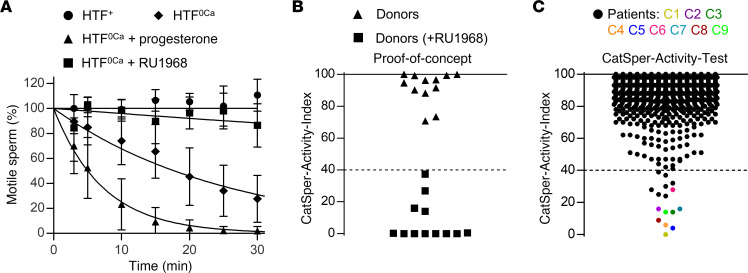
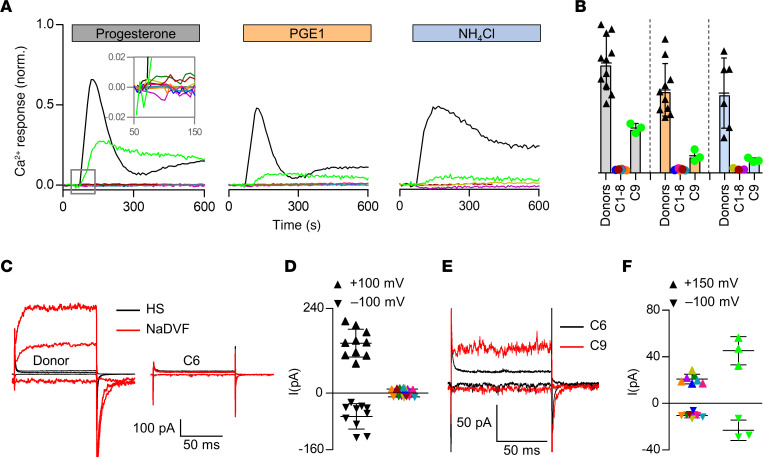
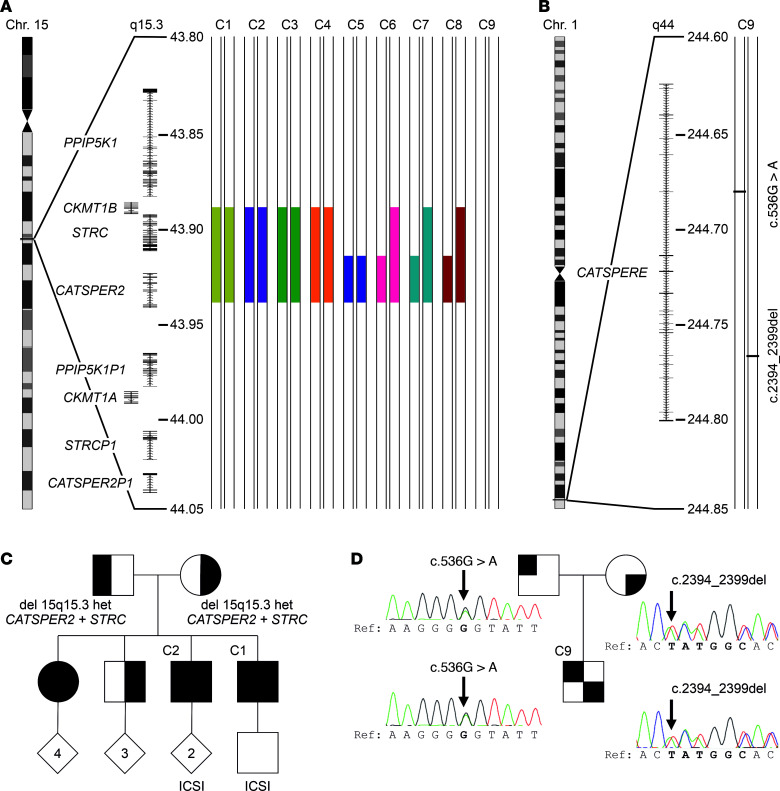
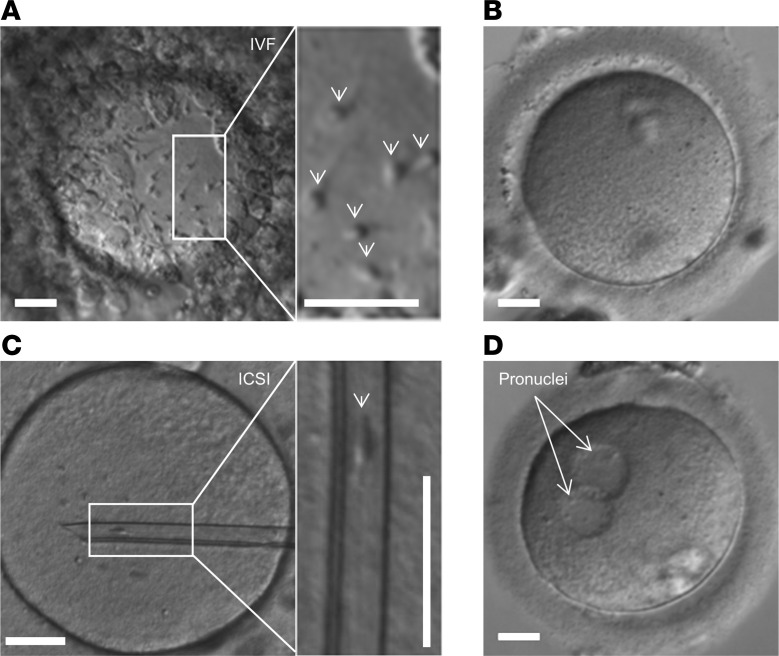
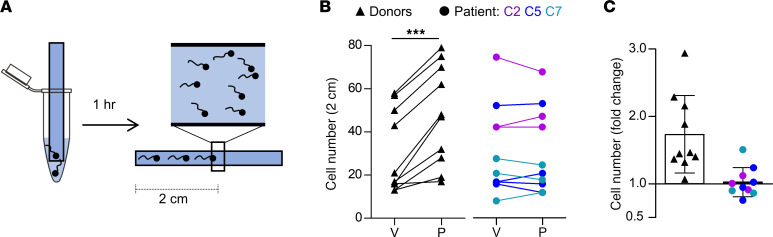
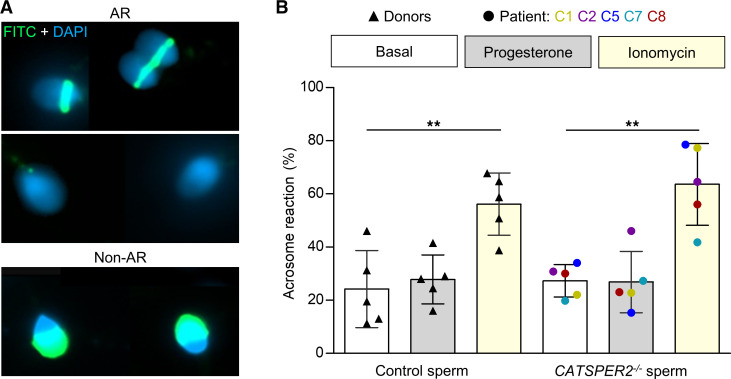
The infertility of many couples rests on an enigmatic dysfunction of the man's sperm. To gain insight into the underlying pathomechanisms, we assessed the function of the sperm-specific multisubunit CatSper-channel complex in the sperm of almost 2,300 men undergoing a fertility workup, using a simple motility-based test. We identified a group of men with normal semen parameters but defective CatSper function. These men or couples failed to conceive naturally and upon medically assisted reproduction via intrauterine insemination and in vitro fertilization. Intracytoplasmic sperm injection (ICSI) was, ultimately, required to conceive a child. We revealed that the defective CatSper function was caused by variations in CATSPER genes. Moreover, we unveiled that CatSper-deficient human sperm were unable to undergo hyperactive motility and, therefore, failed to penetrate the egg coat. Thus, our study provides the experimental evidence that sperm hyperactivation is required for human fertilization, explaining the infertility of CatSper-deficient men and the need of ICSI for medically assisted reproduction. Finally, our study also revealed that defective CatSper function and ensuing failure to hyperactivate represents the most common cause of unexplained male infertility known thus far and that this sperm channelopathy can readily be diagnosed, enabling future evidence-based treatment of affected couples.

Keywords: Calcium channels; Cell Biology; Fertility; Reproductive Biology.


Figures

Figure 1
Figure 1. Development of a motility-based test to assess the activity of CatSper in human sperm.
(A) Changes in the fraction of motile sperm (mean ± SD) upon dilution of semen samples from donors in Ca2+-free HTF (HTF0Ca) (diamonds; n = 9), HTF0Ca containing progesterone (10 μM) (triangles; n = 9), or HTF0Ca containing the CatSper-inhibitor RU1968 (15 μM) (squares; n = 6), relative to the fraction of motile sperm determined upon dilution of the respective semen sample in control HTF+ (circles, n = 9) at t = 0 (set to 100%). An exponential decay curve was fitted to the change in the fraction of motile cells averaged over all replicates. (B) CatSper-Activity-Indices (CAI) determined 15 minutes after dilution of semen samples from donors (n = 12) in HTF+ (Buffer A) and HTF0Ca containing progesterone (triangles) (Buffer B) or Buffer B also containing RU1968 (15 μM) (squares). (C) CAI values from semen samples of men undergoing semen analysis (n = 2,286); the dotted line indicates the CAI threshold, i.e., values above and below were considered indicative of normal and defective CatSper function, respectively. Patients with confirmed loss or impaired CatSper function (see Figure 2) are labeled C1–C9 and indicated with a color-coded circle.
Figure 2
Figure 2. Ca2+ signals and membrane currents in sperm from patients with impaired or loss of CatSper function.
(A) Representative Ca2+ signals in sperm from donors and patients C1–C9 (color coded) evoked by progesterone (3 μM), PGE1 (3 μM), or NH4Cl (30 mM) relative to the maximal signal amplitude evoked by ionomycin (3 μM) (set to 1). (B) Mean (± SD) maximal signal amplitude evoked by progesterone (gray; donors n = 11, C1-C8 n = 1, C9 n = 3), PGE1 (orange; donors n = 10, C1,2,4-8 n = 1, C9 n = 3), or NH4Cl (blue; donors n = 6, C1,2,8 n = 1, C9 n = 3) relative to that evoked by ionomycin (set to 1). (C) Representative whole-cell currents recorded from a sperm cell of a donor and patient C6 in extracellular solution containing Mg2+ and Ca2+ (HS) and in Na+-based divalent-free solution (NaDVF), evoked by stepping the membrane voltage to –100mV, +100 mV, and +150 mV from a holding potential of –80 mV. (D) Steady-state current amplitudes (NaDVF) at +100 mV and –100 mV in sperm from donors (black, n = 10) and patients C1–C8 (color coded, n = 1). (E) Representative whole-cell currents recorded from patients C6 (black) and C9 (red) in NaDVF, evoked by stepping the membrane voltage from to –100mV, +100 mV, and +150 mV from a holding potential of –80 mV. (F) Steady-state current amplitudes at +150 mV and –100 mV in NaDVF in sperm from patients C1–C7 and C1–C8, respectively, (color coded; n = 1) as shown in C (consider the scales of Y-axes) compared to patient C9 (light green, n = 3). Data on Ca2+ responses and membrane currents in sperm from patients C1–C5 comprise data from ref. , reporting on these patients for the first time, combined with data from additional experiments.
Figure 3
Figure 3. Genetic aberrations identified in patients with impaired or loss of CatSper function.
(A) Schematic depiction of chromosome 15, magnified region q15.3 including genes and the identified deletions (filled color-coded bars) in patients C1–C8, but not patient C9. All positions according to hg19/GRCh37. (B) Schematic depiction of chromosome 1, magnified region q44 and compound-heterozygous variants (see panel D) (c.536G>A and c.2394_2399del) of CATSPERE (NM_001130957.2) identified in patient C9. (C) Family pedigree of patients C1 and C2. Their sister is also homozygous for the deletion at 15q15.3, whereas their mother, father, and third brother are heterozygous carriers. (D) Family pedigree of patient C9, demonstrating that the father and mother are carriers of the missense variant (c.536G>A) and in-frame deletion (c.2394_2399del), respectively. Of note, in ref. , we previously showed array-CGH data from patients C1–C5, reporting on the deletion of CATSPER2 in these patients for the first time.
Figure 4
Figure 4. Microscopic documentation of medically assisted reproduction with CATSPER2–/– sperm.
(A) Representative micrograph of an oocyte with CATSPER2–/– sperm from patient C5 attached to the zona pellucida (indicated by arrows in the inset), taken after overnight incubation of sperm and oocyte for in vitro fertilization. (B) Representative image of 1 of the 5 oocytes subjected to IVF, none of which was fertilized (total fertilization failure). (C) Representative micrograph of an oocyte with an inserted glass pipette containing a CATSPER2–/– sperm cell from patient C5 (indicated in the inset) for ICSI. (D) 9 out of the 15 eggs injected with CATSPER2–/– sperm developed 2 pronuclei (representative example) indicating fertilization. Scale bars: 30 μm.
Figure 5
Figure 5. Analysis of basal motility and flagellar beat of control and CATSPER2–/– sperm.
(A) Illustration of swimming path and kinematic parameters of a sperm cell determined by CASA. Curvilinear velocity (VCL) represents the frame-to-frame track of the sperm head, from which the average-path velocity (VAP) is calculated. The beat-cross frequency (BCF) is the frequency at which the sperm track crosses the VAP path. The amplitude of lateral head displacement (ALH) is the average deviation of the head from the VAP path. The straight-line velocity (VSL) is derived by charting a direct path between the first and last head position in the image sequence. The linearity (LIN), straightness (STR), and wobble (WOB) are indicators for the linearity of the path trajectory. (B) Scatter plots (mean ± SD) of kinematic parameters of control (black triangles, n = 22) and CATSPER2–/– sperm from patients C1–C8 (color-coded circles, n = 1). (C) Scatter plots (mean ± SD) of the beat frequency of single head-tethered control sperm from donors (black triangles, n = 29 from 6 experiments) and patients with CATSPER2–/– (color-coded circles, n = 30 from 3 experiments). (D) Maximal beat amplitude (mean ± SD) along the arc length of the flagellum of the head-tethered control (black, n = 29) and CATSPER2–/– (red, n = 30) sperm analyzed in C. (E) Scatter plots (mean ± SD) of the maximal beat amplitude of the control (black triangles, n = 29) and CATSPER2–/– sperm (color-coded circles, n = 30) reported on in C and D. *P < 0.05, **P < 0.01, ***P < 0.001, unpaired t test with Welch’s correction.
Figure 6
Figure 6. Capacitation- and progesterone-induced hyperactivation of control and CATSPER2–/– sperm.
(A) Scatter plot (mean ± SD) of the fraction of hyperactivated control sperm from donors (black triangles, n = 17) and CATSPER2–/– patients (color-coded circles, n = 10 experiments with sperm from patients C1, C2, C5, C7, and C8) upon incubation under capacitating conditions. ****P < 0.0001, unpaired t test with Welch´s correction. (B) Paired plots of the fraction of hyperactivated control sperm before (basal) and after treatment (5 minutes) with progesterone (5 μM) determined by CASA (n = 5). (C) Change of the fraction (mean ± SD) of hyperactivated control (black, n = 5) and CATSPER2–/– sperm (blue, n = 3, i.e., 3 experiments with sperm from patient C5) evoked by mixing with progesterone (gray bar), corrected for the fraction of hyperactivated sperm determined after mixing with HTF++ alone (set to 0 at t = 0 seconds), and determined by a custom kinetic CASA technique. Experiments were performed with sperm incubated under capacitating conditions. **P < 0.01, ***P < 0.001, ANOVA with Dunnett’s multiple comparison test versus the respective controls (t = 0 s).
Figure 7
Figure 7. Progesterone-induced changes in flagellar beat frequency and amplitude of control and CATSPER2–/– sperm.
(A) Representative time-lapse overlays of 3 beat cycles before (Caged) and after (Uncaged) uncaging progesterone (2 μM) of a pivoting head-tethered capacitated control sperm from a donor. (B) Representative change of angle θ over time (solid line, upper panels) with the corresponding slope (dotted line) and fitted sine wave of the oscillation (lower panels) of control (black, left panel) and CATSPER2–/– sperm (gold, right panel) from patient C1 before and after uncaging progesterone. The corresponding frequency and amplitude of the flagellar beat were derived from the fitted sine wave, and the rotation velocity, Ω (°·s–1) were derived by the slope of the change of θ over time. The mean values (± SD) for 9 sperm from donors and patient C1 are provided in Supplemental Figure 8.
Figure 8
Figure 8. Progesterone-induced changes in flagellar beat asymmetry of control and CATSPER2–/– sperm.
(A) Representative overlays of a single beat cycle of a control (cyan) and a CATSPER2–/– (gold) sperm before (caged) and after uncaging (uncaged) of progesterone (2 μM). (B) AUC outlined by the beat envelope above (↑AUC) and below (↓AUC) the head-midpiece axis of a control sperm before and after uncaging progesterone used to derive an asymmetry index (see Materials). (C) Paired plot depicting the corresponding asymmetry index of the flagellar beat of the control sperm shown in A and B. (D) The asymmetry index (mean ± SD) of the basal flagellar beat of control (black, 2 donors n = 8) and CATSPER2–/– sperm (gold, patient C1 n = 8) before uncaging of progesterone. (E) The change in the asymmetry index (mean ± SD) relative to the asymmetry index immediately before (set to 0 at the mean of t = –10 seconds and 0 seconds) and after uncaging of progesterone of control (black triangles, 2 donors n = 8) and CATSPER2–/– sperm (gold circles, patient C1 n = 8). ***P < 0.001, ANOVA with Dunnett’s multiple comparison test versus the respective controls (t = 0 s).
Figure 9
Figure 9. Viscous-media penetration of control and CATSPER2–/– sperm.
(A) Experimental layout of the modified Kremer’s sperm-mucus penetration test. Glass capillaries filled with methyl cellulose solution in HTF++ fortified with either DMSO (vehicle) or progesterone (3 μM) are placed in tubes containing capacitated sperm in HTF++ fortified correspondingly with DMSO or progesterone. After 1 hour, the number of sperm reaching the 2-cm mark were counted. (B) Paired plots of the number of control (black triangles, n = 10) and CATSPER2–/– sperm (color-coded circles, n = 10) from 4 independent experiments with sperm from patients C2, C5, C7) at 2 cm in the presence of the vehicle (V) or progesterone (P). (C) Fold change in the number of control (black triangles, n =10) and CATSPER2–/– sperm (color-coded circles, n = 10) at 2 cm in the presence of progesterone, relative to the vehicle (set to 1); ***P < 0.001, paired t test.
Figure 10
Figure 10. Acrosome reaction of control and CATSPER2–/– sperm.
(A) Representative fluorescence images of capacitated nonacrosome reacted (non-AR) and acrosome reacted (AR) control sperm from donors stained with DAPI (blue) and FITC-labelled peanut agglutinin (PNA) lectin. (B) Scatter plot of the fraction (mean ± SD) of acrosome-reacted control (black triangles, n = 5) and CATSPER2–/– sperm (color coded, n = 5) after incubation in HTF++ (basal; white), progesterone (5 μM; gray), or ionomycin (5 μM; yellow). Experiments were performed with sperm incubated under capacitating conditions. **P < 0.01, ANOVA with Bonferroni’s multiple comparisons test versus the respective basal values.

Similar articles

Cited by

References

    1. Tüttelmann F, et al. Disorders of spermatogenesis: Perspectives for novel genetic diagnostics after 20 years of unchanged routine. Med Genet. 2018;30(1):12–20. doi: 10.1007/s11825-018-0181-7. - DOI - PMC - PubMed
    1. Barratt CLR, et al. Diagnostic tools in male infertility-the question of sperm dysfunction. Asian J Androl. 2011;13(1):53–58. doi: 10.1038/aja.2010.63. - DOI - PMC - PubMed
    1. Alvarez L, et al. The computational sperm cell. Trends Cell Biol. 2014;24(3):198–207. doi: 10.1016/j.tcb.2013.10.004. - DOI - PubMed
    1. Publicover SJ, et al. Ca2+ signalling in the control of motility and guidance in mammalian sperm. Front Biosci. 2008;13:5623–5637. doi: 10.2741/3105. - DOI - PubMed
    1. Ren D, et al. A sperm ion channel required for sperm motility and male fertility. Nature. 2001;413(6856):603–609. doi: 10.1038/35098027. - DOI - PMC - PubMed

Publication types

Substances