. 2024 Jan 2;134(1):e173576.
doi: 10.1172/JCI173576.

Verapamil mitigates chloride and calcium bi-channelopathy in a myotonic dystrophy mouse model

Affiliations

Verapamil mitigates chloride and calcium bi-channelopathy in a myotonic dystrophy mouse model

Lily A Cisco et al. J Clin Invest. .

Abstract

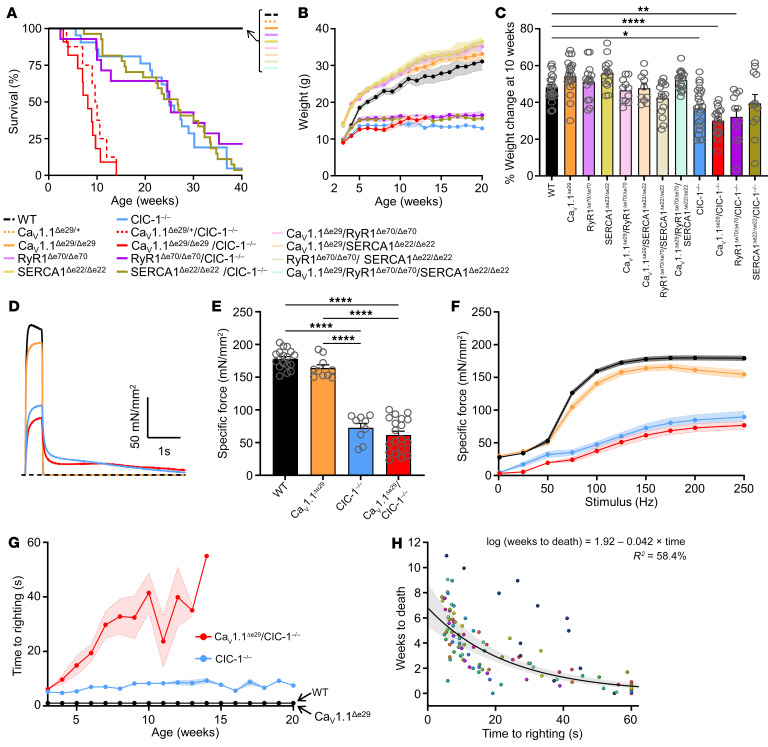
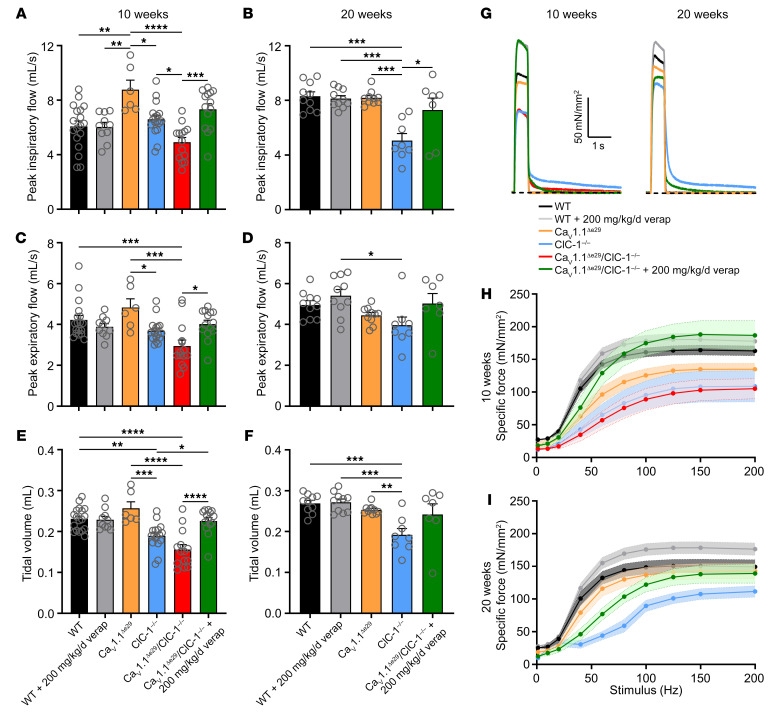
Myotonic dystrophy type 1 (DM1) involves misregulated alternative splicing for specific genes. We used exon or nucleotide deletion to mimic altered splicing of genes central to muscle excitation-contraction coupling in mice. Mice with forced skipping of exon 29 in the CaV1.1 calcium channel combined with loss of ClC-1 chloride channel function displayed markedly reduced lifespan, whereas other combinations of splicing mimics did not affect survival. The Ca2+/Cl- bi-channelopathy mice exhibited myotonia, weakness, and impairment of mobility and respiration. Chronic administration of the calcium channel blocker verapamil rescued survival and improved force generation, myotonia, and respiratory function. These results suggest that Ca2+/Cl- bi-channelopathy contributes to muscle impairment in DM1 and is potentially mitigated by common clinically available calcium channel blockers.

Keywords: Calcium channels; Chloride channels; Muscle; Muscle Biology; Therapeutics.


Conflict of interest statement

Conflict of interest: JDL, LAC, and CAT are co-inventors of the technology presented in this study. PCT/US22/79593 Claims Priority to US Provisional Patent Application nos. 63/277,816 and 63/374,378 (Treatment of myotonic disorders). Inventors: University of Rochester School of Medicine and Dentistry and JDL, LAC, and CAT (pertaining to the use of verapamil to treat myotonic disorders in this study).

Figures

Figure 1
Figure 1. CaV1.1Δe29 and ClC-1–/– alleles exhibit synthetic lethality and result in significantly reduced body weight and severe muscle weakness in mice.
(A) Kaplan-Meier survival analysis of WT (n = 10; female = 5, male = 5), CaV1.1Δe29/+ (n = 13; female = 7, male = 6), CaV1.1Δe29 (n = 15; female = 7, male = 8), RyR1Δe70/Δe70 (n = 21; female = 10, male = 11), SERCA1Δe22/Δe22 (n = 19; female = 10, male = 9), CaV1.1Δe29 RyR1Δe70/Δe70 (n = 11; female = 5, male = 6), CaV1.1Δe29 SERCA1Δe22/Δe22 (n = 10; female = 6, male = 4), RyR1Δe70/Δe70 SERCA1Δe22/Δe22 (n = 15; female = 4, male = 11), CaV1.1Δe29 RyR1Δe70/Δe70 SERCA1Δe22/Δe22 (n = 19; female = 6, male = 13), ClC-1–/– (n = 27; female = 12, male = 15), RyR1Δe70/Δe70 ClC-1–/– (n = 14; female = 7, male = 7), SERCA1Δe22/Δe22 ClC-1–/– (n = 27; female = 14, male = 13), CaV1.1Δe29/+ ClC-1–/– (n = 8; female = 3, male = 5), and CaV1.1Δe29/Δe29 ClC-1–/– (n = 11; female = 6, male = 5) mice. (B) Weekly body weight change and (C) percentage of body weight change from weaning at 10 weeks of age for WT (n = 20; female = 10, male = 10), CaV1.1Δe29 (n = 21; female = 12, male = 9), RyR1Δe70/Δe70 (n = 15; female = 5, male = 10), SERCA1Δe22/Δe22 (n = 14; female = 7, male = 7), CaV1.1Δe29 RyR1Δe70/Δe70 (n = 11; female = 5, male = 6), CaV1.1Δe29 SERCA1Δe22/Δe22 (n = 10; female = 6, male = 4), RyR1Δe70/Δe70 SERCA1Δe22/Δe22 (n = 15; female = 4, male = 11), CaV1.1Δe29 RyR1Δe70/Δe70 SERCA1Δe22/Δe22 (n = 19; female = 6, male = 13), ClC-1–/– (n = 23; female = 13, male = 10), CaV1.1Δe29 ClC-1–/– (n = 17; female = 8, male = 9), RyR1Δe70/Δe70 ClC-1–/– (n = 11; female = 5, male = 6), and SERCA1Δe22/Δe22 ClC-1–/– (n = 12; female = 8, male = 4) mice. (D) Representative traces and (E) average peak specific force elicited by 150 Hz (500 ms) tetanic stimulation of isolated EDLs from mice at 10 weeks. (F) Average frequency dependence of specific force generation elicited from isolated EDLs at 10 weeks. (E and F) WT (n = 17; female = 8, male = 9), CaV1.1Δe29 (n = 10; female = 5, male = 5), ClC-1–/– (n = 9; female = 4, male = 5), CaV1.1Δe29 ClC-1–/– (n = 19; female = 8, male = 11) mice were used. (G) Weekly TRR analysis of CaV1.1Δe29 ClC-1–/– (red), ClC-1–/– (blue), CaV1.1Δe29 (orange), WT (black) mice. (H) Correlation of the TRR to death for CaV1.1Δe29 ClC-1–/– mice. Dots represent individual mice, and duplications indicate TRR trials. In BH, results in red represent heterozygous and homozygous CaV1.1Δe29 mice that are ClC-1–/–, and results in orange indicate heterozygous and homozygous CaV1.1Δe29 alleles. Symbols and open circles indicate individual mice; bars and closed circles indicate the mean ± SEM. *P < 0.05, **P < 0.01, and ****P < 0.0001, by log-rank analysis (A); 2-way ANOVA (B, F, and G) and 1-way ANOVA (C and E) with Tukey’s post hoc analysis; and linear regression analysis (H).
Figure 2
Figure 2. Heterozygous and homozygous CaV1.1Δe29 mice exhibit similar CaV1.1 voltage dependence and peak current densities in FDB muscle.
(A) Representative current density traces from whole-cell patch clamp recordings of FDB fibers isolated from 4-week-old WT (black), CaV1.1Δe29/+ (red, dashed), and CaV1.1Δe29/Δe29 (red, solid) mice at 0 mV (top), +20 mV (middle), and +40 mV (bottom). (B) Plot of average current-voltage relationship of CaV1.1 activity measured in WT (black), CaV1.1Δe29/+ (red and black circles, red dashed), and CaV1.1Δe29/Δe29 (red circle, solid red line) FDB fibers isolated from 4-week-old mice. (C) RT-PCR products of CaV1.1 RNA isolated from tibialis anterior from 10-week-old mice. PCR amplifications are from exons 27–31 of Cacna1s cDNA. Ld, ladder. Statistical significance was determined by 1-way ANOVA with Tukey’s post hoc analysis (B).
Figure 3
Figure 3. CaV1.1Δe29 ClC-1–/– and ClC-1–/– muscle exhibits severe transient weakness that is significantly improved by the addition of verapamil.
(A and C) Normalized representative force traces of the first 15 tetani (100 Hz, 500 ms) separated by 4 seconds, recorded ex vivo from EDL muscles isolated from 6-week-old ClC-1–/– (blue) and CaV1.1Δe29 ClC-1–/– (red) mice in the (A) absence and (C) presence of 20 μM verapamil added to the bath. (B and D) Average peak tetanic EDL forces normalized to the initial stimulus, elicited by 44 subsequent 100 Hz, 500 ms tetanic stimulations separated by 4 seconds. EDL muscles were from 6-week-old WT (black, n = 4), ClC-1–/– (blue, n = 4), CaV1.1Δe29 (orange, n = 4), and CaV1.1Δe29 ClC-1–/– red, n = 4) mice in the (B) absence and (D) presence of 20 μM verapamil added to the bath for ClC-1–/– (blue, n = 4) and CaV1.1Δe29 ClC-1–/– (red, n = 4) EDLs. Dashed lines in D represent the average data presented in B as a reference for pretreatment. (B and D) WT (n = 4; female = 2, male = 2), CaV1.1Δe29 (n = 4; female = 2, male = 2), ClC-1–/– (n = 4; female = 2, male = 2), CaV1.1Δe29 ClC-1–/– (n = 4; female = 2, male = 2). Symbols and closed circles indicate the mean ± SEM. (B and D) Statistical significance was determined by 2-way ANOVA with Tukey’s post hoc analysis.
Figure 4
Figure 4. Verapamil significantly reduces myotonia in both CaV1.1Δe29 ClC-1–/– and ClC-1–/– mouse muscle.
(A and C) Representative normalized specific force traces of the first (left) and third (right) tetani (150 Hz, 500 ms) from EDL muscles isolated from 6-week-old WT (black) and CaV1.1Δe29 (orange) mice in the (A) absence and (C) presence of 20 μM verapamil added to the bath. Dashed lines represent accumulated force. (B and D) Average integration of normalized specific force for WT (black) and CaV1.1Δe29 (orange) EDL muscles across 3 tetanic stimulations (150 Hz, 500 ms) in the (B) absence and (D) presence of 20 μM verapamil added to the bath. (E and G) Representative normalized specific force traces of the first (left) and third (right) tetani (150 Hz, 500 ms) from EDL muscles isolated from 6-week-old ClC-1–/– (blue) and CaV1.1Δe29 ClC-1–/– (red) mice in the absence (E) and presence (G) of 20 μM verapamil added to the bath. Dashed lines represent accumulated force. (F and H) Average integration of specific force for ClC-1–/– (blue) and CaV1.1Δe29 ClC-1–/– (red) EDL muscles across 3 tetanic stimulations (150 Hz, 500 ms) in the (B) absence and (D) presence of 20 μM verapamil added to the bath. (B, D, F, and H) WT (n = 4; female = 2, male = 2), CaV1.1Δe29 (n = 4; female = 2, male = 2), ClC-1–/– (n = 4; female = 2, male = 2), CaV1.1Δe29 ClC-1–/– (n = 4; female = 2, male = 2). All specific force traces were normalized to the peak specific force. Symbols and open circles represent individual mice; bars indicate the mean ± SEM. Notes: Contralateral EDL muscles were used for each untreated and treated experiment. All traces were plotted with the same scale of time and normalized force for comparison. The same traces without force normalization are shown in Supplemental Figure 8. (B, D, F, and H) **P < 0.01 and ****P < 0.0001, by 1-way ANOVA with Tukey’s post hoc analysis.
Figure 5
Figure 5. Verapamil treatment improves survival, body weight, and motility of CaV1.1Δe29 ClC-1–/– mice.
(A) Kaplan-Meier survival analysis of WT mice (n = 10; female = 5, male = 5), WT mice treated with 200 mg/kg/d verapamil (verap) (n = 10; female = 5, male = 5), CaV1.1Δe29 ClC-1–/– mice (n = 19; female = 9, male = 10), and CaV1.1Δe29 ClC-1–/– mice treated with verapamil (n = 9; female = 5, male = 4). Verapamil was dosed in mouse nutrition/hydration food cups. Note: log-rank analysis of CaV1.1Δe29 ClC-1–/– versus WT mice, WT mice treated with 200 mg/kg/d verapamil, and CaV1.1Δe29 ClC-1–/– mice treated with 200 mg/kg/d verapamil; P < 0.0001, P < 0.0001, and P < 0.0001, respectively. (B) Percentage of body weight change from weaning at 10 weeks in WT mice (n = 20; female = 10, male = 10), WT mice treated with 200 mg/kg/d verapamil (n = 10; female = 5, male = 5), CaV1.1Δe29 ClC-1–/– mice (n = 35; female = 14, male = 21), and CaV1.1Δe29 ClC-1–/– mice treated with verapamil (n = 9; female = 5, male = 4). (C) Weekly time of righting reflex analysis of CaV1.1Δe29 ClC-1–/– mice (red), ClC-1–/– mice (light blue), CaV1.1Δe29 mice (orange), WT mice (black), CaV1.1Δe29 ClC-1–/– mice treated with verapamil (green), and WT mice treated with verapamil (gray). (D) Average time of righting reflex in vehicle- and verapamil-treated mice at 10 and 20 weeks of age. Note: Untreated CaV1.1Δe29 ClC-1–/– mice did not survive to 20 weeks of age, therefore the last recording before death was documented. Box indicates Q1, the median, and Q3; whiskers show the minimum and maximum. (C and D) Ten- and 20-week-old WT mice (n = 10; female = 5, male = 5), WT mice treated with 200 mg/kg/d verapamil (n = 10; female = 5, male = 5), CaV1.1Δe29 mice (n = 8; female = 4, male = 4), ClC-1–/– mice (n = 19; female = 9, male = 10), CaV1.1Δe29 ClC-1–/– mice (n = 15; female = 7, male = 8), CaV1.1Δe29 ClC-1–/– mice treated with verapamil (10-week-old mice, n = 16; female = 7, male = 9), CaV1.1Δe29 ClC-1–/– mice treated with verapamil (20-week-old mice, n = 7; female = 4, male = 3). (E) Paired before (light circles) and after (dark circles) 2 weeks of verapamil treatment of ClC-1–/– mice at 100 mg/kg/d (left; n = 5; female = 3, male = 2) and 200 mg/kg/d (right; n = 6; female = 3, male = 3) dosing in nutrition/hydration food cups. Symbols and closed circles indicate individual mice; open circles indicate the mean ± SEM. *P < 0.05, **P < 0.01, and ****P < 0.0001, by log-rank analysis (A); 1-way ANOVA (B and D) and 2-way ANOVA (C) with Tukey’s post hoc analysis; and paired t test (E).
Figure 6
Figure 6. Verapamil treatment significantly improves respiratory function and diaphragm strength in CaV1.1Δe29 ClC-1–/– mice.
WBP for (A, C, and E) 10-week-old WT mice (n = 18; female = 9, male = 9), WT mice treated with 200 mg/kg/d verapamil (n = 10; female = 5, male = 5), CaV1.1Δe29 mice (n = 6; female = 3, male = 3), ClC-1–/– mice (n = 17; female = 8, male = 9), CaV1.1Δe29 ClC-1–/– mice (n = 14; female = 7, male = 7), and CaV1.1Δe29 ClC-1–/– mice treated with verapamil (n = 14, female = 7, male = 7) and (B, D and F) 20-week-old WT mice (n = 10; female = 5, male = 5), WT mice treated with 200 mg/kg/d verapamil (n = 10; female = 5, male = 5), CaV1.1Δe29 mice (n = 10; female = 4, male = 6), ClC-1–/– mice (n = 8; female = 4, male = 4), CaV1.1Δe29 ClC-1–/– mice treated with verapamil (n = 7; female = 4, male = 3). (A and B) PIFR (mL/s) and (C and D) PEFR (mL/s) of respiration. (E and F) Tidal volume (mL) of respiration. (G) Representative tetanic (150 Hz, 500 ms) specific force traces from diaphragm strips isolated from 10-week-old (left) and 20-week-old (right) mice of the indicated genotypes and treatment groups. (H and I) Plot of the average stimulation frequency dependence of specific force generated from diaphragm strips isolated from (H) 10-week-old (n values indicate individual EDL muscles) WT mice (n = 10; female = 5, male = 5), WT mice treated with 200 mg/kg/d verapamil (n = 6; female = 3, male = 3), CaV1.1Δe29 mice (n = 5; female = 3, male = 2), ClC-1–/– mice (n = 5; female = 2, male = 3), CaV1.1Δe29 ClC-1–/– mice (n = 7; female = 4, male = 3), and CaV1.1Δe29 ClC-1–/– mice treated with verapamil (n = 7; female = 3, male = 4)) and (I) 20-week-old (n values indicate individual EDL muscles) WT mice (n = 8; female = 4, male = 4), WT mice treated with 200 mg/kg/d verapamil (n = 8; female = 4, male = 4), CaV1.1Δe29 mice (n = 7; female = 4, male = 3), ClC-1–/– mice (n = 7; female = 3, male = 4), and CaV1.1Δe29 ClC-1–/– mice treated with verapamil (n = 7; female = 4, male = 3). Symbols and open circles represent individual mice; bars and closed circles indicate the mean ± SEM. Note: Untreated CaV1.1Δe29 ClC-1–/– mice did not survive to 20 weeks of age. *P < 0.05, **P < 0.01, ***P < 0.001, and ****P < 0.0001, by 1-way ANOVA (AF) and 2-way ANOVA (H and I) with Tukey’s post hoc analysis.

Update of

Comment in

Similar articles

Cited by

References

    1. Harper PS, ed. Myotonic Dystrophy. WB Saunders Company; 2001.
    1. Mankodi A, et al. Expanded CUG repeats trigger aberrant splicing of ClC-1 chloride channel pre-mRNA and hyperexcitability of skeletal muscle in myotonic dystrophy. Mol Cell. 2002;10(1):35–44. doi: 10.1016/S1097-2765(02)00563-4. - DOI - PubMed
    1. Charlet BN, et al. Loss of the muscle-specific chloride channel in type 1 myotonic dystrophy due to misregulated alternative splicing. Mol Cell. 2002;10(1):45–53. doi: 10.1016/S1097-2765(02)00572-5. - DOI - PubMed
    1. Lueck JD, et al. Muscle chloride channel dysfunction in two mouse models of myotonic dystrophy. J Gen Physiol. 2007;129(1):79–94. doi: 10.1085/jgp.200609635. - DOI - PMC - PubMed
    1. Pang PD, et al. CRISPR -mediated expression of the fetal Scn5a Isoform in adult mice causes conduction defects and arrhythmias. J Am Heart Assoc. 2018;7(19):e010393. doi: 10.1161/JAHA.118.010393. - DOI - PMC - PubMed

Publication types