. 2024 Mar 21;52(5):2625-2647.
doi: 10.1093/nar/gkad1221.

Heterogeneous nuclear ribonucleoprotein K promotes cap-independent translation initiation of retroviral mRNAs

Affiliations

Heterogeneous nuclear ribonucleoprotein K promotes cap-independent translation initiation of retroviral mRNAs

Yazmín Fuentes et al. Nucleic Acids Res. .

Abstract

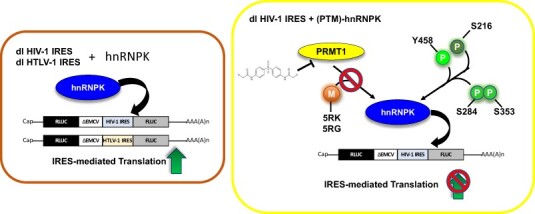
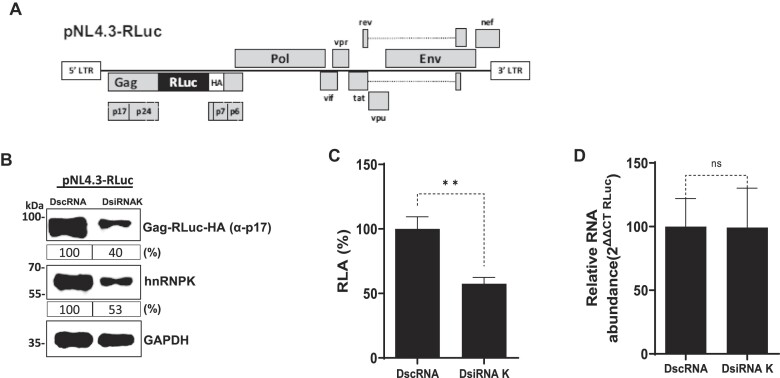
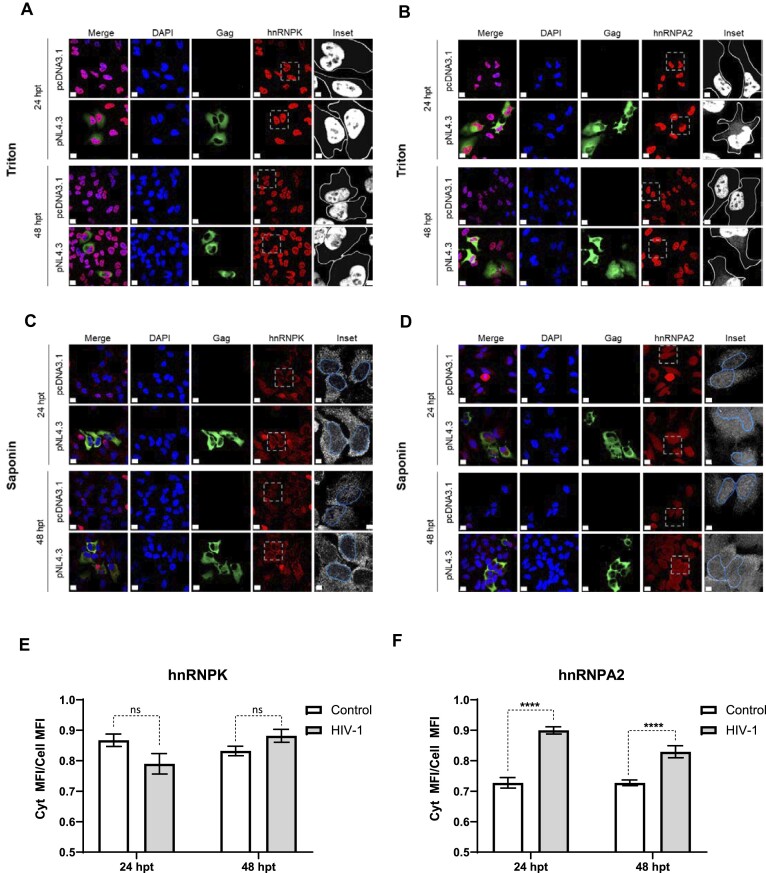
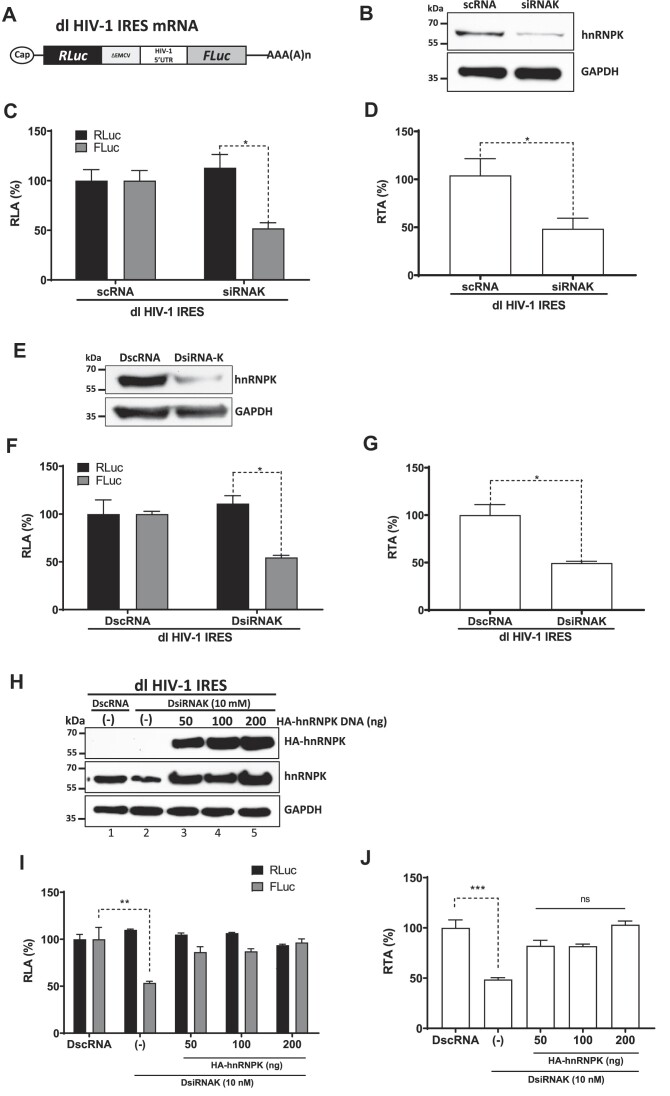
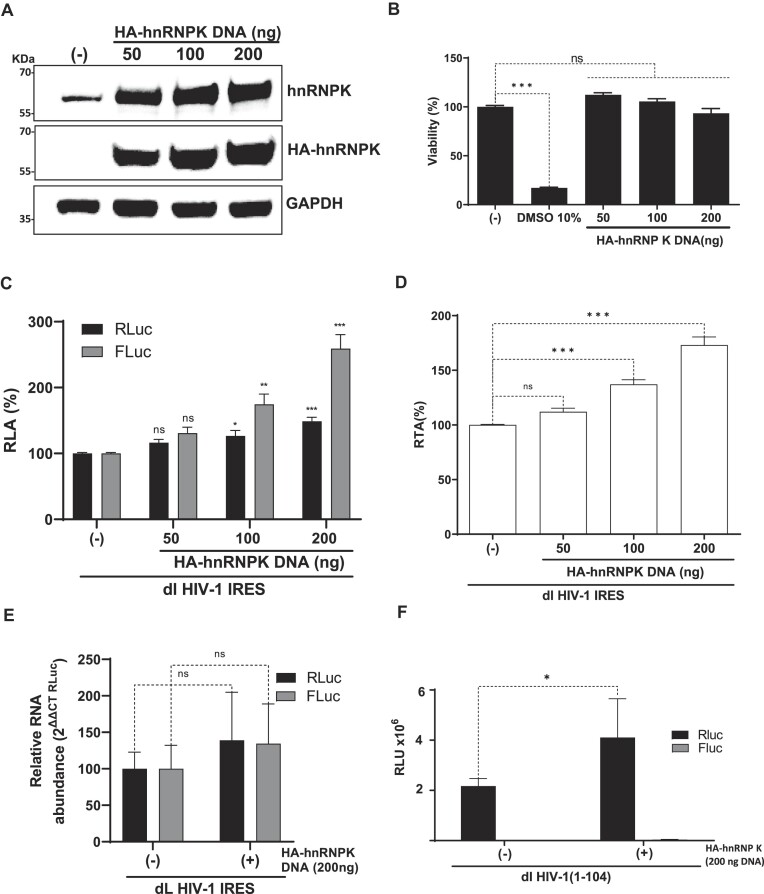
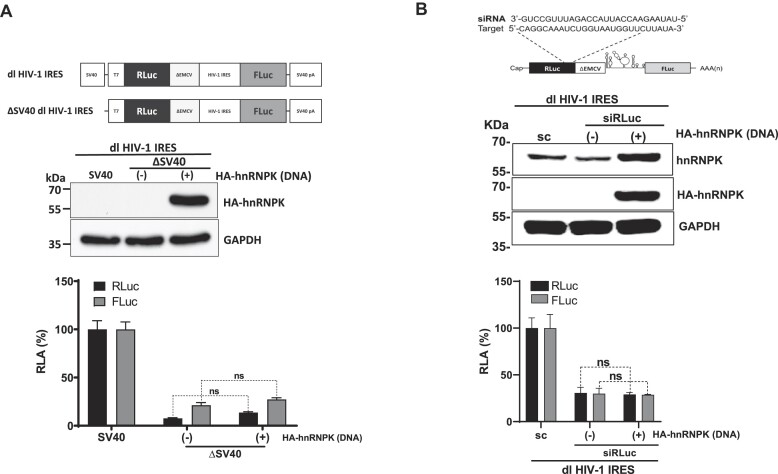
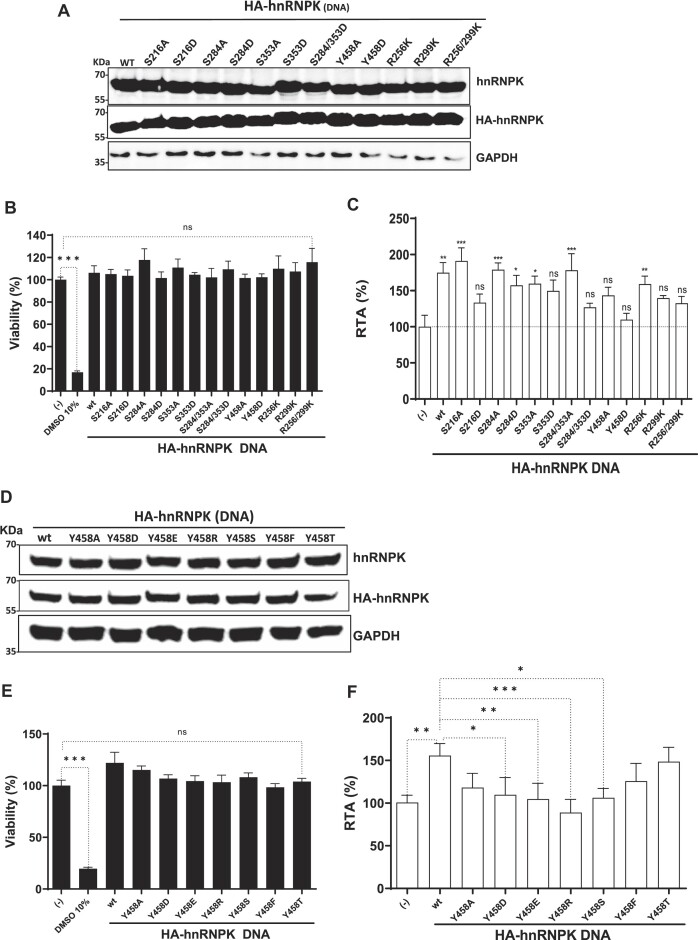
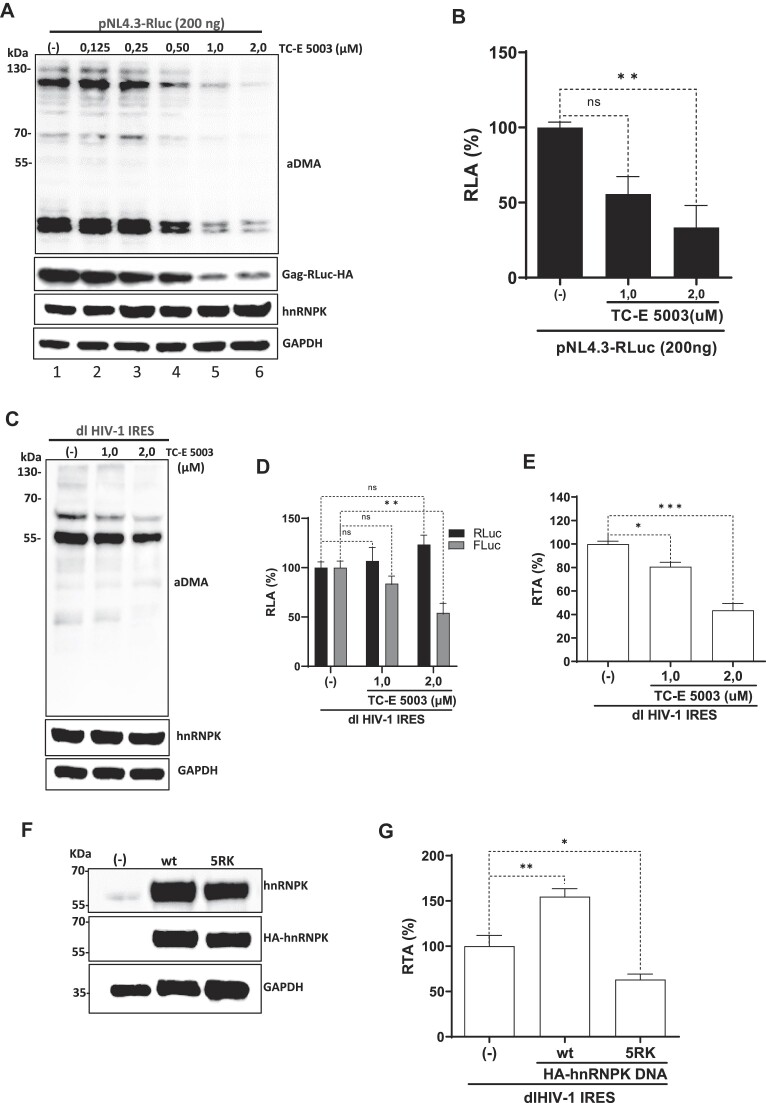
Translation initiation of the human immunodeficiency virus-type 1 (HIV-1) genomic mRNA (vRNA) is cap-dependent or mediated by an internal ribosome entry site (IRES). The HIV-1 IRES requires IRES-transacting factors (ITAFs) for function. In this study, we evaluated the role of the heterogeneous nuclear ribonucleoprotein K (hnRNPK) as a potential ITAF for the HIV-1 IRES. In HIV-1-expressing cells, the depletion of hnRNPK reduced HIV-1 vRNA translation. Furthermore, both the depletion and overexpression of hnRNPK modulated HIV-1 IRES activity. Phosphorylations and protein arginine methyltransferase 1 (PRMT1)-induced asymmetrical dimethylation (aDMA) of hnRNPK strongly impacted the protein's ability to promote the activity of the HIV-1 IRES. We also show that hnRNPK acts as an ITAF for the human T cell lymphotropic virus-type 1 (HTLV-1) IRES, present in the 5'UTR of the viral sense mRNA, but not for the IRES present in the antisense spliced transcript encoding the HTLV-1 basic leucine zipper protein (sHBZ). This study provides evidence for a novel role of the host hnRNPK as an ITAF that stimulates IRES-mediated translation initiation for the retroviruses HIV-1 and HTLV-1.


Figures

Graphical Abstract
Graphical Abstract
Figure 1.
Figure 1.
HnRNPK regulates HIV-1 Gag expression. (A) Schematic representation of the complete HIV-1 molecular clone pNL-4.3-RLuc. (B) HEK 293T cells were cotransfected with the pNL-4.3-RLuc (200 ng) plasmid and 10 nM of a DsiRNA targeting the hnRNPK mRNA (DsiRNAK) or with a scrambled RNA ((DscRNA); 10 nM) as a control. The expression of the HIV-1 Gag-RLuc-HA fusion protein and endogenous hnRNPK was determined 24 hpt by western blot using the GAPDH protein as a loading control. For the semi-quantitative comparative analysis, the captured images were quantified using the ImageJ 1.53 software (Windows version of NIH ImageJ, http://imagej.nih.gov/ij). Values expressed in percentages (%) correspond to the ratio (OD value (p17 or hnRNPK)/OD value GAPDH) relative to the control (DscRNA) set to 100%. (C) Renilla luciferase activity was measured 24 hpt and is expressed as relative luciferase activity (RLA) relative to the activity obtained when the pNL-4.3-RLuc plasmid was cotransfected with the DscRNA(−) set to 100%. (D) Cytoplasmic RNA was extracted from cells expressing pNL-4.3-RLuc HIV-1 and treated with the DscRNA or the DsiRNAK (10 nM), and relative RNA levels were determined by real-time RT-qPCR. The RNA abundance was expressed relative to the value obtained for the cells treated with the DscRNA set to 100%. In (C) and (D), values represent the mean (±SEM) from six independent experiments, with each conducted in duplicate. Statistical analyses were performed by an unpaired two-tailed t-test (ns = nonsignificant; ** P ≤ 0.01).
Figure 2.
Figure 2.
HIV-1 gene expression does not induce hnRNPK localization from the nucleus to the cytoplasm. HeLa cells were transfected with pNL4.3 or the control vector pcDNA3.1. 24- and 48-hpt, cells were fixed and permeabilized using Triton X-100 (strong detergent) (A, B) or saponin (mild detergent) (C, D). HeLa cells were stained against HIV-1 Gag (green) and hnRNPK (red) (A, C) or hnRNPA2 (red) (B, D). An overexposed closer magnification on the red channel, hnRNPK (A, C) or hnRNPA2 (B, D), is shown in the right column (Inset), where gray outlines the plasma membrane and blue the nucleus. Scale bar = 15 μm (Inset = 5 μm). (E, F) hnRNPK and hnRNPA2 were quantified in saponin-permeabilized cells by determining the mean fluorescence intensity (MFI) ratio between the cytoplasmic MFI and the overall cell MFI in the hnRNPK or hnRNPA2 channel. Individual cell values were obtained by using the cell detection function of the Imaris v10.0 software. Each bar represents the mean value (±SEM) from 20 to 30 cells per condition. Statistical analyses were performed by multiple t-tests between the control and the HIV-1 condition per group. Statistical significance was determined using the Holm–Sidak method (**** P ≤ 0.0001).
Figure 3.
Figure 3.
Reduction of endogenous hnRNPK levels in cells negatively impacts HIV-1 IRES activity. (A) Schematic representation of dl HIV-1 IRES mRNA. The capped and polyadenylated dual-luciferase (dl) bicistronic mRNA presents an upstream Renilla luciferase (RLuc) ORF and a downstream firefly luciferase (FLuc) ORF. A deleted 5′UTR of the encephalomyocarditis virus (ΔEMCV) followed by the 5′UTR (nucleotides 1-336) of the HIV-1 vRNA, NL-4.3 clone, are placed between both cistrons. (B–G) HEK293T cells were cotransfected with the dl HIV-1 IRES (200 ng) mRNA encoding plasmid, a scRNA (200 nM), or a siRNAK (B-D) targeting hnRNPK or with a DscRNA (10 nM) control or DsiRNAK (E–G). Reduction of endogenous hnRNPK was monitored by western blot using GAPDH as a loading control (B and E). RLuc and FLuc activities were measured at 24 hpt, and data are presented as RLA (C and F) or as RTA (D and G). RTA corresponds to the FLuc/RLuc ratio that is used as an index of IRES activity. The RLA and RTA values obtained in the absence of HA-hnRNPK plasmid were set to 100%. (H–J) HEK293T cells were transfected with the dl HIV-1IRES plasmid with an irrelevant control DNA (200 ng) and DsiRNAK (10 mM) alone or with increasing concentrations (50-200 ng) of a plasmid encoding for a HA-hnRNPK. The levels of endogenous and overexpressed hnRNPKs were monitored by western blot (H). RLuc and FLuc activities were measured at 24 hpt, and data are presented as RLA (I) or as RTA (J). The RLA and RTA values obtained in cells transfected with the dl HIV-1 IRES plasmid and the DscRNAK RNA were set to 100%. Values represent the mean (±SEM) from three independent experiments, with each conducted in duplicate. Statistical analysis was performed by performed for (C, D) by Student's t-test (* P< 0.05) and (F, G) and ordinary one-way ANOVA test (** P < 0.005, **** P < 0.0001; ns, not significant)
Figure 4.
Figure 4.
Overexpression of hnRNPK promotes HIV-1 IRES activity. (A-D) HEK293T cells were cotransfected with the dl HIV-1 IRES (200 ng) and different quantities (50-200 ng) of a plasmid encoding for an HA-hnRNPK protein. (A) The presence of the endogenous hnRNPK and overexpressed HA-hnRNPK proteins was confirmed by western blot using GAPDH as a loading control. (B) Cell viability was determined by measuring the cellular metabolic activity using the MTS assay using dimethylsulfoxide (DMSO, 10%) as a control for cell death. Data are expressed relative to the viability of the cells transfected with control DNA (−) set to 100%. Values shown are the mean (±SEM) from three independent experiments, with each performed in duplicate. Statistical analysis was performed by an ordinary one-way ANOVA test (*** P< 0.001). (C, D). RLuc and FLuc activities were measured at 24 hpt, and data are presented as RLA (C) or as RTA (D). The RLA and RTA values obtained in the absence of HA-hnRNPK plasmid were set to 100%. Values shown are the mean (±SEM) from four independent experiments, with each performed in duplicate. Statistical analysis was performed using ANOVA, followed by Dunnet's test (*P≤ 0.05; **P≤ 0.01; ***P≤ 0.001; ns = nonsignificant). (E) Cytoplasmic RNA was extracted from cells transfected with dlHIV-1 IRES and pCMV3-HA-hnRNPK or with the control plasmid, pSP64-polyA. The relative amount of RNA was determined by RT-qPCR assay. The relative RNA abundance was obtained by setting the value obtained from the cells transfected only with pSP64-polyA as 100% for both RLuc and FLuc. Values represent the mean (±SEM) from four independent experiments, with each performed in duplicate. Statistical analyses were performed by an unpaired two-tailed t-test (ns = nonsignificant). (F) HEK293T cells were cotransfected with the dl HIV-1 (1–104) DNA and a plasmid (200 ng) encoding for a HA-hnRNPK protein. RLuc and FLuc activities were measured 24 hpt, and data are presented as relative light units (RLU). Values shown are the mean (±SEM) from three independent experiments, with each condition performed in duplicate. Statistical analysis was performed using ANOVA, followed by Dunnet's test (*P≤ 0.05).
Figure 5.
Figure 5.
Overexpression of hnRNPK does not enhance cryptic promoter activity of the dl HIV-1 DNA or induce alternative splicing of the dl HIV-1 IRES RNA. (A) HEK 293T cells were transfected with either the dl HIV-1 IRES (150 ng) or a promoterless ΔSV40-dl HIV-1 IRES (150 ng) vector in the presence or the absence (−) of the HA-hnRNPK (100 ng) plasmid. 24 hpt total protein extracts were prepared. A schematic representation of the dl HIV-1 IRES and ΔSV40-dl HIV-1 IRES plasmids is shown (upper panel). The expression of the HA-hnRNPK recombinant protein was determined by western blot, using the GAPDH protein as a loading control (middle panel). RLuc and FLuc activities were measured, and results are expressed as RLA relative to the activities obtained from the dl HIV-1 IRES vector when in the absence of the HA-hnRNPK, set to 100% (lower panel). Values shown are the mean (±SEM) from three independent experiments, with each performed in duplicate. Statistical analysis was performed by an ordinary two-way ANOVA test (****P< 0.0001; ns, nonsignificant). (B) The dl HIV-1 IRES (200 ng) was cotransfected with a control scRNA (50 nM) or with siRLuc (50 nM), in the presence or the absence (−), of the HA-hnRNPK (200 ng) plasmid. A schematic representation of the dl reporter targeted by the siRNA RLuc (siRLuc) targeting the Renilla luciferase ORF is shown (upper panel). Total protein extracts were prepared 48 hpt. The expression of the HA-hnRNPK was determined by western blot, using the GAPDH protein as a loading control (middle panel). RLuc and FLuc activities were measured and expressed relative to the values obtained with scRNA, set to 100% (RLA) (lower panel). Values shown are the mean (±SEM) from three independent experiments, with each performed in duplicate. Statistical analysis was performed by an ordinary one-way ANOVA test (*P< 0.05; ns, nonsignificant).
Figure 6.
Figure 6.
hnRNPK post-translational modifications impact on HIV-1 IRES activity. HA-hnRNPK mutants (mut) for the phosphorylation or methylation sites were generated by site-directed mutagenesis of the HA-hnRNPK template plasmid (wt). HEK293T cells were cotransfected with the dl HIV-1 IRES (200 ng) together with each HA-hnRNPK (200 ng) plasmid (indicated in the X-axis). Total protein extracts were prepared 24 hpt. (A) Western blots were performed to detect the expression level of total hnRNPK and HA-hnRNPK proteins using GAPDH as a loading control. (B) Cell viability was determined by measuring the cellular metabolic activity using the MTS assay using dimethylsulfoxide (DMSO, 10%) as a control for cell death. Data are expressed relative to the viability of the cells transfected with control DNA (−) set to 100%. Values shown are the mean (±SEM) from three independent experiments, with each performed in duplicate. Statistical analysis was performed using ANOVA, followed by Dunnet's test (***P≤ 0.001; ns = nonsignificant). (C) RLuc and FLuc activities were measured, and results are presented as RTA, relative to the activities in the presence of the HA-hnRNPK (wt), set to 100%. Values shown are the mean (± SEM) from five independent experiments, with each performed in duplicate. Statistical analysis was performed using ANOVA, followed by Dunnet's test (*P≤ 0.05; **P≤ 0.01; ***P≤ 0.001; ns, nonsignificant). (D–F) HEK293T cells were cotransfected with dl HIV-1 -IRES plasmid (200 ng) and a plasmid expressing HA-hnRNPK(wt) or the Y458 mutants (200 ng). (D) Proteins were monitored by western blot analysis using GAPDH as a loading control. (E) Cell viability was determined as in (B); values are the mean (±SEM) from three independent experiments, with each performed in duplicate. Statistical analysis was performed using ANOVA, followed by Dunnet's test (***P≤ 0.001; ns = nonsignificant). (F) RLuc and FLuc activities were measured, and results are presented as RTA, relative to the activities obtained from the dl HIV-1 IRES vector transfected with the control DNA, set to 100%. The values are presented as the average (±SEM) from three independent experiments, with each performed in duplicate. Statistical analysis was performed using ANOVA, followed by Dunnet's test (ns, nonsignificant; * P≤ 0.05; ** P≤ 0.01; *** P≤ 0.001; **** P≤ 0.0001).
Figure 7.
Figure 7.
Inhibition of PRMT1 asymmetrical dimethylation impairs HIV-1 IRES activity. HEK 293T cells were cotransfected with the pNL-4.3-RLuc (200 ng) plasmid and 4 hpt treated, or not (only vehicle; (−)), with TC-E 5003 (0.125, 0.25, 0.50, 1 or 2 μM), a specific inhibitor of the PRMT1 activity. Total protein extracts were prepared 24 h post-treatment. (A) The PRMT1 activity (aDMA), and levels of the HIV-1 Gag-RLuc-HA fusion protein and endogenous hnRNPK in extracts from the untreated cell (lane 1) or from cells treated with at the different drug concentrations (0.125, 0.25, 0.50, 1 or 2 μM) were evaluated by western blot using GAPDH as a loading control. (B) RLuc activity was measured in proteins recovered from cells transfected with the pNL-4.3-RLuc plasmid and treated with 1 or 2 μM of TC-E-5003, and data are presented as RLA to the non-treated (−) cells set to 100%. Values shown are the mean (± SEM) from three independent experiments, with each performed in duplicate. Statistical analysis was performed using ANOVA, followed by Dunnet's test (** P≤ 0.01; ns, nonsignificant). (C–E) HEK293T cells were transfected with the dl HIV-1 IRES (200 ng) plasmid, and 4 hpt were treated, or not (only vehicle; (−)), with TC-E 5003 (1, or 2 μM). Total protein extracts were prepared 24 h post-treatment. (C) The PRMT1 activity (aDMA) and levels of endogenous hnRNPK in extracts from the untreated cell (lane 1) or from cells treated with 1 or 2 μM of TC-E 5003 were evaluated by western blot using GAPDH as a loading control. (D, E) RLuc and FLuc activities were measured, and data are presented as RLA (D) or RTA (E) relative to the non-treated (−) cells set to 100%. Values shown are the mean (± SEM) from six independent experiments, with each performed in duplicate. Statistical analysis was performed using ANOVA, followed by Dunnet's test (*P≤ 0.05; ** P≤ 0.01; *** P≤ 0.001; ns, nonsignificant). (FG) An HA-hnRNPK mutant, 5RK, with the five arginine residues (256, 258, 268, 296 and 299) targeted by PRMT1 substituted by lysine was generated by site-directed mutagenesis of the HA-hnRNPK(wt) template plasmid (wt). HEK293T cells were cotransfected with the dl HIV-1 IRES (200 ng) together with HA-hnRNPK(wt) (200 ng) or the 5RK (200 ng) plasmid. Total protein extracts were prepared 24 hpt. (F) Western blots were performed to detect the expression level of total hnRNPK and HA-hnRNPK proteins using GAPDH as a loading control. (G) RLuc and FLuc activities were measured, and results are presented as RTA, relative to extracts obtained from cells transfected with the dl HIV-1 IRES plasmid together with an irrelevant DNA (pSP64-poly(A)) set to 100%. Values shown are the mean (± SEM) from five independent experiments, with each performed in duplicate. Statistical analysis was performed using ANOVA, followed by Dunnet's test (* P≤ 0.05; ** P≤ 0.01; *** P≤ 0.001).
Figure 8.
Figure 8.
HnRNPK and 5RK differentially interact with other known ITAFs for the HIV-1 IRES. HEK293T cells were cotransfected with the dl HIV-1 IRES DNA and the HA-hnRNPK or the HA-5RK encoding plasmids. 48 h later, cells were lysed, and immunoprecipitation (IP) assays were performed using protein A/G agarose coated with IgG or the anti-HA antibody. The beads were washed extensively and incubated with loading buffer at 95ºC, and the supernatant from whole-cell lysate (input; In) of each sample and IP fractions (anti-IgG or anti-HA) were used for western blotting. Western blotting was performed using (A) anti-HA, anti-hnRNPA1, and anti-GAPDH antibodies, (B) anti-DDX3, anti-HA and anti-GAPDH antibodies, or (C) anti-HA, anti-HuR, and anti-GAPDH antibodies. Horseradish peroxidase (HRP)-conjugated protein A/G was used to detect the primary antibodies.
Figure 9.
Figure 9.
Reduction of endogenous hnRNPK negatively impacts HTLV-1 IRES without affecting sHBZ IRES activity. HEK 293T cells were transfected with the dl ΔEMCV, dl HTLV-1 IRES, or dl sHBZ IRES plasmids, proteins and RNAs were ultraviolet (UV) cross-linked (254 nm-irradiated with 400 mJ/cm2). Endogenous hnRNPK was immunoprecipitated (IP) from cell extracts using protein A/G-agarose (PGA)-beads loaded with an anti-hnRNPK antibody or using PGA-beads loaded with an anti-IgG antibody as a negative control. (A) The hnRNPK protein present in the input extracts and the IPs were evaluated by western blotting using an anti-HA antibody. As a loading control, GAPDH was detected using an anti-GAPDH-specific antibody. The protein A/G HRP conjugated was used as the secondary antibody. (B) The quantity of FLuc encoding RNA (FLuc) or GAPDH encoding RNA (GAPDH) covalently bound to hnRNPK was determined by an RT-qPCR assay as described in (46). RNA fold enrichment, as defined in (46), obtained in the IP from cells transfected with the dl ΔEMCV DNA, was set to 1. Values shown are the mean (± SEM) from two independent experiments, with each RT-qPCR assay performed in duplicate. Statistical analyses were performed using the ANOVA Kruskal-Wallis test (P< 0.05). (C-H) HEK293T cells were cotransfected with (C–E) the dl HTLV-1 IRES (200 ng), or (F–H) the dl sHBZ IRES (200 ng) plasmids, and a DscRNA (10 nM) control or DsiRNAK RNAs. Reduction of endogenous hnRNPK was monitored by western blot using GAPDH as a loading control (C and F). RLuc and FLuc activities were measured at 24 hpt, and data are presented as RLA (D and G) or as RTA (E and H). The RLA and RTA values obtained in the absence of when using the DscRNA were set to 100%. Values represent the mean (± SEM) from three independent experiments, with each conducted in duplicate. Statistical analysis was performed by a t-student test (ns, nonsignificant; *P < 0.05).
Figure 10.
Figure 10.
Overexpression of hnRNPK promotes the activity of the HTLV-1 IRES but not from the sHBZ IRES. HEK293T cells were cotransfected with (A–C) the dl HTLV-1 IRES (200 ng), or (D–F) or the dl sHBZ IRES (200 ng) plasmids, and the HA-hnRNPK encoding plasmid. The presence of the overexpressed HA-hnRNPK protein was confirmed by western blot using GAPDH as a loading control (A and D). RLuc and FLuc activities were measured at 24 hpt, and data are presented as RLA (B and E) or RTA (C and F). The RLA and RTA values obtained in the absence of HA-hnRNPK plasmid were set to 100%. Values represent the mean (± SEM) from three independent experiments, each conducted in duplicate. Statistical analysis was performed by ANOVA (*P< 0.05).

Similar articles

Cited by

References

    1. de Breyne S., Ohlmann T. Focus on translation initiation of the HIV-1 mRNAs. Int. J. Mol. Sci. 2018; 20:101. - PMC - PubMed
    1. Barrera A., Olguin V., Vera-Otarola J., Lopez-Lastra M. Cap-independent translation initiation of the unspliced RNA of retroviruses. Biochim. Biophys. Acta Gene Regul. Mech. 2020; 1863:194583. - PubMed
    1. Boris-Lawrie K., Singh G., Osmer P.S., Zucko D., Staller S., Heng X. Anomalous HIV-1 RNA, how Cap-methylation segregates viral transcripts by form and function. Viruses. 2022; 14:935. - PMC - PubMed
    1. Brasey A., Lopez-Lastra M., Ohlmann T., Beerens N., Berkhout B., Darlix J.L., Sonenberg N. The leader of human immunodeficiency virus type 1 genomic RNA harbors an internal ribosome entry segment that is active during the G2/M phase of the cell cycle. J. Virol. 2003; 77:3939–3949. - PMC - PubMed
    1. Buck C.B., Shen X., Egan M.A., Pierson T.C., Walker C.M., Siliciano R.F. The human immunodeficiency virus type 1 gag gene encodes an internal ribosome entry site. J. Virol. 2001; 75:181–191. - PMC - PubMed

MeSH terms

Substances