. 2024 Apr 12;52(6):3291-3309.
doi: 10.1093/nar/gkad1243.

THUMPD2 catalyzes the N2-methylation of U6 snRNA of the spliceosome catalytic center and regulates pre-mRNA splicing and retinal degeneration

Affiliations

THUMPD2 catalyzes the N2-methylation of U6 snRNA of the spliceosome catalytic center and regulates pre-mRNA splicing and retinal degeneration

Wen-Qing Yang et al. Nucleic Acids Res. .

Abstract

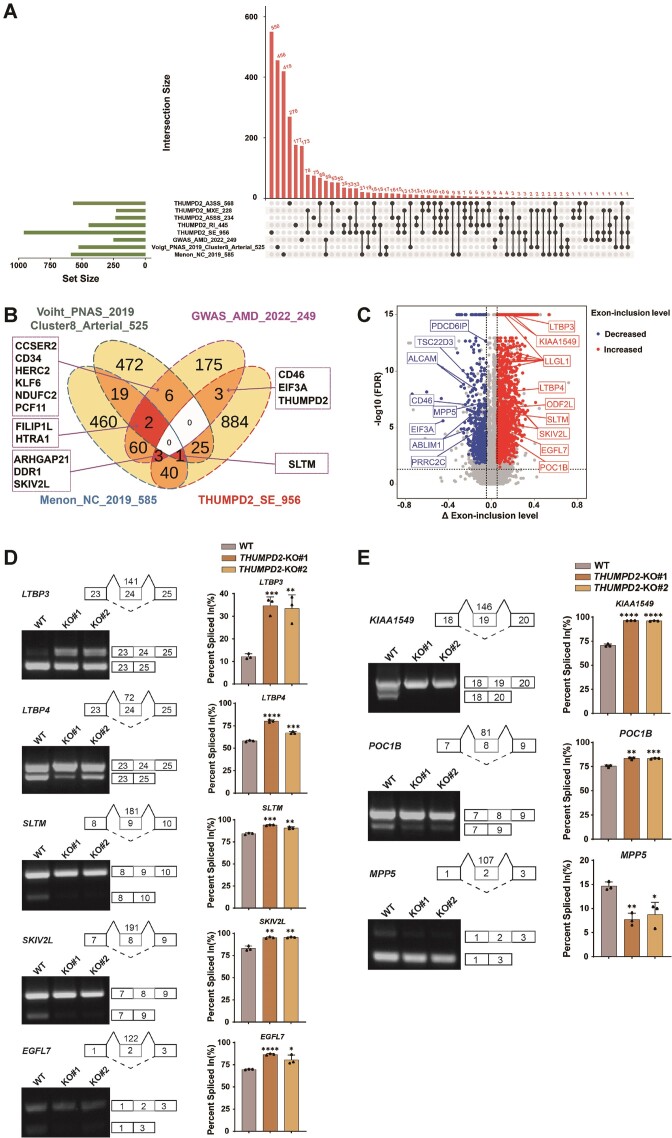
The mechanisms by which the relatively conserved spliceosome manages the enormously large number of splicing events that occur in humans (∼200 000 versus ∼300 in yeast) are poorly understood. Here, we show deposition of one RNA modification-N2-methylguanosine (m2G) on the G72 of U6 snRNA (the catalytic center of the spliceosome) promotes efficient pre-mRNA splicing activity in human cells. This modification was identified to be conserved among vertebrates. Further, THUMPD2 was demonstrated as the methyltransferase responsible for U6 m2G72 by explicitly recognizing the U6-specific sequences and structural elements. The knock-out of THUMPD2 eliminated U6 m2G72 and impaired the pre-mRNA splicing activity, resulting in thousands of changed alternative splicing events of endogenous pre-mRNAs in human cells. Notably, the aberrantly spliced pre-mRNA population elicited the nonsense-mediated mRNA decay pathway. We further show that THUMPD2 was associated with age-related macular degeneration and retinal function. Our study thus demonstrates how an RNA epigenetic modification of the major spliceosome regulates global pre-mRNA splicing and impacts physiology and disease.


Figures

Graphical Abstract
Graphical Abstract
Figure 1.
Figure 1.
The characteristics of U6 snRNA. (A) Conformational changes of U6 snRNA during the pre-mRNA splicing cycles. The secondary structure of U6 in the U6 snRNP, the assembled spliceosome and the activated spliceosome are represented (21). (B) Post-transcriptional modifications of human U6. The identified sites, chemical structure and enzymes involved are listed. (C) The two metal-ion model of the splicing reaction. G72 and other key residues in the splicing catalytic center of U6 are labeled. M1 and M2, stand for the two metal ions; pre-mRNA is on the right (25).
Figure 2.
Figure 2.
Analysis of U6 m2G72 in the model eukaryotes and identification of THUMPD2 as the catalytic methyltransferase. (A) Secondary structures of the human U6 marked with the following elements: 5′γ-monomethyl cap, 5′ stem loop (5′SL), Bulge, Internal stem loop (ISL), Telestem and 3′U-tail (32). All the identified RNA modifications are labeled. G, guanosine; m2G, N2-methylguanosine. (B) Mass chromatograms of the nucleosides, G (upper panel) and m2G (lower panel) of U6 extracted from the human HEK293T cells, brains of 11-week-old mice, tails of zebrafish and whole drosophila, respectively. U6atac snRNA extracted from HEK293T cells was also analyzed. Black asterisks indicate target peaks. The relative abundance of G was used as the control. (C) Phylogenetic analysis of the RNA m2G-associated enzymes indicated that THUMPD2 is likely to be an evolutionarily conserved, N2-methylation-related enzyme in vertebrates. aa, amino acids. (D) The evolution of THUMPD2 and m2G of U6 from yeast to humans. *m2G on U6 verified in this study. (E) RNA-fragment-MS analysis of m2G-containing fragments of U6 extracted from the WT and THUMPD2-KO HEK293T cells, digested with RNase A with (upper panels) or without (lower two panel) m2G. The fragment sequences are indicated. The m/z value and charge state of each fragment are shown on the right. Orange asterisks indicate target peaks. n.d., not detected. (F) Mass chromatograms of the nucleosides, G and m2G of the U6 extracted from the WT and THUMPD2-KO HEK293T cells. Black asterisks indicate target peaks. The relative abundance of G was used as the control. The value of the left vertical axis indicates the intensity of G, and that of the right vertical axis indicates the intensity of m2G. (G) Quantification of the nucleosides, m2G, m6A, Am, Gm, Cm and ψ levels of U6 between the WT and THUMPD2-KO HEK293T cells. Data were normalized to the relative abundance of A. Hs, Homo sapiens; Mm, Mus musculus; Dr, Danio rerio; Dm, Drosophila melanogaster; Ce, Caenorhabditis elegans; Tt, Thermus thermophilus; Pf, Pyrococcus furiosus; Mj, Methanocaldococcus jannaschii; Af, Archaeoglobus fulgidus; Sc, Saccharomyces cerevisiae; Pa, Pyrococcus abyssi; and Ec, Escherichia coli. In Figure G, statistical analysis was performed using t-tests, and the error bars indicate the mean ± SD for three independent experiments. n.d., not detected; ns, not statistically significant; P< 0.05; ∗∗∗∗P< 0.0001.
Figure 3.
Figure 3.
THUMPD2 interacts with TRMT112 to catalyze m2G72 by recognizing U6-specific sequences and structural motifs. (A) Quantifying the methylation activity of purified HsTHUMPD2, HsTRMT112 and HsTHUMPD2-TRMT112 complex on U6. Data were normalized to the relative abundance of G. (B) Domain composition of human THUMPD2 and TRMT112. HsTHUMPD2 was 503 aa long, and HsTRMT112 was 125 aa long. THUMPD2 contains two main domains: an ancient RNA-binding THUMP domain and a S-adenosylmethionine (SAM)-dependent Methyltransferase (MTase) domain. (C) The structural model of the HsTHUMPD2-TRMT112 complex was generated using a protein structure homology-modeling server combined with manual structural superimposition and docking. The model is shown as a cartoon, and the THUMP domain (slate) and MTase domain (violet) of THUMPD2 with SAM (orange) plus TRMT112 (purple) are indicated. (D) Elements of U6 that are recognized by THUMPD2-TRMT112. Diagrams of the secondary structures of the different truncated or substitutive forms of U6 are shown on the left. Mass chromatograms of the G and m2G from human U6, U6atac and U6 mutants after incubation with THUMPD2-TRMT112. (E) Mutations on the U6 ISL-apical loop. Diagrams of ISL and the sequences of the ISL-apical loop from human U6atac and U6 are shown on the left. The distinct nucleosides (G65, C66 and G67) in the ISL-apical loop of U6 were mutated to the corresponding bases of U6atac. The two identical nucleosides C68 and A69 were mutated to A68 and C69, respectively, and named m.A, m.B, m.C, m.D and m.E from 5′ to 3′. Mass chromatograms of the G and m2G of U6 and the different mutants after incubation with THUMPD2-TRMT112. (F) A detailed diagram of the primary sequence around G72 of U6 is shown on the left. m.F, in which C61 was mutated to U61; m.G, in which A73 was mutated to G73; m.H, in which the catalytic site, U74 was deleted. Mass chromatograms of the G and m2G of U6 and the various mutants after incubation with THUMPD2-TRMT112. In Figures D, E, and F, the target peaks are indicated by grey (G) and orange (m2G) triangles. The value of the left vertical axis indicates the intensity of G, and that of the right vertical axis indicates the intensity of m2G. In Figure A, statistical analysis was performed using t-tests, and the error bars indicate the mean ± SD for three independent experiments. n.d., not detected.
Figure 4.
Figure 4.
The in vitro assay of the splicing activity of the major spliceosome. (A) Northern blotting of the steady state level of U6 (upper lane) between the WT and THUMPD2-KO HEK293T, HeLa and HeLa S3 cells. 5.8S rRNA (lower lane) was used as a control. Northern blotting data shown are representative of three independent experiments. (B) Schematic of the in vitro splicing assays using the HeLa S3 nuclear extracts. (C) Detection of the pre-mRNA splicing activity using MINX pre-mRNA reporter in the WT and THUMPD2-KO HeLa S3 cells using RT-PCR. The unspliced (upper lane) and spliced (lower lane) MINX RNA were detected at varying time points from 0 to 240 min. In vitro splicing assay shown are representative of three independent experiments. (D) Detection of the pre-mRNA splicing activity using MINX pre-mRNA reporter in the THUMPD2-KO#1 HeLa S3 cells rescued by the plasmid-encoded human WT THUMPD2 and enzymatically inactive THUMPD2 mutant (D329A) using RT-PCR. The unspliced (upper lane) and spliced (lower lane) MINX RNA were detected at varying time points from 10 to 90 min. In vitro splicing assay shown are representative of four independent experiments. The ratios in Figures C and D represent the proportion of spliced MINX in the whole MINX RNA (unspliced and spliced MINX). The RT-PCR products were visualized using Gelred-stained agarose gels.
Figure 5.
Figure 5.
Analysis of endogenous pre-mRNA splicing in THUMPD2-KO cells. (A) Summary of the different alternative splicing (AS) events identified in THUMPD2-KO HEK293T cells and the number of splicing events affected by THUMPD2 depletion. (B) Bubble chart indicating the enriched GO terms in the biological processes apart from the protein-coding genes with significantly altered skipped exon (SE) events in the THUMPD2-KO HEK293T cells. (C) Sashimi plots of the RNA-seq junction read counts for the representative SE events in FLNA, CEP131 and FKBP15 and retained intron (RI) events in SPOUT1 in the THUMPD2-KO HEK293T cells. RPKM, reads per kilobase per million mapped reads. (D) Validation of the SE events in FLNA, CEP131 and FKBP15 and RI events in SPOUT1 in the THUMPD2-KO HEK293T cells using RT-PCR with β-actin as the loading control. Left: visualization of the RT-PCR products using Gelred-stained agarose gels. Right: quantification of percent spliced in (PSI); n = 3. In Figure D, statistical analysis was performed using t-tests, and the error bars indicate the mean ± SD for three independent experiments. ∗∗P< 0.01; ∗∗∗P< 0.001; ∗∗∗∗P< 0.0001.
Figure 6.
Figure 6.
THUMPD2-KO upregulates the expression of key factors involved in the NMD pathway. (A) Volcano plot of the differentially expressed genes analyzed using the RNA-seq data comparing the THUMPD2-KO HEK293T (n = 4) to the WT cells (n = 2). The dots for the markedly regulated genes (|fold change| > 2; P< 0.05) were colored in red (increase) and blue (decrease). The significant genes that did not pass the false discovery rate (FDR) of 5% were transparent. The dots and labels of the genes of interest with transcriptional activation and those related to the nonsense-mediated RNA decay (NMD) pathway are colored in red. (B) Functional categories of the upregulated genes in the THUMPD2-KO HEK293T cells indicating the P-value for the enrichment of biological process-related GO terms. (C) The mRNAs of the key genes involved in transcriptional activation- and translation initiation-related genes such as YY1, NR2F1, SMARCA4, TFAP2A, CITED1, MAF and EIF4G1 were measured using RT-qPCR. Data were normalized to β-actin expression. (D) The schematic diagram of the NMD pathway (73). The key factors involved were marked. (E) The mRNA levels of the key genes involved in the NMD pathway, such as UPF3X, XRN1, RNPS1, SMG1, SMG5, SMG7 and SMG6, were measured by RT-qPCR. Data were normalized to β-actin expression. (F) Determination of the phosphorylation levels of UPF1 (pUPF1) by western blotting. The ratio represents the relative expression levels of pUPF1 normalized to β-tubulin expression. Western blotting data shown are representative of three independent experiments. In Figures C and E, statistical analysis was performed using t-tests, and the error bars indicate the mean ± SD for three independent experiments. P< 0.05; ∗∗P< 0.01; ∗∗∗P< 0.001; ∗∗∗∗P< 0.0001.
Figure 7.
Figure 7.
The function in splicing regulation of THUMPD2 is associated with AMD pathogenesis. (A) Upset plot showing the intersection of genes detected in the AS events of THUMPD2. The AMD-associated gene list was accessed from the GWAS Catalog EFO_0001365 (81,83). The Matrix layout for all intersections. Dark circles in the matrix indicate sets that are a part of the intersection. (B) Venn diagram of the THUMPD2 SE targets overlapping with curated, AMD-associated gene list. The gene list name suffixes indicate the number of genes in the corresponding lists. Groups with < ten genes are listed. (C) Volcano plots of the confidence level of up- or down-regulated SEs. 1e−15 were assigned to the FDR events with corrected P-value too negligible to be accurately estimated. Several representative genes associated with AMD are labeled. Blue and red stand for the decreased and increased exon-inclusion levels, respectively, known as PSI. (D) Validation of the SE events in LTBP3, LTBP4, SLTM, SKIV2L and EGFL7 in the THUMPD2-KO HEK293T cells using RT-PCR with β-actin as a loading control. Left: visualization of the RT-PCR products using Gelred-stained agarose gels. Right: quantification of PSI; n = 3. (E) Validation of SE events in the retina-specific-functional genes, KIAA1549, POC1B and MPP5 in the THUMPD2-KO HEK293T cells using RT-PCR with β-actin as a loading control. Left: visualization of the RT-PCR products using Gelred-stained agarose gels. Right: quantification of PSI; n = 3. In Figures D and E, statistical analysis was performed using t-tests, and the error bars indicate the mean ± SD for three independent experiments. P< 0.05; ∗∗P< 0.01; ∗∗∗P< 0.001; ∗∗∗∗P< 0.0001.

Similar articles

Cited by

References

    1. Brody E., Abelson J.. The “spliceosome”: yeast pre-messenger RNA associates with a 40S complex in a splicing-dependent reaction. Science. 1985; 228:963–967. - PubMed
    1. Grabowski P.J., Seiler S.R., Sharp P.A.. A multicomponent complex is involved in the splicing of messenger RNA precursors. Cell. 1985; 42:345–353. - PubMed
    1. Frendewey D., Keller W.. Stepwise assembly of a pre-mRNA splicing complex requires U-snRNPs and specific intron sequences. Cell. 1985; 42:355–367. - PubMed
    1. Wang E.T., Sandberg R., Luo S., Khrebtukova I., Zhang L., Mayr C., Kingsmore S.F., Schroth G.P., Burge C.B.. Alternative isoform regulation in human tissue transcriptomes. Nature. 2008; 456:470–476. - PMC - PubMed
    1. Pan Q., Shai O., Lee L.J., Frey B.J., Blencowe B.J.. Deep surveying of alternative splicing complexity in the human transcriptome by high-throughput sequencing. Nat. Genet. 2008; 40:1413–1415. - PubMed