

Muscle MRI in Patients With Oculopharyngeal Muscular Dystrophy: A Longitudinal Study
- PMID: 38165364
- PMCID: PMC10834117
- DOI: 10.1212/WNL.0000000000207833
Muscle MRI in Patients With Oculopharyngeal Muscular Dystrophy: A Longitudinal Study
Erratum in
-
Corrections to Received Date Information.Neurology. 2024 Jul 9;103(1):e209596. doi: 10.1212/WNL.0000000000209596. Epub 2024 Jun 3. Neurology. 2024. PMID: 38830175 Free PMC article. No abstract available.
Abstract
Background and objectives: Oculopharyngeal muscular dystrophy (OPMD) is a rare progressive neuromuscular disease. MRI is one of the techniques that is used in neuromuscular disorders to evaluate muscle alterations. The aim of this study was to describe the pattern of fatty infiltration of orofacial and leg muscles using quantitative muscle MRI in a large national cohort and to determine whether MRI can be used as an imaging biomarker of disease progression in OPMD.
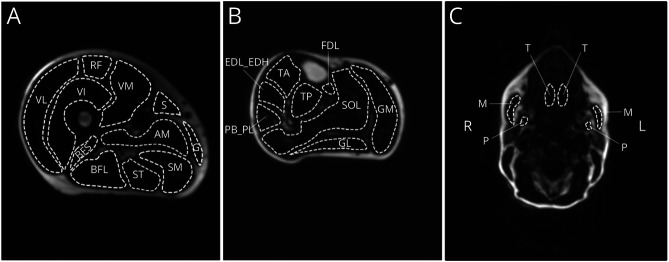
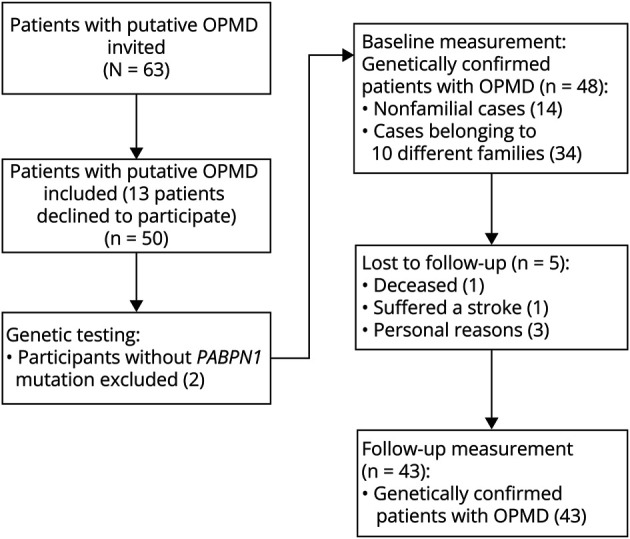
Methods: Patients with OPMD (18 years or older) were invited from the national neuromuscular database or by their treating physicians and were examined twice with an interval of 20 months, with quantitative MRI of orofacial and leg muscles to assess fatty infiltration which were compared with clinical measures.
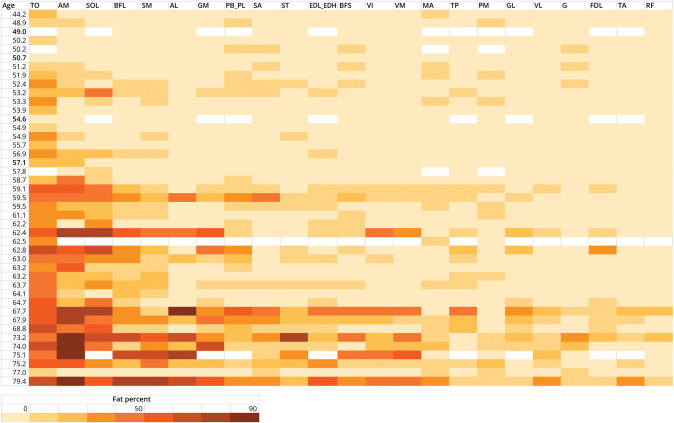
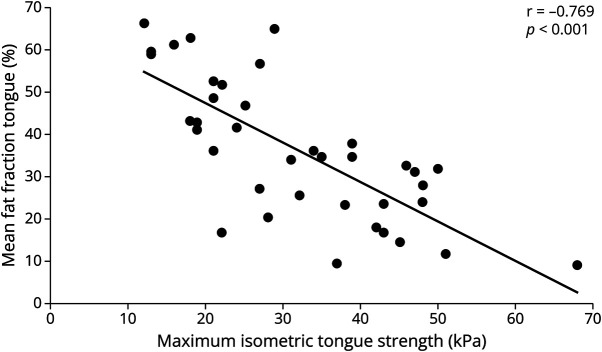
Results: In 43 patients with genetically confirmed OPMD, the muscles that were affected most severely were the tongue (mean fat fraction: 37.0%, SD 16.6), adductor magnus (31.9%; 27.1), and soleus (27.9%; 21.5) muscles. The rectus femoris and tibialis anterior muscles were least severely affected (mean fat fractions: 6.8%; SD 4.7, 7.5%; 5.9). Eleven of 14 significant correlations were found between fat fraction and a clinical task in the corresponding muscles (r = -0.312 to -0.769, CI = -0.874 to -0.005). At follow-up, fat fractions had increased significantly in 17 of the 26 muscles: mean 1.7% in the upper leg muscles (CI = 0.8-2.4), 1.7% (1.0-2.3) in the lower leg muscles, and 1.9% (0.6-3.3) in the orofacial muscles (p < 0.05). The largest increase was seen for the soleus (3.8%, CI = 2.5-5.1). Correlations were found between disease duration and repeat length vs increased fat fraction in 7 leg muscles (r = 0.323 to -0.412, p < 0.05).
Discussion: According to quantitative muscle MRI, the tongue, adductor magnus and soleus show the largest fat infiltration levels in patients with OPMD. Fat fractions increased in several orofacial and leg muscles over 20 months, with the largest fat fraction increase seen in the soleus. This study supports that this technique is sensitive enough to show worsening in fat fractions of orofacial and leg muscles and therefore a responsive biomarker for future clinical trials.
Conflict of interest statement
The authors report no disclosures relevant to the manuscript. Go to
Figures
References
MeSH terms
Substances
LinkOut - more resources
Full Text Sources