

Retinal Vascular Measurements and Mortality Risk: Evidence From the UK Biobank Study
- PMID: 38165718
- PMCID: PMC10773151
- DOI: 10.1167/tvst.13.1.2
Retinal Vascular Measurements and Mortality Risk: Evidence From the UK Biobank Study
Abstract
Purpose: This study aimed to investigate the association between quantitative retinal vascular measurements and the risk of all-cause and premature mortality.
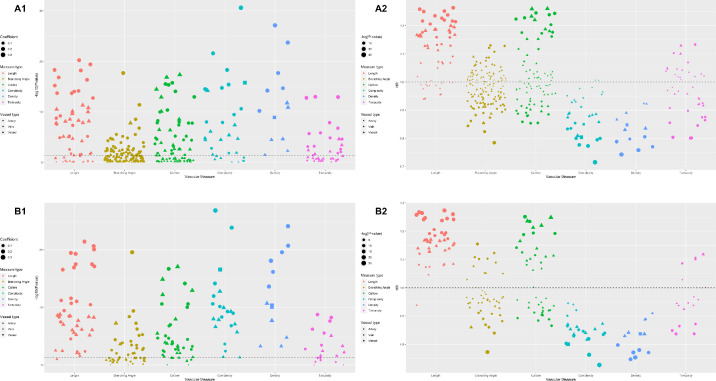
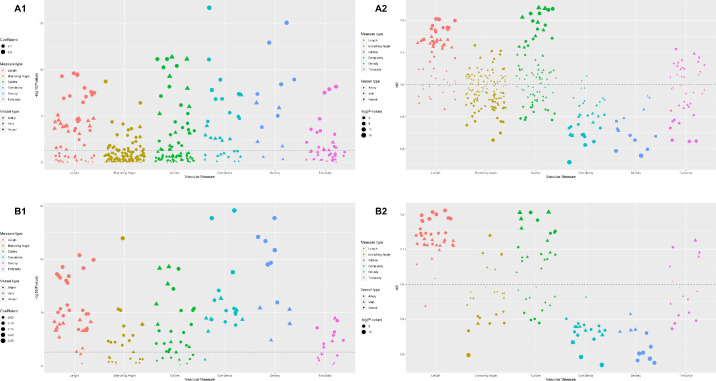
Methods: In this population-based cohort study using the UK Biobank data, we employed the Retina-based Microvascular Health Assessment System to assess fundus images for image quality and extracted 392 retinal vascular measurements per fundus image. These measurements encompass six categories of vascular features: caliber, density, length, tortuosity, branching angle, and complexity. Univariate Cox regression models were used to identify potential indicators of mortality risk using data on all-cause and premature mortality from death registries. Multivariate Cox regression models were then used to test these associations while controlling for confounding factors.
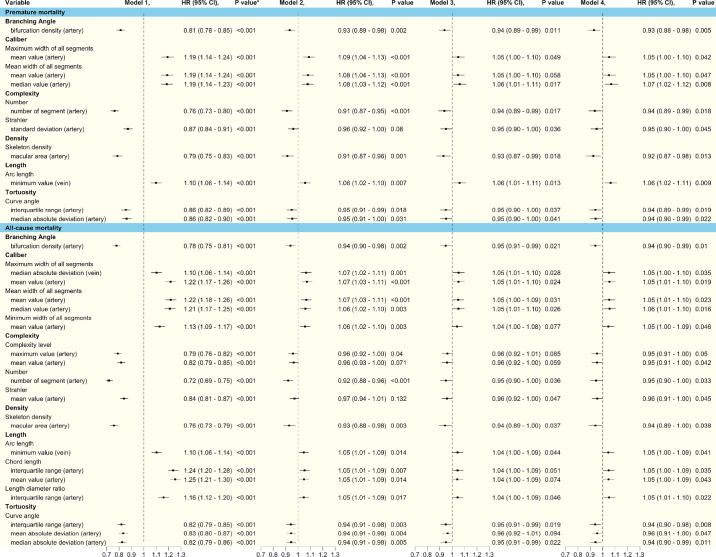
Results: The final analysis included 66,415 participants. After adjusting for demographic, health, and lifestyle factors and genetic risk score, 18 and 10 retinal vascular measurements were significantly associated with all-cause mortality and premature mortality, respectively. In the fully adjusted model, the following measurements of different vascular features were significantly associated with all-cause mortality and premature mortality: arterial bifurcation density (branching angle), number of arterial segments (complexity), interquartile range and median absolute deviation of arterial curve angle (tortuosity), mean and median values of mean pixel widths of all arterial segments in each image (caliber), skeleton density of arteries in macular area (density), and minimum venular arc length (length).
Conclusions: The study revealed 18 retinal vascular measurements significantly associated with all-cause mortality and 10 associated with premature mortality. Those identified parameters should be further studied for biological mechanisms connecting them to increased mortality risk.
Translational relevance: This study identifies retinal biomarkers for increased mortality risk and provides novel targets for investigating the underlying biological mechanisms.
Conflict of interest statement
Disclosure:
Figures
Similar articles
-
Retinal vascular fingerprints predict incident stroke: findings from the UK Biobank cohort study.Heart. 2025 Mar 13;111(7):306-313. doi: 10.1136/heartjnl-2024-324705. Heart. 2025. PMID: 39805634
-
Association of retinal microvascular curve tortuosity and multiple sclerosis: A cross-section analysis from the UK Biobank.Mult Scler Relat Disord. 2024 Aug;88:105753. doi: 10.1016/j.msard.2024.105753. Epub 2024 Jul 5. Mult Scler Relat Disord. 2024. PMID: 38996710
-
Retinal oculomics and risk of incident aortic aneurysm and aortic adverse events: a population-based cohort study.Int J Surg. 2025 Mar 1;111(3):2478-2486. doi: 10.1097/JS9.0000000000002236. Int J Surg. 2025. PMID: 39878168
-
Retinal Vascular Signs and Cerebrovascular Diseases.J Neuroophthalmol. 2020 Mar;40(1):44-59. doi: 10.1097/WNO.0000000000000888. J Neuroophthalmol. 2020. PMID: 31977663 Review.
-
[A new approach for studying the retinal and choroidal circulation].Nippon Ganka Gakkai Zasshi. 2004 Dec;108(12):836-61; discussion 862. Nippon Ganka Gakkai Zasshi. 2004. PMID: 15656089 Review. Japanese.
Cited by
-
Changes of the peripapillary vascular parameters in premature infants without retinopathy of prematurity using U-net segmentation.Int J Ophthalmol. 2024 Aug 18;17(8):1453-1461. doi: 10.18240/ijo.2024.08.10. eCollection 2024. Int J Ophthalmol. 2024. PMID: 39156772 Free PMC article.
-
Associations of Retinal Microvascular Density and Fractal Dimension with Glaucoma: A Prospective Study from UK Biobank.Ophthalmol Sci. 2024 Nov 28;5(2):100661. doi: 10.1016/j.xops.2024.100661. eCollection 2025 Mar-Apr. Ophthalmol Sci. 2024. PMID: 39850540 Free PMC article.
-
Population-Based Normative Reference for Retinal Microvascular Atlas.Ophthalmol Sci. 2025 Jan 31;5(3):100723. doi: 10.1016/j.xops.2025.100723. eCollection 2025 May-Jun. Ophthalmol Sci. 2025. PMID: 40161461 Free PMC article.
-
Advances in ocular aging: combining deep learning, imaging, and liquid biopsy biomarkers.Front Med (Lausanne). 2025 Jul 23;12:1591936. doi: 10.3389/fmed.2025.1591936. eCollection 2025. Front Med (Lausanne). 2025. PMID: 40771477 Free PMC article. Review.
-
Retinal Vessel Geometry and Retinal Abnormalities in Cerebral Autosomal Dominant Arteriopathy With Subcortical Infarcts and Leukoencephalopathy.Transl Vis Sci Technol. 2025 Jun 2;14(6):17. doi: 10.1167/tvst.14.6.17. Transl Vis Sci Technol. 2025. PMID: 40488700 Free PMC article.
References
-
- Institute for Health Metrics and Evaluation. Global Burden of Disease Study 2019. Available at: https://www.healthdata.org/research-analysis/gbd. Accessed December 7, 2023.
-
- Office for National Statistics. Avoidable mortality in Great Britain: 2020. Available at: https://www.ons.gov.uk/peoplepopulationandcommunity/healthandsocialcare/.... Accessed September 30, 2022.
-
- Brown LTL, Nepal B. The Cost of Inaction on the Social Determinants of Health. Canberra: National Centre for Social and Economic Modelling; 2012.
-
- Oliver JM, Gallego P, Gonzalez AE, et al. .. Predicting sudden cardiac death in adults with congenital heart disease. Heart. 2021; 107(1): 67–75. - PubMed
-
- Loprinzi PD, Addoh O.. Predictive validity of the American College of Cardiology/American Heart Association pooled cohort equations in predicting all-cause and cardiovascular disease-specific mortality in a national prospective cohort study of adults in the United States. Mayo Clin Proc. 2016; 91(6): 763–769. - PubMed
MeSH terms
LinkOut - more resources
Full Text Sources
