. 2024 Jan 2;13(1):1.
doi: 10.1167/tvst.13.1.1.

Acrizanib as a Novel Therapeutic Agent for Fundus Neovascularization via Inhibitory Phosphorylation of VEGFR2

Affiliations

Acrizanib as a Novel Therapeutic Agent for Fundus Neovascularization via Inhibitory Phosphorylation of VEGFR2

Xiaoyu Tang et al. Transl Vis Sci Technol. .

Abstract

Purpose: The present study aimed to evaluate the effect of acrizanib, a small molecule inhibitor targeting vascular endothelial growth factor receptor 2 (VEGFR2), on physiological angiogenesis and pathological neovascularization in the eye and to explore the underlying molecular mechanisms.

Methods: We investigated the potential role of acrizanib in physiological angiogenesis using C57BL/6J newborn mice, and pathological angiogenesis using the mouse oxygen-induced retinopathy (OIR) and laser-induced choroidal neovascularization (CNV) models. Moreover, vascular endothelial growth factor (VEGF)-treated human umbilical vein endothelial cells (HUVECs) were used as an in vitro model for studying the molecular mechanism underlying acrizanib's antiangiogenic effects.

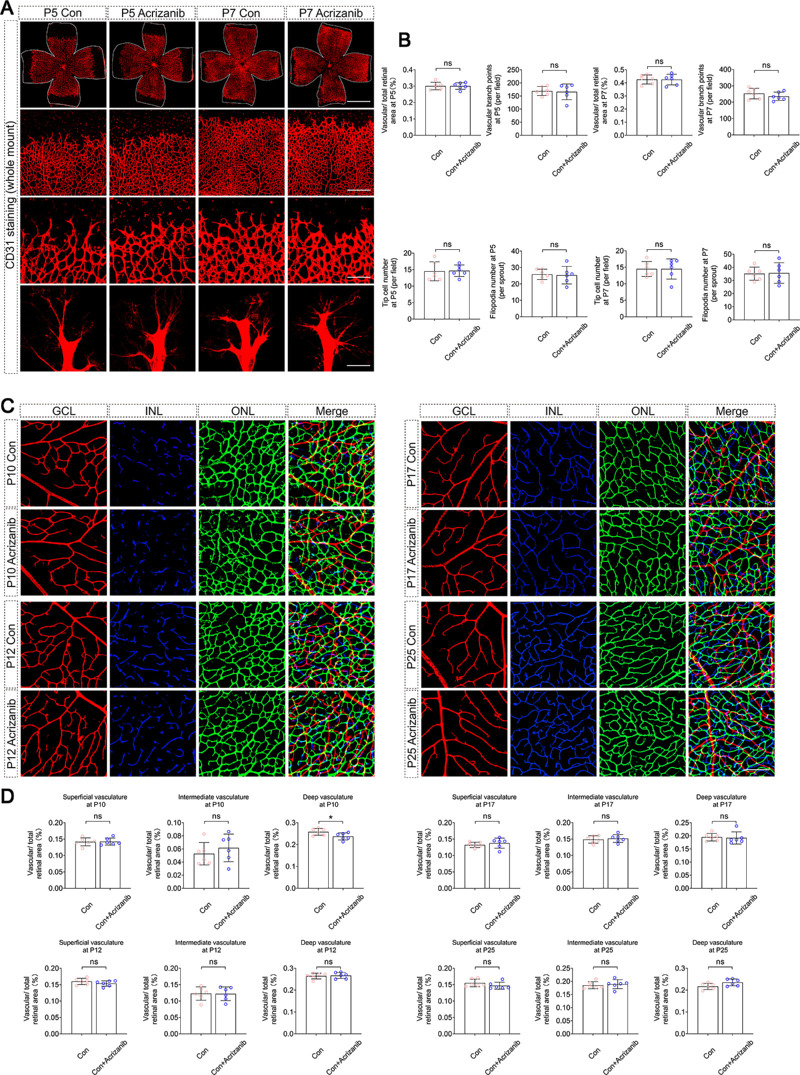
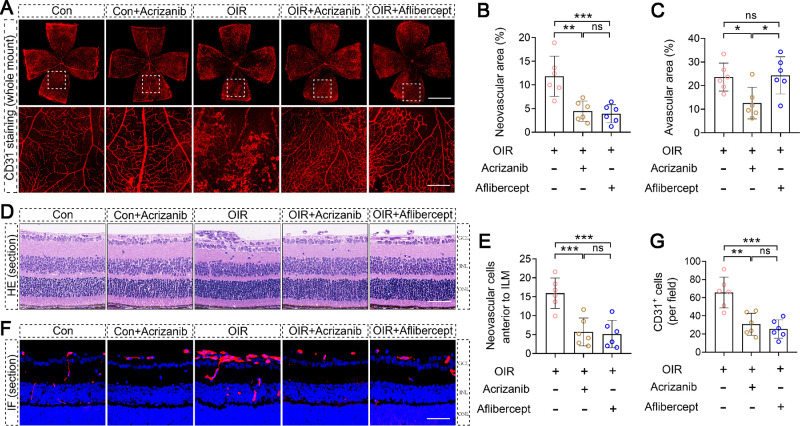
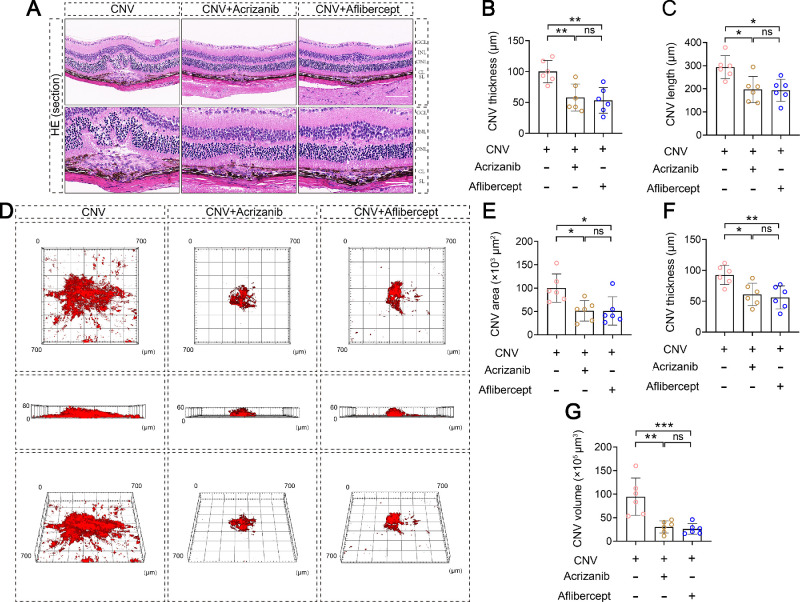
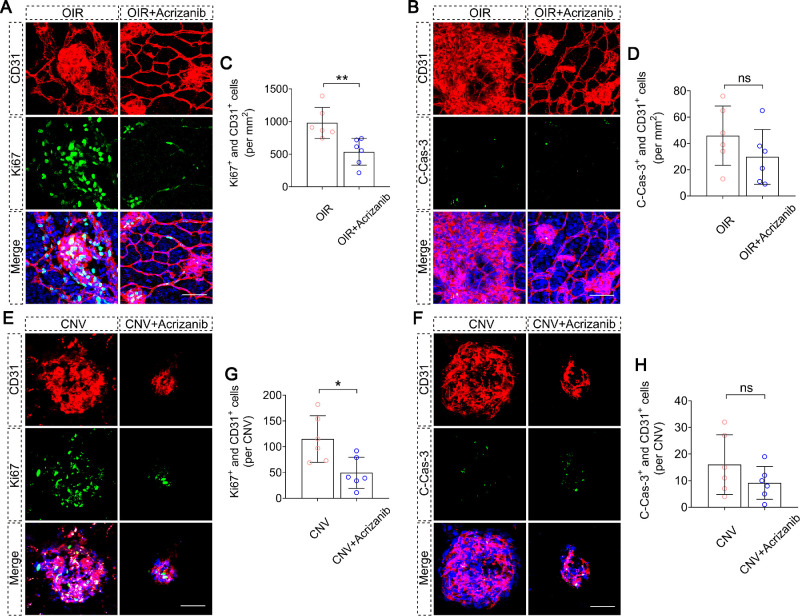
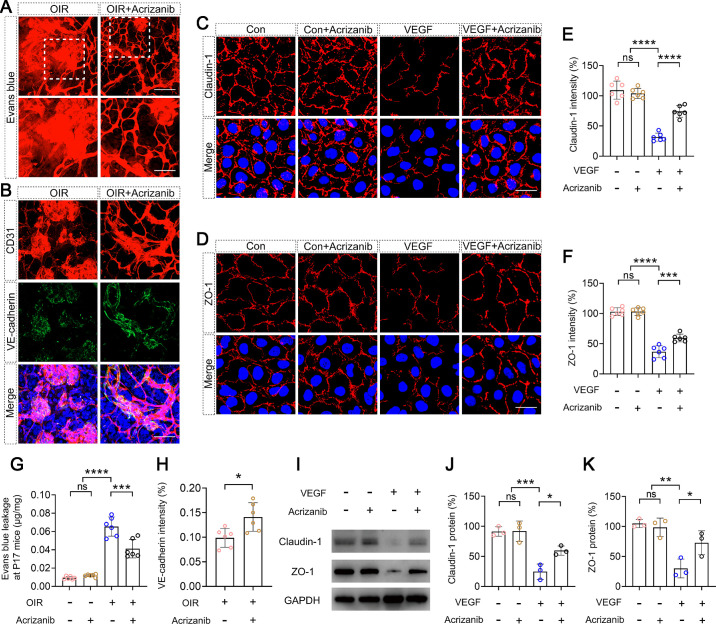
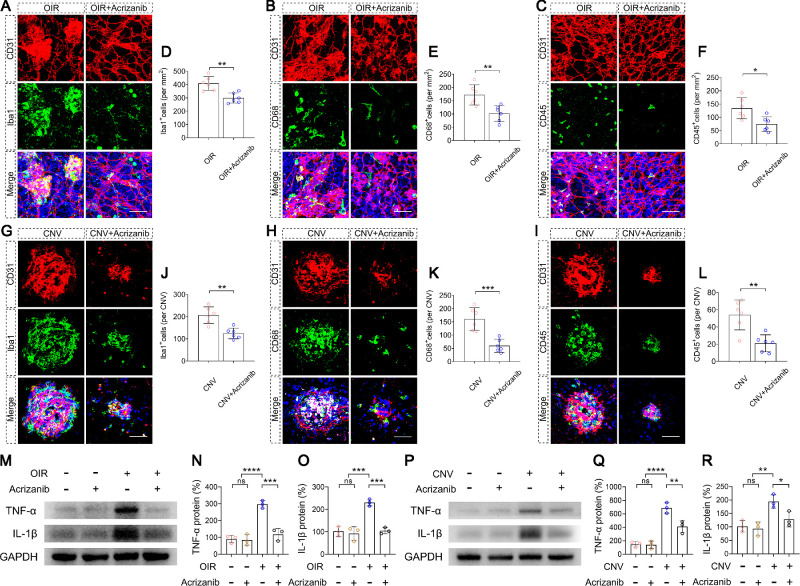
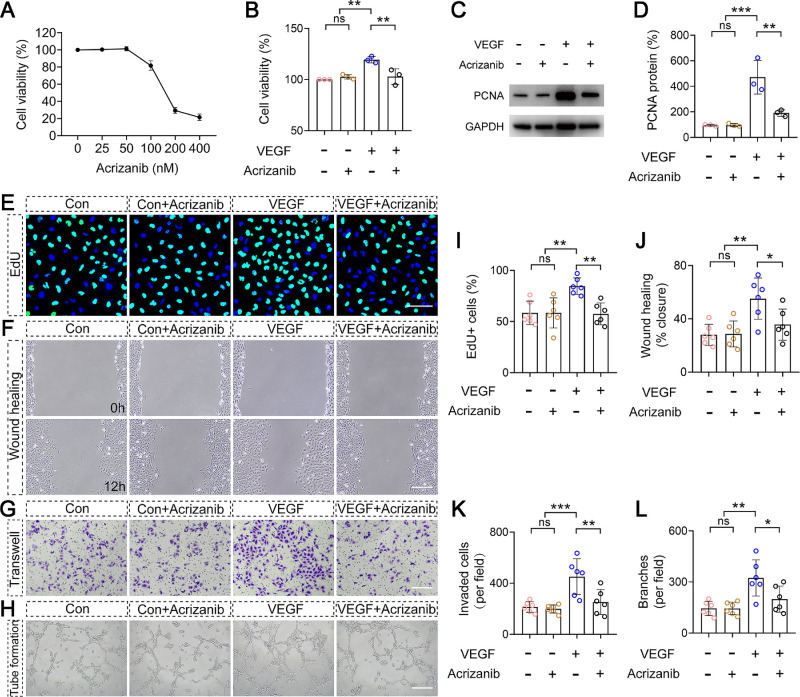
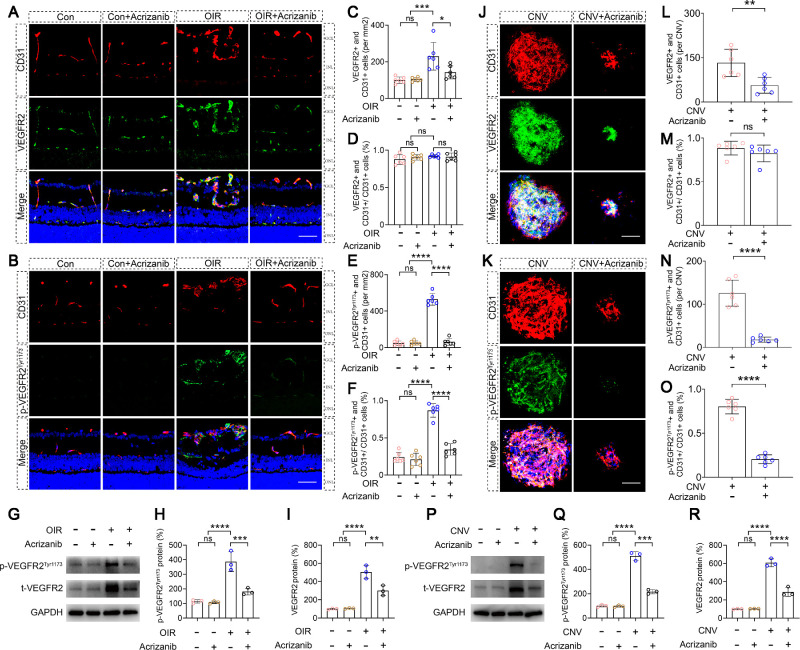
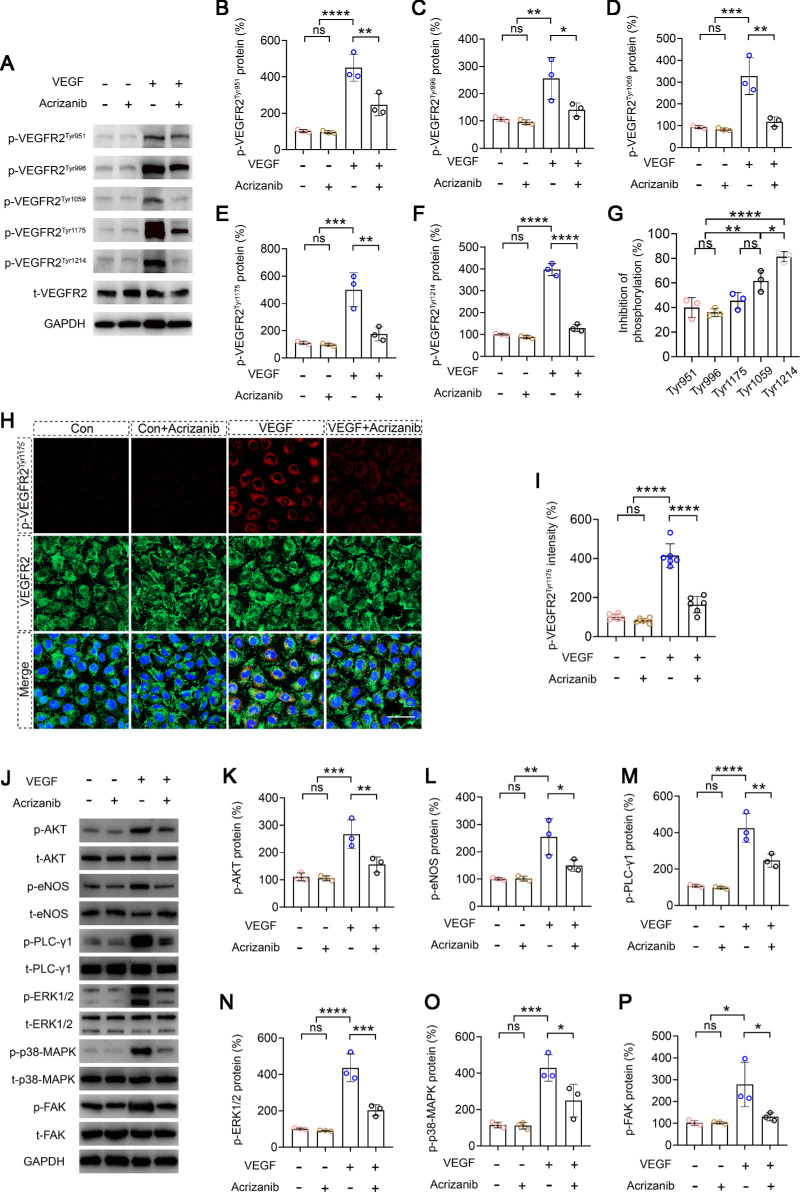
Results: The intravitreal injection of acrizanib did not show a considerable impact on physiological angiogenesis and retinal thickness, indicating a potentially favorable safety profile. In the mouse models of OIR and CNV, acrizanib showed promising results in reducing pathological neovascularization, inflammation, and vascular leakage, indicating its potential efficacy against pathological angiogenesis. Consistent with in vivo results, acrizanib blunted angiogenic events in VEGF-treated HUVECs such as proliferation, migration, and tube formation. Furthermore, acrizanib inhibited the multisite phosphorylation of VEGFR2 to varying degrees and the activation of its downstream signal pathways in VEGF-treated HUVECs.

Conclusions: This study suggested the potential efficacy and safety of acrizanib in suppressing fundus neovascularization. Acrizanib functioned through inhibiting multiple phosphorylation sites of VEGFR2 in endothelial cells to different degrees.

Translational relevance: These results indicated that acrizanib might hold promise as a potential candidate for the treatment of ocular vascular diseases.


Conflict of interest statement

Disclosure: X. Tang, None; K. Cui, None; P. Wu, None; A. Hu, None; M. Fan, None; X. Lu, None; F. Yang, None; J. Lin, None; S. Yu, None; Y. Xu, None; X. Liang, None

Figures

Figure 1.
Figure 1.
The effect of acrizanib on the development of retinal vasculature. C57BL/6J mice were treated with an intravitreal injection of acrizanib (0.5 µL, 10 µM) at P3, and an equal volume of solvent was given in the fellow eye as a control. (A) Representative images of CD31-stained retinal whole mounts from P5 and P7 mice. From line 1 to line 4, images were presented at different magnifications to clearly show overall vascularization (line 1, scale bar: 1 mm), branches (line 2, scale bar: 300 µm), tip cells (line 3, scale bar: 100 µm), and filopodia of vessels (line 4, scale bar: 10 µm). White lines depict the size of retinas. (B) Quantification of vascular/total retinal area (%), branch points per field, tip cell number per field, and filopodia number per sprout in the Control group and the Control + Acrizanib group at P5 or P7 (n = 6 per group). (C) Representative images of retinal whole mounts stained with CD31 at P10, P12, P17, and P25 (scale bar: 50 µm). (D) Quantification of vascular/total retinal area (%) of superficial, intermediate, and deep vascular network in P10, P12, P17, and P25 retinas (n = 6 per group). Data are mean ± SEM. * P < 0.05; ns, no significance, using unpaired, two-tailed Student's t-test (B, D). GCL, ganglion cell layer; INL, inner nuclear layer; ONL, outer nuclear layer.
Figure 2.
Figure 2.
The effect of acrizanib on RNV in the mouse OIR model. C57BL/6J mice were put into a high oxygen environment (75% ± 5% O2) at P7 and returned to room air at P12. At P12, the pups received an intravitreal injection of acrizanib (0.5 µL, 10 µM) or aflibercept (0.5 µL, 40 mg/mL) in one eye and solvent in the other eye as control. At P17, pups were euthanized for sample collection. (A) Upper image: Representative images of CD31-stained retinal whole mounts (scale bar: 1 mm). Lower image: The higher magnification images of areas indicated by white boxes (scale bar: 200 µm). Retinal neovascularization (B), and avascular area (C) were determined as described in the “Materials and Methods” using the retinal whole mounts (n = 6 per group). (D) Representative photomicrographs of HE-stained eyeball sections. Neovascular cell nuclei anterior to ILM represented extent of retinal neovascularization (scale bar: 50 µm). (E) Quantification of the neovascular cell nuclei anterior to the ILM per field in each group at P17 (n = 6 per group). (F) Representative immunofluorescent images for CD31 (red) and DAPI (blue) in each group (scale bar: 50 µm). (G) Quantification of CD31-positive cells nuclei per field in each group at P17 (n = 6 per group). Data are mean ± SEM. * P < 0.05; ** P < 0.01; *** P < 0.001; ns, no significance, using one-way ANOVA followed by Tukey's multiple comparisons test (B, C, E, G). OIR, oxygen induced retinopathy; ILM, internal limiting membrane; GCL, ganglion cell layer; INL, inner nuclear layer; ONL, outer nuclear layer.
Figure 3.
Figure 3.
The effect of acrizanib on CNV in the mouse laser-induced CNV model. Choroidal neovascularization was laser-induced in C57BL/6J mice (six to eight weeks). After modeling, mice were immediately treated by intravitreal injection with acrizanib (1 µL, 10 µM) or aflibercept (1 µL, 40 mg/mL) in one eye and solvent in the other eye as control. (A) Upper image: Representative photomicrographs of HE-stained eyeball sections in each group (CNV, CNV + Acrizanib, CNV + Aflibercept) (scale bar: 100 µm). Lower image: The high power images from each group were shown (scale bar: 50 µm). The thickness (B) and length (C) of choroidal neovascularization were quantified (n = 6 per group). (D) Representative three-dimensional images of the area, thickness, and volume of CNV were scanned by the confocal laser microscope. The area (E), thickness (F), and volume (G) of choroidal neovascularization were quantified using Zeiss Zen software (n = 6 per group). Data are mean ± SEM. * P < 0.05; ** P < 0.01; *** P < 0.001; ns, no significance, using one-way ANOVA followed by Tukey's multiple comparisons test (B, C, E–G). CNV, choroidal neovascularization; GCL, ganglion cell layer; INL, inner nuclear layer; ONL, outer nuclear layer; CL, choroid layer; SL, sclera layer.
Figure 4.
Figure 4.
The effect of acrizanib on cell proliferation and apoptosis of neovascularized areas. Immunofluorescence staining of retinal flatmounts from OIR and OIR + Acrizanib mice. Red represents CD31; green represents Ki67 (A) or C-Cas-3 (B); blue represents the nucleus stained by DAPI (scale bar: 50 µm). Quantitation of Ki67 (C) or C-Cas-3 (D) positive cells in the neovascularized areas (n = 6 per group). Immunofluorescence staining of choroidal flatmounts from CNV and CNV + Acrizanib mice. Red represents CD31; green represents Ki67 (E) or C-Cas-3 (F); blue represents the nucleus stained by DAPI (scale bar: 100 µm). Quantitation of Ki67 (G) or C-Cas-3 (H) positive cells in the neovascularized areas (n = 6 per group). Data are mean ± SEM. * P < 0.05; ** P < 0.01; ns, no significance, using unpaired, two-tailed Student t-test (C, D, G, H). OIR, oxygen induced retinopathy; CNV, choroidal neovascularization; C-Cas-3, cleaved caspase-3.
Figure 5.
Figure 5.
The effect of acrizanib on vascular endothelial permeability in vivo and in vitro. (A) Upper image: Representative image of Evans blue leakage in retinas of OIR and OIR + Acrizanib mice (scale bar: 50 µm). Lower image: The high power images from each group were shown (scale bar: 25 µm). (G) Quantitation of Evans blue extravasation in retinas of mice at P17. The content of EB in retina (µg/mg) = the concentration of EB in formamide (µg/µL) × 60 (µL)/dry weight of retina (mg). (n = 6 per group). (B) Immunofluorescence staining of retinal flatmounts from OIR and OIR + Acrizanib mice. Red represents CD31; green represents VE-cadherin; blue represents the nucleus stained by DAPI (scale bar: 50 µm). (H) Mean fluorescence intensity of VE-cadherin in the neovascularized areas was quantified (n = 6 per group). Immunofluorescence images of HUVECs in different treatment groups (control, control + Acrizanib, VEGF, VEGF + Acrizanib). Red represents Claudin-1 (C) or ZO-1 (D); blue represents the nucleus stained by DAPI (scale bar: 30 µm). Mean fluorescence intensity of Claudin-1 (E) or ZO-1 (F) at cell junctions was quantified (n = 6 per group). (I) Western blot of HUVEC lysate showed the expression of Claudin-1 and ZO-1 in each group. GAPDH served as the loading control. The histogram showed the densitometric analysis of the average level of Claudin-1/GAPDH (J) and ZO-1/GAPDH (K). Relative protein levels were presented by taking control as 100% (n = 3 per group). Data are mean ± SEM. * P < 0.05; ** P < 0.01; *** P < 0.001; **** P < 0.0001; ns, no significance, using unpaired, two-tailed Student's t-test (H) and one-way ANOVA followed by Tukey's multiple comparisons test (E–G, J, K). OIR, oxygen-induced retinopathy.
Figure 6.
Figure 6.
The effect of acrizanib on inflammation associated with neovascularization. Immunofluorescence staining of retinal flatmounts from OIR and OIR + Acrizanib mice. Red represents CD31; green represents Iba1 (A), CD68 (B) or CD45, (C); blue represents the nucleus stained by DAPI (scale bar: 50 µm). Quantitation of Iba1 (D), CD68 (E), and CD45 (F) positive cells in the neovascularized areas (n = 6 per group). Immunofluorescence staining of choroidal flatmounts from CNV and CNV + Acrizanib mice. Red represents CD31; green represents Iba1 (G), CD68 (H), or CD45 (I); blue represents the nucleus stained by DAPI (scale bar: 100 µm). Quantitation of Iba1 (J), CD68 (K), CD45 (L) positive cells in the neovascularized areas (n = 6 per group). (M) Western blot of retinal lysate showed the expression of TNF-α and IL-1β in each group. GAPDH served as the loading control. (N, O) The histogram showed the densitometric analysis of the average levels of TNF-α/GAPDH (N) and IL-1β/GAPDH (O). Relative protein levels were presented by taking control as 100% (n = 3 per group). (P) Western blot of RPE-choroid-sclera lysate showed the expression of TNF-α and IL-1β in each group. GAPDH served as the loading control. The histogram showed the densitometric analysis of the average levels of TNF-α/GAPDH (Q) and IL-1β/GAPDH (R). Relative protein levels were presented by taking control as 100% (n = 3 per group). Data are mean ± SEM. * P < 0.05; ** P < 0.01; *** P < 0.001; **** P < 0.0001; ns, no significance, using unpaired, two-tailed Student's t-test (D–F, J–L), one-way ANOVA followed by Tukey's multiple comparisons test (N, O, Q, R). OIR, oxygen induced retinopathy; CNV, choroidal neovascularization.
Figure 7.
Figure 7.
The effect of acrizanib on the proliferation, migration, and tube formation of HUVECs. (A) The toxicity of different concentrations of acrizanib on HUVECs was detected by the CCK8 assay. HUVECs were treated with acrizanib (0, 25, 50, 100, 200, and 400 nM) for 24 hours (n = 3 per group). The control group was set at 100%. (B) The effect of 50 nM acrizanib on the proliferation of 10 ng/mL VEGF-treated HUVECs was measured by CCK8 assays (n = 3 per group). The control group was set at 100%. (C) Western blot of HUVEC lysate showed the expression of PCNA, a cellular proliferation marker, in each group. GAPDH served as the loading control. (D) The histogram showed the densitometric analysis of the average level of PCNA/GAPDH. Relative protein levels were presented by taking control as 100% (n = 3 per group). (E) Representative images of EdU incorporation assay in each group. EdU staining (green) showed the effects of 50 nM acrizanib on the proliferation of VEGF-treated HUVECs (scale bar: 100 µm). (F) Representative photomicrographs of scratch assay in each group for 0, 12 hours (scale bar: 1 mm). (G) Representative photomicrographs of transwell assay captured after 18 hours in each group (scale bar: 1 mm). (H) Representative photomicrographs of HUVEC tube formation assay captured after six hours in each group (scale bar: 1 mm). (I) Ratio of EdU-positive cells/total cells was quantified (n = 6 per group). (J) Wound closure (%) was quantified as (wound closure area/initial wound area) × 100% (n = 6 per group). (K) Number of HUVECs was counted on the lower surface of the transwell membrane in each group (n = 6 per group). (L) Number of branches in each group was quantified (n = 6 per group). Data are mean ± SEM. * P < 0.05; ** P < 0.01; *** P < 0.001; ns, no significance, using one-way ANOVA followed by Tukey's multiple comparisons test (B, D, I–L).
Figure 8.
Figure 8.
The effect of acrizanib on total/phosphorylated VEGFR2 in vivo. Immunofluorescence staining in sections of eye balls from the different groups (Control, Control + Acrizanib, OIR, and OIR + Acrizanib). Red represents CD31; green represents VEGFR2 (A), p-VEGFR2Tyr1173; (B) blue represents the nucleus stained by DAPI (scale bar: 50 µm). Quantitation of VEGFR2- (C, D) and p-VEGFR2Tyr1173– (E, F) positive cells in the neovascularized areas (n = 6 per group). (G) Western blot of retinal lysate showed the expression of p-VEGFR2Tyr1173 and VEGFR2 in each group. GAPDH served as the loading control. The histogram showed the densitometric analysis of the average levels of p-VEGFR2Tyr1173/GAPDH (H) and VEGFR2/GAPDH (I). Relative protein levels were presented by taking control as 100% (n = 3 per group). (J, K) Immunofluorescence staining of choroidal flatmounts from CNV and CNV + Acrizanib mice. Red represents CD31; green represents VEGFR2 (J), p-VEGFR2Tyr1173 (K); blue represents the nucleus stained by DAPI (scale bar: 100 µm). Quantitation of VEGFR2 (L, M), p-VEGFR2Tyr1173 (N, O) positive cells in the neovascularized areas (n = 6 per group). (P) Western blot of RPE-choroid-sclera lysate showed the expression of p-VEGFR2Tyr1173 and VEGFR2 in each group. GAPDH served as the loading control. The histogram showed the densitometric analysis of the average levels of VEGFR2Tyr1173/GAPDH (Q) and VEGFR2/GAPDH (R). Relative protein levels were presented by taking control as 100% (n = 3 per group). Data are mean ± SEM. * P < 0.05; ** P < 0.01; *** P < 0.001; **** P < 0.0001; ns, no significance, using unpaired, two-tailed Student's t-test (L–O), one-way ANOVA followed by Tukey's multiple comparisons test (C–F, H, I, Q, R). OIR, oxygen induced retinopathy; CNV, choroidal neovascularization; GCL, ganglion cell layer; INL, inner nuclear layer; ONL, outer nuclear layer.
Figure 9.
Figure 9.
The effect of acrizanib on different phosphorylation sites of VEGFR2 and their downstream pathways in vitro. (A) Western blot of HUVEC lysate showed the expression of p-VEGFR2Tyr951, p-VEGFR2Tyr996, p-VEGFR2Tyr1059, p-VEGFR2Tyr1175 and p-VEGFR2Tyr1214 in each group (Control, Control+Acrizanib, VEGF and VEGF + Acrizanib). The histogram showed the densitometric analysis of the average levels of p-VEGFR2Tyr951/t-VEGFR2 (B), p-VEGFR2Tyr996/t-VEGFR2 (C), p-VEGFR2Tyr1059/t-VEGFR2 (D), p-VEGFR2Tyr1175/t-VEGFR2 (E), and p-VEGFR2Tyr1214/t-VEGFR2 (F). Relative protein levels were presented by taking control as 100% (n = 3 per group). (G) The histogram showed the extent of inhibition of different VEGFR2 phosphorylation sites. Inhibition of phosphorylation (%) = (difference between relative protein levels in VEGF group and VEGF + Acrizanib group) /relative protein level in VEGF group × 100%. (H) Immunofluorescence images of HUVECs in different treatment groups. Red represents p-VEGFR2Tyr1175; Green represents VEGFR2; Blue represents the nucleus stained by DAPI (scale bar: 50 µm). (I) Mean fluorescence intensity of VEGFR2Tyr1175 was quantified (n = 6 per group). (J) Western blot of HUVEC lysate showed the expression of p-AKT, t-AKT, p-eNOS, t-eNOS, p-PLC-γ1, t-PLC-γ1, p-ERK1/2, t-ERK1/2, p-p38-MAPK, t-p38-MAPK, p-FAK and t-FAK in each group. GAPDH served as the loading control. The histogram showed the densitometric analysis of the average levels of p-AKT/t-AKT (K), p-eNOS/t-eNOS (L), p-PLC-γ1/t-PLC-γ1 (M), p-ERK1/2/t-ERK1/2 (N), p-p38-MAPK/t-p38-MAPK (O), and p-FAK/t-FAK (P). Relative protein levels were presented by taking control as 100% (n = 3 per group). Data are mean ± SEM. * P < 0.05; ** P < 0.01; *** P < 0.001; **** P < 0.0001; ns, no significance, using one-way ANOVA followed by Tukey's multiple comparisons test (B–G, I, K–P).

Similar articles

Cited by

References

    1. Hartnett ME, Penn JS.. Mechanisms and management of retinopathy of prematurity. N Engl J Med. 2012; 367: 2515–2526. - PMC - PubMed
    1. Cheung N, Mitchell P, Wong TY.. Diabetic retinopathy. Lancet. 2010; 376: 124–136. - PubMed
    1. Mitchell P, Liew G, Gopinath B, et al. .. Age-related macular degeneration. Lancet. 2018; 392: 1147–1159. - PubMed
    1. Selvam S, Kumar T, Fruttiger M.. Retinal vasculature development in health and disease. Prog Retin Eye Res. 2018; 63: 1–19. - PubMed
    1. Grossniklaus HE, Green WR.. Choroidal neovascularization. Am J Ophthalmol. 2004; 137: 496–503. - PubMed

MeSH terms

Substances