. 2024 Jan 2;9(3):e161356.
doi: 10.1172/jci.insight.161356.

hsa-miR-548v controls the viscoelastic properties of human cardiomyocytes and improves their relaxation rates

Affiliations

hsa-miR-548v controls the viscoelastic properties of human cardiomyocytes and improves their relaxation rates

Eva Vermersch et al. JCI Insight. .

Abstract

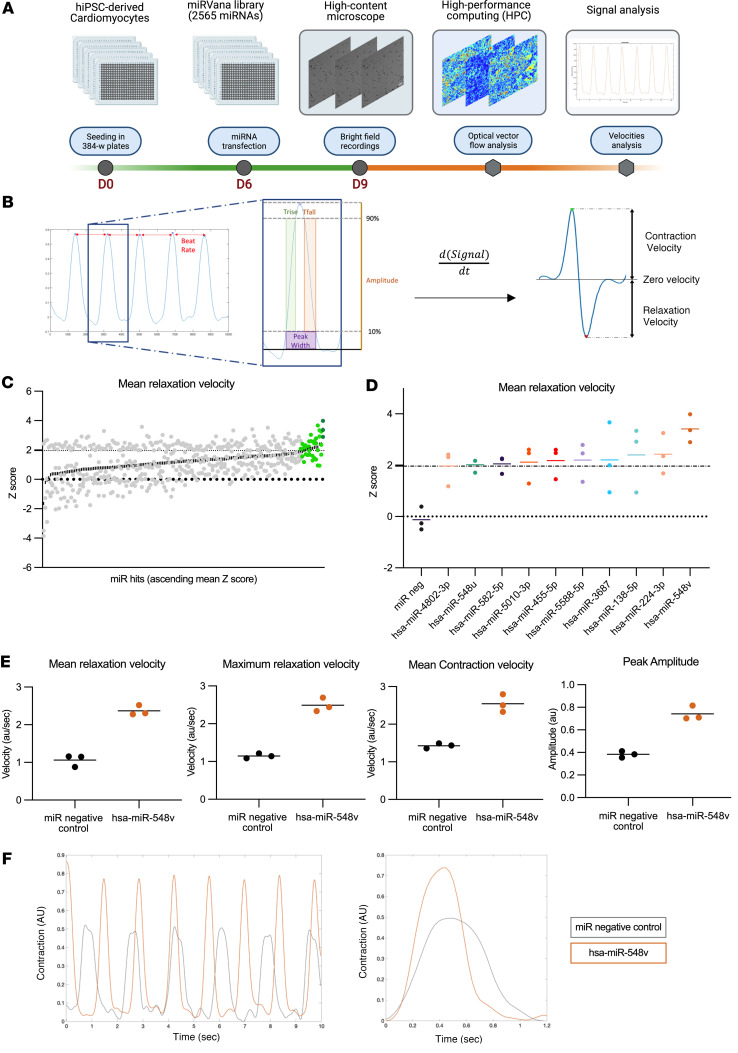
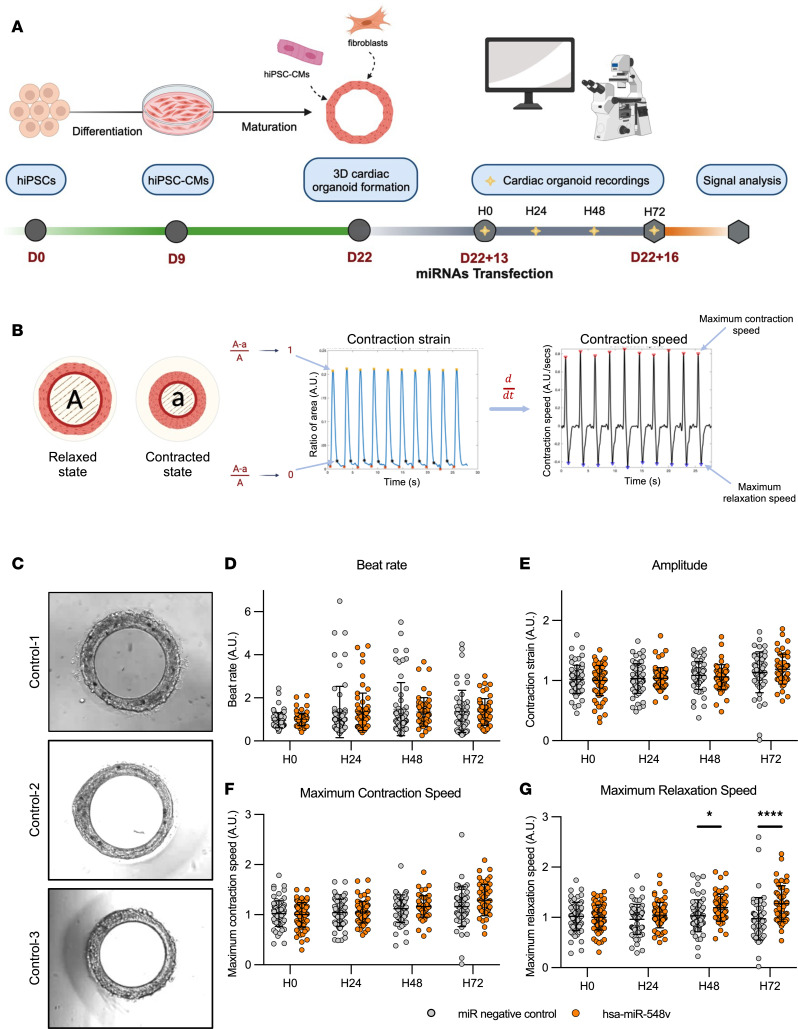
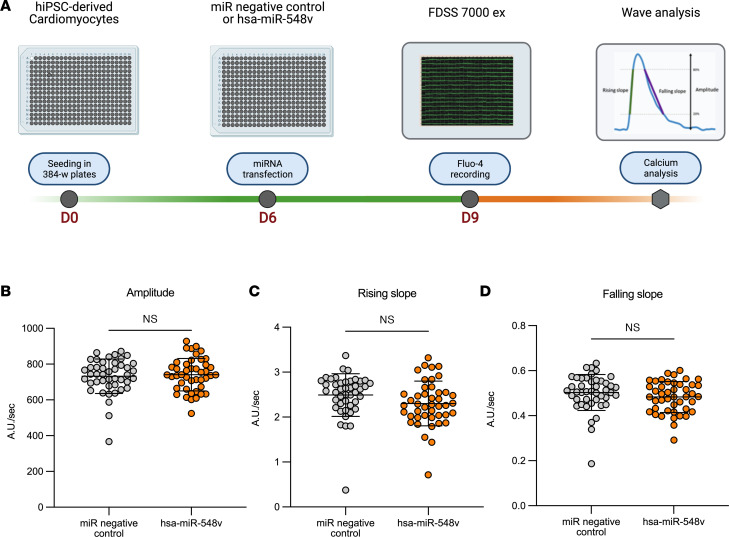
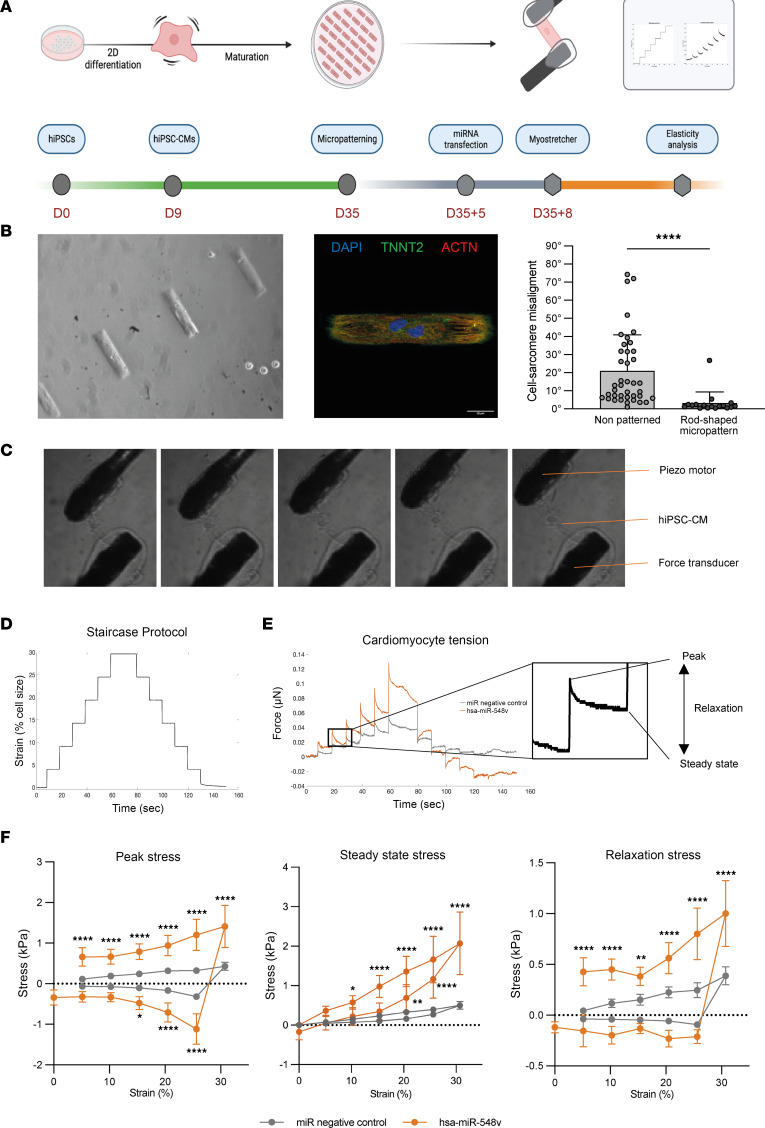
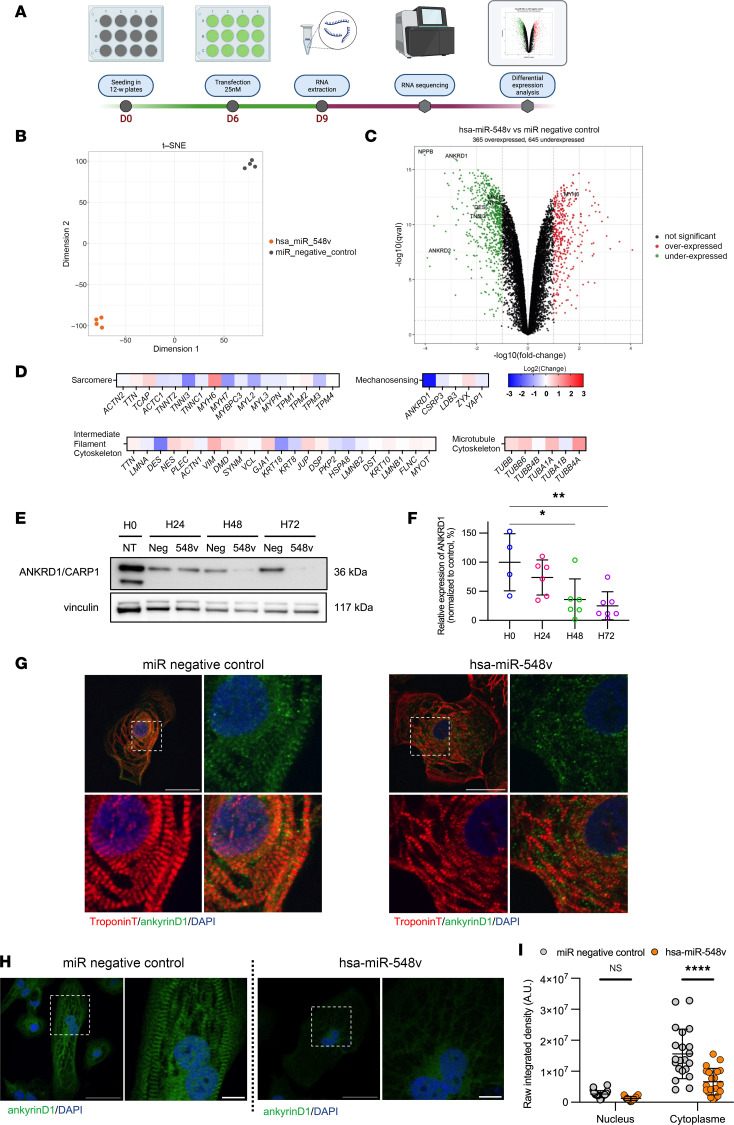
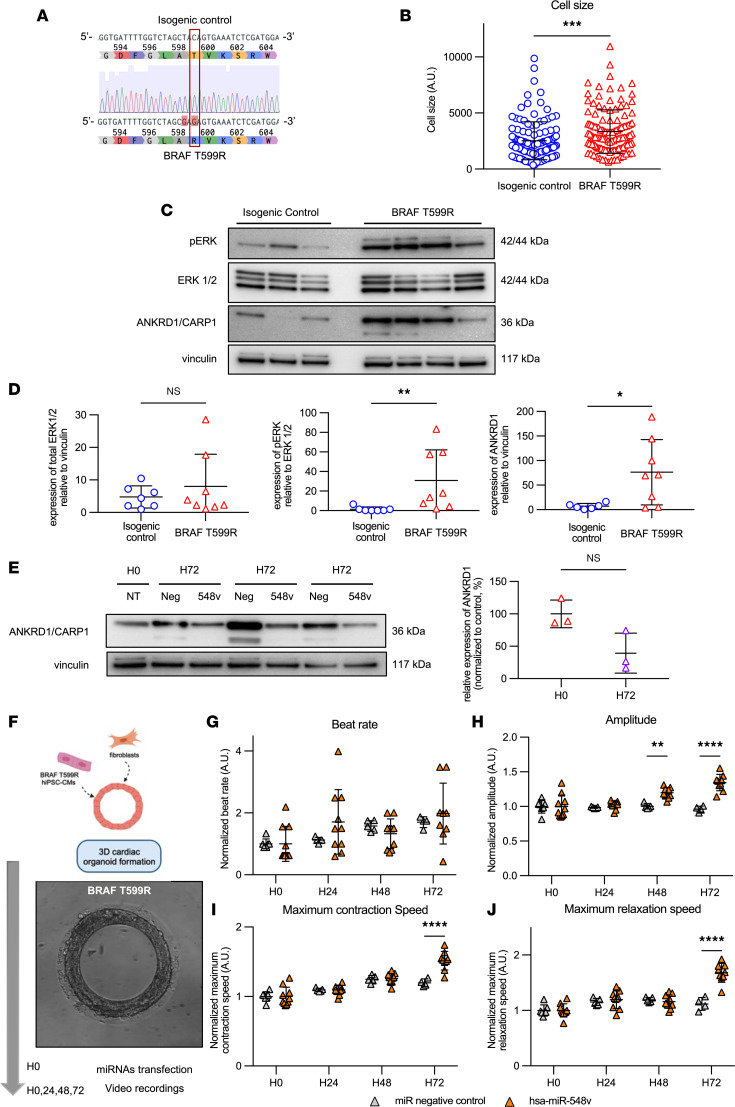
The impairment of left ventricular (LV) diastolic function with an inadequate increase in myocardial relaxation velocity directly results in lower LV compliance, increased LV filling pressures, and heart failure symptoms. The development of agents facilitating the relaxation of human cardiomyocytes requires a better understanding of the underlying regulatory mechanisms. We performed a high-content microscopy-based screening in human induced pluripotent stem cell-derived cardiomyocytes (hiPSC-CMs) using a library of 2,565 human miRNA mimics and measured relaxation kinetics via high-computing analyses of motion movies. We identified hsa-miR-548v, a primate-specific miRNA, as the miRNA producing the largest increase in relaxation velocities. This positive lusitropic effect was reproduced in engineered cardiac tissues generated with healthy and BRAF T599R mutant hiPSC-CMs and was independent of changes in calcium transients. Consistent with improvements in viscoelastic responses to mechanical stretch, RNA-Seq showed that hsa-miR-548v downregulated multiple targets, especially components of the mechanosensing machinery. The exogenous administration of hsa-miR-548v in hiPSC-CMs notably resulted in a significant reduction of ANKRD1/CARP1 expression and localization at the sarcomeric I-band. This study suggests that the sarcomere I-band is a critical control center regulating the ability of cardiomyocytes to relax and is a target for improving relaxation and diastolic dysfunction.

Keywords: Cardiology; Heart failure; Stem cells; iPS cells.


Conflict of interest statement

Conflict of interest: JSH reports research grants from Sanofi, Servier, and Pliant Therapeutics; reports being a speaker, being on the advisory board, and receiving consultancy fees from Alnylam, Amgen, Astra Zeneca, Bayer, Boerhinger Ingelheim, Novartis, Novo-Nordisk, and Vifor Pharma.

Figures

Figure 1
Figure 1. High-content screening identified miRNAs accelerating the relaxation phase of cardiomyocytes.
(A) Screening workflow. The green line indicates the culture and transfection phase until microscope video recordings. The orange line indicates the postprocessing of videos to acquire and analyze motion parameters. (B) Signal analysis. Representative example of beat-to-beat motion signal analysis (left) and derivation of velocities from the integration of signal overtime (right). (C) miRNA Hits sorted by ascending Z score. Green dots indicate the 10 miRNAs with Z score ≥ 2 in at least 2 independent replicates. (D) Individual Z scores of miRNA hits in at least 2 independent replicates (Z score ≥ 2, P < 0.05) and miRNA negative control. (E) Mean relaxation velocity, maximum relaxation velocity, mean contraction velocity, and peak amplitude of motion in hiPSC-derived cardiomyocytes transfected with hsa-miR-548v or miRNA negative control. (F) Representative records of beat-to-beat motion (left) and averaged contraction/relaxation cycle (right) recorded from cardiomyocytes transfected with hsa-miR-548v (orange) or miRNA negative control (gray).
Figure 2
Figure 2. Generation and transfection of control cardiac organoids with hsa-miR-548v leads to increase relaxation rates.
(A) Schematic overview of the cardiac differentiation and cardiac organoid generation protocol. Cardiac organoids were transfected and recorded after 2 weeks of culture in calcium enriched medium. miRNA transfection was performed 13 days after the generation of cardiac organoids, and movies were recorded daily up to hour 72 (H72)after transfection. (B) Schematic of representative graphs obtained after image analysis of the motion movies. (C) Representative bright-field images of tissues obtained from the 3 different control hiPS cell lines: Control-1, Control-2, and Control-3. (DG) Beat rate (D), amplitude (E), maximum contraction speed (F), and maximum relaxation speed (G) of tissues measured at H0, H24, H48, and H72 after transfection. Control-1 (miR Neg, n = 22; hsa-miR-548v, n = 24) from 5 independent experiments each; Control-2 (miR Neg, n = 28; hsa-miR-548v, n = 31) from 3 independent experiments each, and Control-3 (miR Neg, n = 19; hsa-miR-548v, n = 15) from 2 independent experiments each. Values are given as mean ± SD. *P < 0.05, ****P < 0.0001 from Šídák post hoc comparisons between treatment groups, 2-way ANOVA.
Figure 3
Figure 3. hsa-miR-548v does not affect calcium handling in hiPSC-CMs.
(A) Assessment of calcium transients’ workflow. The green line represents hiPSC-CMs preparation, miRNA transfection, and loading with Fluo-4 to calcium transients recording (with FDSS). The orange line represents post-recording analysis (BD) Amplitude, rising slope, and falling slope of the calcium transient measured in hiPSC-CM 3 days after transfection with hsa-miR-548v (n = 44) or miRNA negative control (n = 44). Student’s t test.
Figure 4
Figure 4. hsa-miR-548v modifies viscoelastic properties of cardiomyocyte in response to stretching.
(A) Single-cell hiPSC-CM mechanical properties study protocol. The green line indicates the cells preparation up to culture on micropatterned rod-shape substrate. The gray line shows the miRNA transfection and MyoStretcher attachment and recordings. The orange line indicated the postprocessing of recordings. (B) Typical rod-shaped hiPSC-CM obtained on micropatterned culture plates. Optical image of micropatterned cells (objective, ×20) (left), and immunofluorescence images of a micropatterned cell expressing actin and TroponinT2 (Objective, ×63) (middle); sarcomere score alignment in nonpatterned (n = 40) versus rod-shape micropatterned hiPSC-CM (n = 17) (right). ****P < 0.0001. Mann-Whitney U test. (C) Typical images of different stretch increments of hiPSC-CM. (D) Staircase protocol; each increment represents a strain of 6 μm (5% stretch). (E) Force measurements at different stretch levels and derived parameters. (F) Mechanical response of hiPSC-CMs transfected with hsa-miR-548v (orange, n = 6) and miRNA negative control (gray, n = 8) to different stretch levels.Peak stress (viscous and elastic stress); steady state stress (elastic stress); relaxation stress (viscous response). *P < 0.05, **P = 0.0067, ****P < 0.0001. Two-way ANOVA with Šídák post hoc comparisons.
Figure 5
Figure 5. Transcriptomics analysis reveals downregulation of ankyrin repeat domain 1 protein in hiPSC-CMs transfected with hsa-miR-548v.
(A) Schematic overview of RNA-sequencing experiment. (B) t-SNE plot of RNA sequencing data based on the 1000 most variant genes from hiPSC-CM transfected with hsa-miR-548v (orange, n = 4) or negative miRNA negative control (gray, n = 4). (C) Volcano plot of downregulated (green) and upregulated (red) genes in hiPSC-CMs transfected with hsa-miR 548v or miRNA negative control. NPPA: Natriuretic peptide A; NPPB: Natriuretic peptide B; ANKRD1: cardiac ankyrin protein 1; ANKRD2: cardiac ankyrin protein 2; DES: Desmin; TNNI3: Troponin I3, Cardiac; MYH6: alpha cardiac myosin heavy chain; MYH7: beta cardiac myosin heavy chain. (D) Log2-Fold change in expression of sarcomere components, mechano-sensing proteins, intermediate filament components and microtubules. (E) Representative western blot showing ankyrin repeat domain 1 protein (CARP1) expression in control cells before transfection (H0), and 24, 48 and 72 hours after transfection with miRNA negative control or with hsa-miR-548v. (F) Relative level of ankyrin repeat domain 1 protein expression normalized to the basal expression before transfection (n = 4) and expressed as ratio between hsa-miR-548v treated cells/miRNA negative control–treated cells at 24 hours (n = 6), 48 hours (n = 6), and 72 hours (n = 7) after transfection. *P < 0.05, **P < 0.01, ordinary 1-way ANOVA. (G) Representative images of control CM-hiPSCs transfected with miRNA negative control or hsa-miR-548v 72 hours after transfection, stained for troponinT (red) and ankyrin D1 (green) as well as DAPI (blue). Scale bar: 50 μm. (H) Representative images of control CM-hiPSCs transfected with miRNA negative control or hsa-miR-548v 72 hours after -transfection, stained for ankyrin D1 (green) and DAPI (blue). Scale bar: 50 μm. (I) Quantification of raw integrated density of ankydrin D1 protein expression in the nucleus and in the cytoplasm in hiPSC-CMs 72 hours after transfection with hsa-miR-548v or miRNA negative control.
Figure 6
Figure 6. Effect on hsa-miR-548V on BRAF T599R mutated hiPSC-CMs.
(A) Sequence alignment showing the BRAF 1796C>G nucleotide substitution leading to the nonsense T599R mutation (red square). Of note, the 1794T>G silent variant was introduced for the CRISPR/Cas9 processing. (B) Comparison of hiPSC-CMs between isogenic control (n = 124, 5 independent experiments) and BRAF T599R (n = 127, 6 independent experiments) cell lines. ***P = 0.0004, unpaired t test. (C) Representative Western blot for ERK phosphorylation (pERK) and ankyrin repeat domain 1 protein (CARP1) expression on hiPSC-CMs from BRAF T599R and its isogenic control. Vinculin was used as a loading control. (D) Quantification of total ERK1/2 normalized to vinculin (left) and quantification of pERK relative to ERK1/2 expression level (middle) in BRAF T599R (n = 8) cells and the isogenic control (n = 7). **P = 0.0012, Mann-Whitney U test. Quantification of ankyrin D1 level expression (right) in BRAF T599R (n = 8) and the isogenic control (n = 6) *P < 0.05, Mann-Whitney U test. (E) Western blot for ankyrin repeat domain 1 protein on BRAF T599R cells (n = 3) 72 hours after transfection with miRNA negative control or hsa-miR-548v. Quantification of ANKRD1 relative level expression in BRAF T599R cells 72 hours after transfection, normalized to the basal expression before transfection, and expressed as ratio between hsa-miR-548v treated cells/miRNA negative control–treated cells. P = 0.10, Mann-Whitney U test. (F) Schematic overview of hECT generation and representative bright-field image of tissues obtained using the BRAF mutant hiPSC-CMs. (GJ) Beat rate (G), amplitude (H), maximum contraction speed (I), and maximum relaxation speed (J) of BRAF T599R engineered cardiac tissues at 0, 24, 48, and 72 hours after transfection with miRNA negative control (n = 7) or hsa-miR-548v (n = 10), from 1 differentiation. **P < 0.01, ****P < 0.0001 from Šídák post hoc comparisons between treatment groups, 2-way ANOVA.

Similar articles

Cited by

References

    1. Seko Y, et al. Association of the low e’ and high E/e’ with long-term outcomes in patients with normal ejection fraction: a hospital population-based observational cohort study. BMJ Open. 2019;9(11):e032663. doi: 10.1136/bmjopen-2019-032663. - DOI - PMC - PubMed
    1. Borlaug BA, et al. Diastolic relaxation and compliance reserve during dynamic exercise in heart failure with preserved ejection fraction. Heart. 2011;97(12):964–969. doi: 10.1136/hrt.2010.212787. - DOI - PMC - PubMed
    1. Poliner LR, et al. Left ventricular performance in normal subjects: a comparison of the responses to exercise in the upright and supine positions. Circulation. 1980;62(3):528–534. doi: 10.1161/01.CIR.62.3.528. - DOI - PubMed
    1. Cheng CP, et al. Mechanism of augmented rate of left ventricular filling during exercise. Circ Res. 1992;70(1):9–19. doi: 10.1161/01.RES.70.1.9. - DOI - PubMed
    1. Phan TT, et al. Heart failure with preserved ejection fraction is characterized by dynamic impairment of active relaxation and contraction of the left ventricle on exercise and associated with myocardial energy deficiency. J Am Coll Cardiol. 2009;54(5):402–409. doi: 10.1016/j.jacc.2009.05.012. - DOI - PubMed

Publication types