

Levels of BDNF and NGF in adolescent rat hippocampus neonatally exposed to methamphetamine along with environmental alterations
- PMID: 38165760
- PMCID: PMC10861250
- DOI: 10.33549/physiolres.935216
Levels of BDNF and NGF in adolescent rat hippocampus neonatally exposed to methamphetamine along with environmental alterations
Abstract
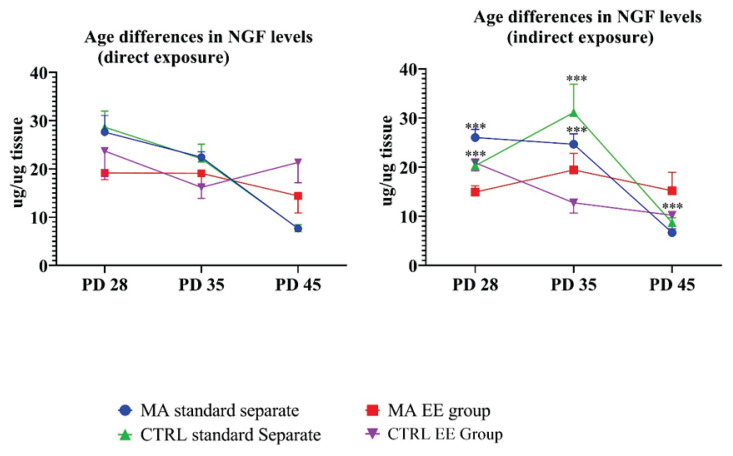
Neurotrophins are proteins included in development and functioning of various processed in mammalian organisms. They are important in early development but as well as during adulthood. Brain - derived neurotrophic factor (BDNF) and nerve growth factor (NGF) have been previously linked with many psychiatric disorders such as depression and addiction. Since during postnatal development, brain undergoes various functional and anatomical changes, we included preweaning environment enrichment (EE), since enrichment has been linked with improved function and development of the several brain structure such as hippocampus (HP), in which we monitored these changes. On the other hand, social isolation has been linked with depression and anxiety-like behavior, therefore postweaning social isolation has been added to this model as well and animal were exposed to this condition till adolescence. We examined if all these three factors had impact on BDNF and NGF levels during three phases of adolescence - postnatal days (PDs) 28, 35 and 45. Our results show that EE did not increase BDNF levels neither in control or MA exposed animals and these results are similar for both direct and indirect exposure. On the other side, social separation after weaning did reduce BDNF levels in comparison to standard housing animals but this effect was reversed by direct MA exposure. In terms of NGF, EE environment increased its levels only in indirectly exposed controls and MA animals during late adolescence. On the other hand, social separation increased NGF levels in majority of animals.
Conflict of interest statement
Figures


Similar articles
-
Increased concentrations of nerve growth factor and brain-derived neurotrophic factor in the rat cerebellum after exposure to environmental enrichment.Cerebellum. 2009 Dec;8(4):499-506. doi: 10.1007/s12311-009-0129-1. Epub 2009 Aug 19. Cerebellum. 2009. PMID: 19688409
-
Prenatal omega 3 fatty acid supplementation to a micronutrient imbalanced diet protects brain neurotrophins in both the cortex and hippocampus in the adult rat offspring.Metabolism. 2013 Nov;62(11):1607-22. doi: 10.1016/j.metabol.2013.06.002. Epub 2013 Jul 9. Metabolism. 2013. PMID: 23845215
-
Effects of repeated minimal electroshock seizures on NGF, BDNF and FGF-2 protein in the rat brain during postnatal development.Int J Dev Neurosci. 2010 May;28(3):227-32. doi: 10.1016/j.ijdevneu.2010.02.003. Epub 2010 Feb 17. Int J Dev Neurosci. 2010. PMID: 20170723 Free PMC article.
-
Direct and indirect evidences of BDNF and NGF as key modulators in depression: role of antidepressants treatment.Int J Neurosci. 2019 Mar;129(3):283-296. doi: 10.1080/00207454.2018.1527328. Epub 2018 Nov 27. Int J Neurosci. 2019. PMID: 30235967 Review.
-
Neurotrophic factors and CNS disorders: findings in rodent models of depression and schizophrenia.Prog Brain Res. 2004;146:151-65. doi: 10.1016/s0079-6123(03)46011-1. Prog Brain Res. 2004. PMID: 14699963 Review.
References
-
- Levi-Montalcini R. The saga of the nerve growth factor. Neuroreport. 1998;9:R71–R83. - PubMed
MeSH terms
Substances
LinkOut - more resources
Full Text Sources
Medical
Research Materials
Miscellaneous