. 2024 Jan 9;121(2):e2313326120.
doi: 10.1073/pnas.2313326120. Epub 2024 Jan 2.

Multiscale spatial mapping of cell populations across anatomical sites in healthy human skin and basal cell carcinoma

Affiliations

Multiscale spatial mapping of cell populations across anatomical sites in healthy human skin and basal cell carcinoma

Clarisse Ganier et al. Proc Natl Acad Sci U S A. .

Abstract

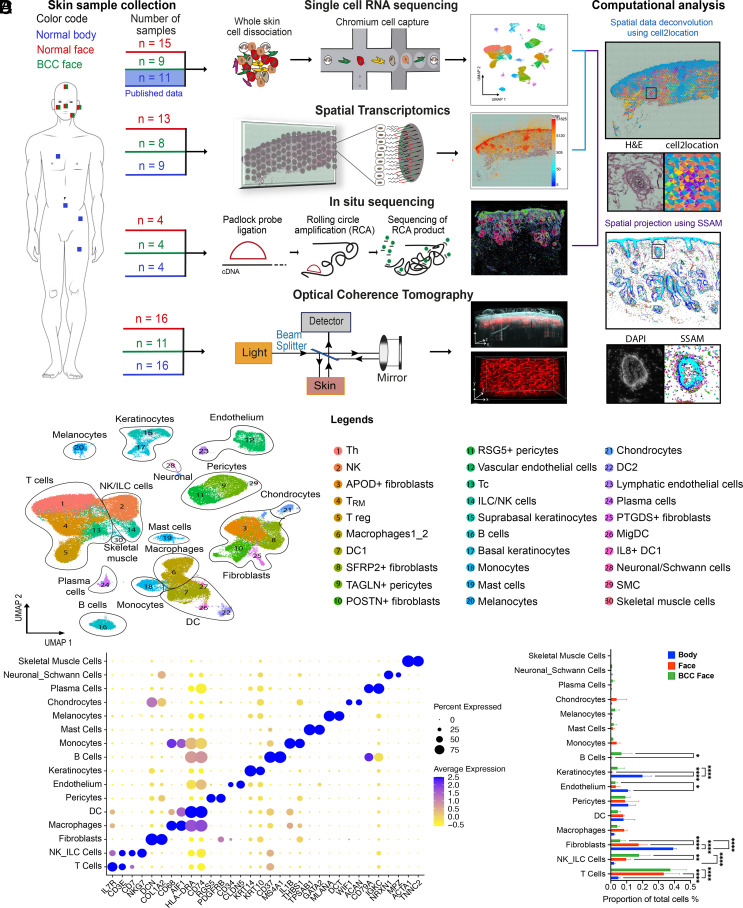
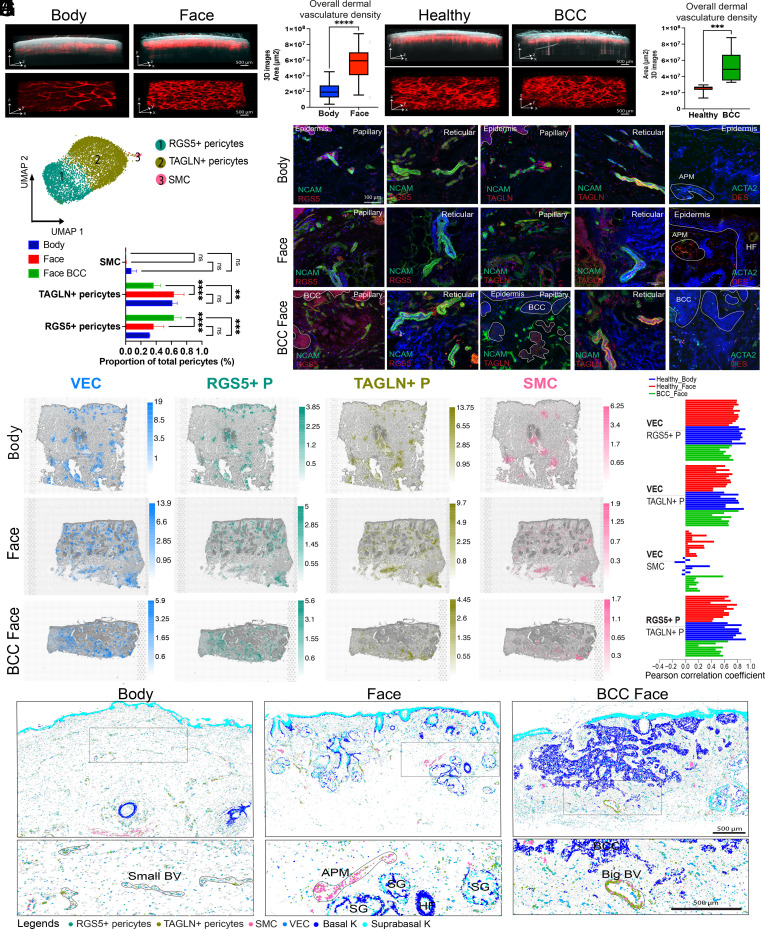
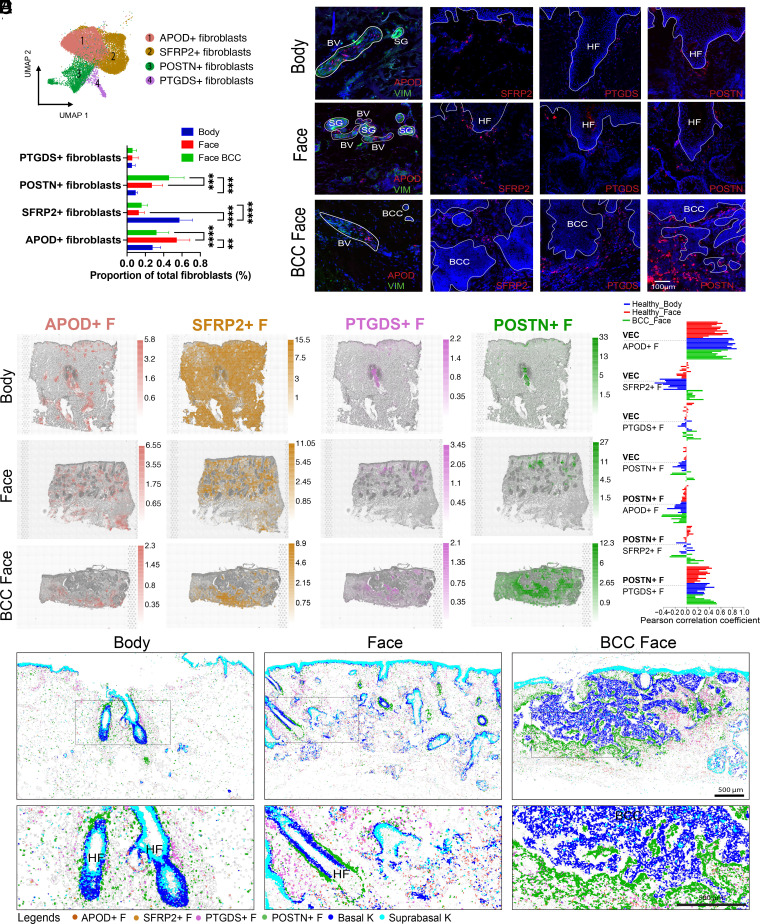
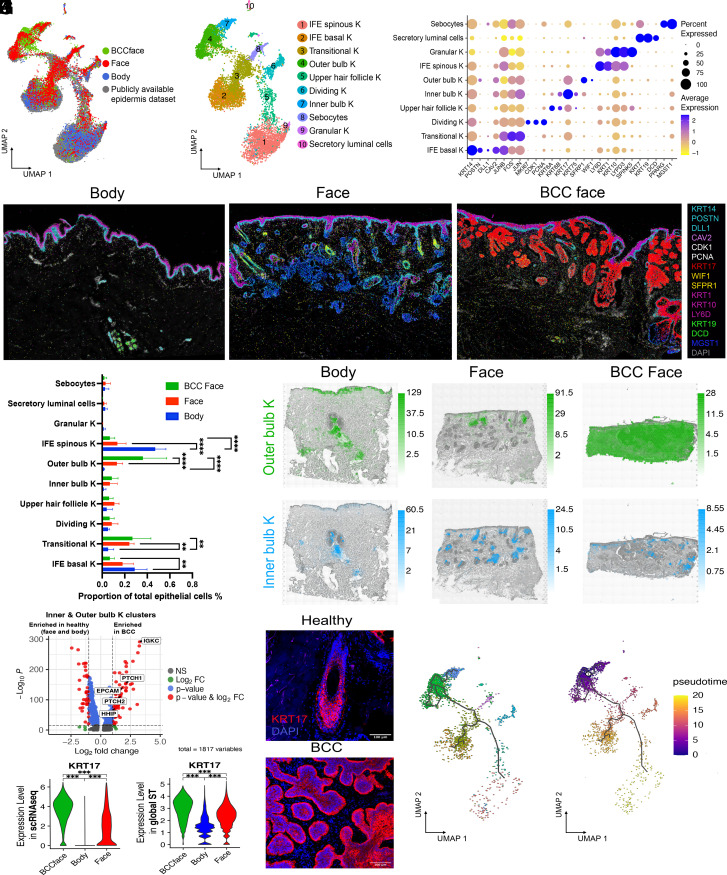
Our understanding of how human skin cells differ according to anatomical site and tumour formation is limited. To address this, we have created a multiscale spatial atlas of healthy skin and basal cell carcinoma (BCC), incorporating in vivo optical coherence tomography, single-cell RNA sequencing, spatial global transcriptional profiling, and in situ sequencing. Computational spatial deconvolution and projection revealed the localisation of distinct cell populations to specific tissue contexts. Although cell populations were conserved between healthy anatomical sites and in BCC, mesenchymal cell populations including fibroblasts and pericytes retained signatures of developmental origin. Spatial profiling and in silico lineage tracing support a hair follicle origin for BCC and demonstrate that cancer-associated fibroblasts are an expansion of a POSTN+ subpopulation associated with hair follicles in healthy skin. RGS5+ pericytes are also expanded in BCC suggesting a role in vascular remodelling. We propose that the identity of mesenchymal cell populations is regulated by signals emanating from adjacent structures and that these signals are repurposed to promote the expansion of skin cancer stroma. The resource we have created is publicly available in an interactive format for the research community.

Keywords: basal cell carcinoma; fibroblasts; human cell atlas; single cell RNA sequencing; skin.


Conflict of interest statement

Competing interests statement:In the last 3 y, S.A.T. has been a remunerated Scientific Advisory Board member for GlaxoSmithKline, Qiagen, Foresite Labs, and is a co-founder and equity holder of TransitionBio. F.M.W. and M.D.L. are co-founders of Fibrodyne. F.M.W. and M.D.L. have filed two patents related to skin fibroblasts.

Figures

Fig. 1.
Fig. 1.
Cartography of a multiscale human skin atlas across anatomical sites and cancer. (A) ScRNAseq was performed for skin samples derived from multiple facial sites and compared with previously published scRNAseq of body sites. We also profiled skin samples from these conditions with global ST which permitted us to examine the global transcriptional profile at 55 μm resolution; ISS which mapped skin at subcellular resolution with a custom panel of 165 genes (SI Appendix, Tables S2–S4) designed to represent all the cellular populations present in human skin; and OCT imaging which permitted us to assess the morphology of the skin at 10 μm resolution in vivo. The number of samples for each modality is indicated. The location and identity of cells were inferred probabilistically in the global ST data and in the ISS data according to our annotated scRNA-seq dataset through computational analyses. (B) Uniform Manifold Approximation and Projection (UMAP) and clustering of 155,401 cells from 33 donors (11 healthy body sites, 14 healthy face sites, and 8 BCC patients) representing 30 skin cell populations and 16 cell types. Each cell is represented by a single point with the two-dimensional location of this point on the UMAP plot corresponding to the global transcriptional state of the cell. Cells with similar transcriptional profiles form clusters. (C) Dot plot showing well-known marker genes specific to each skin cell type. For each cell type, the percentage of cells expressing the marker (diameter) and the average log2 normalized expression (color) are shown. (D) Abundance of skin cell types in healthy face and body areas and in BCC from the face. The relative proportion of sequenced cells assigned to each cellular population is illustrated for body, face, and BCC face. Significant differences (one-way ANOVA test) are indicated (*<0.05, **<0.01, and ****<0.0001).
Fig. 2.
Fig. 2.
Healthy morphology of cutaneous vasculature and localisation of vascular cell populations and their alterations in the stroma of BCC. (A) 3D morphology of vascular networks is compared for representative OCT scans of facial and body skin from the same individuals. OCT images (500 frames) illustrate reflectivity (grayscale) overlaid with the blood flow (red) (Upper). The skin vasculature network is also shown as a 3D computational reconstruction (Lower). Image size 6 mm × 6 mm; (scale bar: 500 μm.) (B) Quantification of skin vascular density across facial and body sites from the same individuals. Vascular density was quantified for a total of six sites (3 facial sites and 3 body sites) across 16 individuals. Statistically significant differences (one-way ANOVA test) are indicated (****<0.0001). (C) Comparison of vascular architecture in healthy skin areas and BCC sites from the same patients. Image size 6 mm × 6 mm (scale bar: 500 μm). (D) Quantification of skin vascular density in healthy and BCC sites from the same patients. Vascular density was quantified for a total of three facial sites across 11 individuals. Statistically significant differences (one-way ANOVA test) are indicated (***<0.001). (E) UMAP plot of pericytes (RGS5+ pericytes, TAGLN+ pericytes), SMC, and VEC subpopulations present in healthy skin (face and body) and BCC. (F) Comparison of the abundance of different pericyte subpopulations (as a proportion of total pericytes) in healthy facial and body skin and BCC. Statistically significant differences (one-way ANOVA test) are indicated (ns, not significant, **<0.01, ***<0.001, and ****<0.0001). (G) Immunostaining of NCAM, RGS5, and TAGLN in the papillary and reticular dermis in healthy body and face skin and in BCC. RNAscope imaging of ACTA2 and DES in healthy body and face skin and in BCC (DAPI, blue). (H) VEC and pericyte cell populations annotated in scRNAseq data were computationally predicted on global ST sections using cell2location. Predicted cell abundances shown by color gradients per spot in tissue architecture (H&E) images (representative samples are shown). (I) Cell cluster colocalization analysis for VEC with RGS5+, TAGLN+ pericytes and SMC. The barplot shows PCC of cell2location predictions per spot normalized cell abundances across all spots of Visium samples (each individual bar represents a Visium sample). (J) Computational spatial mapping of VEC and pericyte subpopulations in ISS sections using SSAM (representative samples are shown). Localization of basal and suprabasal keratinocytes is shown in order to indicate skin structures.
Fig. 3.
Fig. 3.
Localisation of fibroblast populations in healthy human skin and expansion of the POSTN+ subpopulation in the stroma of BCC. (A) UMAP plot of four main fibroblast subpopulations in human healthy skin and BCC (APOD+ fibroblasts; SFRP2+ fibroblasts; POSTN+ fibroblasts; PTGDS+ fibroblasts). (B) Comparison of the abundance of fibroblast subpopulations (proportion of total fibroblasts) between body and facial skin and BCC face. Statistically significant differences (one-way ANOVA test) are indicated (ns, not significant, **<0.01, ***<0.001, and ****<0.0001). (C) RNAscope of specific markers of each fibroblast subpopulation: APOD, SFRP2, PTGDS, POSTN (red), DAPI (blue) and immunostaining of VIM in healthy skin and BCC tissue sections. (D) Fibroblast populations annotated in scRNAseq data were computationally predicted on global ST sections using cell2location. Predicted cell abundances shown by color gradients per spot in tissue architecture (H&E) images (representative samples are shown). (E) Cell cluster colocalization analysis for VEC with APOD+, SFRP2+, PTGDS+ and POSTN+ fibroblasts and POSTN+ fibroblasts with APOD+, SFRP2+, and PTGDS+ fibroblasts. The barplot shows PCC of cell2location predictions per spot normalized cell abundances across all spots of Visium samples (each individual bar represents a Visium sample). (F) Computational spatial mapping of fibroblast subpopulations in ISS sections using SSAM (representative samples are shown). Localization of basal and suprabasal keratinocytes is shown.
Fig. 4.
Fig. 4.
Conservation of epithelial cell populations between normal skin and BCC. (A) UMAP of body, face skin (including IFE and PSU cells), and BCC integrated with a publicly available healthy scalp skin dataset. (B) Unsupervised clustering identified a total of 10 clusters. (C) Dot plot showing average log2 normalized expression of specific marker genes for each epithelial subpopulation. (D) Spatial localisation of ISS reads for the different epithelial subpopulations in ISS images from representative healthy body, face, and BCC face samples (DAPI, gray). KRT14, POSTN, DLL1 represented the IFE basal K; Dividing K coexpressed CDK1 and PCNA; KRT17 was a marker of the inner bulb cluster. SFRP1; WIF1 marked the outer HF bulb. KRT1, KRT10, and LY6D marked spinous IFE keratinocytes; KRT19 and DCD marked sweat glands; MGST1 marked sebaceous glands. Markers such as FOS, JUN or KRT6A and KRT6B, highly expressed by transitional K and upper HF K, were not included in our ISS gene panel. (E) Comparison of the abundance of the epithelial subpopulations in body, facial skin, and BCC. Statistically significant differences (one-way ANOVA test) are indicated (**<0.01 and ****<0.0001). (F) Cell2location prediction of keratinocyte populations corresponding to inner and outer bulb clusters. Predicted cell abundances shown by color gradients per spot. Three representative samples are shown. (G) Volcano plot highlighting differential expression of PTCH1/2, HHIP, EPCAM, and IGKC in BCC compared to healthy cells in the inner and outer bulb K clusters. (H) Differential expression of KRT17 in scRNAseq data (Left) and global ST data (Right) between BCC and healthy skin (face and body). Statistically significant differences (one-way ANOVA test) are indicated (***<0.001). (I) Immunostaining of KRT17 in healthy face skin and BCC (DAPI, blue). (J) Single-cell trajectory gene analysis using Monocle 3 showing root nodes in BCC epithelial cells. (K) Monocle pseudotime showing given lineage for each cell based on the distance from the cell of origin in BCC epithelial cells.

References

    1. Crowson A. N., Basal cell carcinoma: Biology, morphology and clinical implications. Mod. Pathol. 19, S127–S147 (2006). - PubMed
    1. Philippeos C., et al. , Spatial and single-cell transcriptional profiling identifies functionally distinct human dermal fibroblast subpopulations. J. Invest. Dermatol. 138, 811–825 (2018). - PMC - PubMed
    1. Le Lièvre C. S., Le Douarin N. M., Mesenchymal derivatives of the neural crest: Analysis of chimaeric quail and chick embryos. J. Embryol. Exp. Morphol. 34, 125–154 (1975). - PubMed
    1. Driskell R. R., Watt F. M., Understanding fibroblast heterogeneity in the skin. Trends Cell Biol. 25, 92–99 (2015). - PubMed
    1. Rognoni E., et al. , Inhibition of β-catenin signalling in dermal fibroblasts enhances hair follicle regeneration during wound healing. Development 143, 2522–2535 (2016). - PMC - PubMed

LinkOut - more resources