. 2024 Jan 9;121(2):e2316104121.
doi: 10.1073/pnas.2316104121. Epub 2024 Jan 2.

A TLR4/TRAF6-dependent signaling pathway mediates NCoR coactivator complex formation for inflammatory gene activation

Affiliations

A TLR4/TRAF6-dependent signaling pathway mediates NCoR coactivator complex formation for inflammatory gene activation

Yohei Abe et al. Proc Natl Acad Sci U S A. .

Abstract

The nuclear receptor corepressor (NCoR) forms a complex with histone deacetylase 3 (HDAC3) that mediates repressive functions of unliganded nuclear receptors and other transcriptional repressors by deacetylation of histone substrates. Recent studies provide evidence that NCoR/HDAC3 complexes can also exert coactivator functions in brown adipocytes by deacetylating and activating PPARγ coactivator 1α (PGC1α) and that signaling via receptor activator of nuclear factor kappa-B (RANK) promotes the formation of a stable NCoR/HDAC3/PGC1β complex that coactivates nuclear factor kappa-B (NFκB)- and activator protein 1 (AP-1)-dependent genes required for osteoclast differentiation. Here, we demonstrate that activation of Toll-like receptor (TLR) 4, but not TLR3, the interleukin 4 (IL4) receptor nor the Type I interferon receptor, also promotes assembly of an NCoR/HDAC3/PGC1β coactivator complex. Receptor-specific utilization of TNF receptor-associated factor 6 (TRAF6) and downstream activation of extracellular signal-regulated kinase 1 (ERK1) and TANK-binding kinase 1 (TBK1) accounts for the common ability of RANK and TLR4 to drive assembly of an NCoR/HDAC3/PGC1β complex in macrophages. ERK1, the p65 component of NFκB, and the p300 histone acetyltransferase (HAT) are also components of the induced complex and are associated with local histone acetylation and transcriptional activation of TLR4-dependent enhancers and promoters. These observations identify a TLR4/TRAF6-dependent signaling pathway that converts NCoR from a corepressor of nuclear receptors to a coactivator of NFκB and AP-1 that may be relevant to functions of NCoR in other developmental and homeostatic processes.

Keywords: NCoR; PGC1β; TLR4; TRAF6; macrophage.


Conflict of interest statement

Competing interests statement:C.K.G. is a cofounder, equity holder and member of the Scientific Advisory Board of Asteroid Therapeutics.

Figures
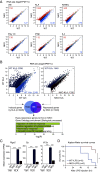
Fig. 1.
Fig. 1.
NCoR-dependent response of macrophages to extracellular signals. (A) Scatter plots of RNA-seq data showing gene expression in bone marrow–derived macrophages (BMDMs) from wild-type (WT) and NCoR KO (NKO) mice in the presence or absence of KLA, RANKL, Poly I:C, IFNβ, or IL4 (blue dots: significantly NKO-suppressed genes, orange dots: significantly NKO-induced genes, FDR < 0.05, FC > 1.5). (B) Scatter plots of RNA-seq data showing KLA-regulated gene expression (Left) and NKO-regulated gene expression in the presence of KLA (Right) (light blue dots in Left panel: significantly KLA-suppressed genes, dark blue dots in Left panel: significantly KLA-induced genes, dark red dots in Right panel: significantly NKO-induced genes, dark blue dots in Right panel: significantly NKO-suppressed genes, FDR < 0.05, FC > 1.5). The overlap between KLA-induced genes (n = 2,296) and NKO-suppressed genes in the presence of KLA (n = 1,448) is shown by the Venn diagram. The significant gene ontology terms associated with the hyporesponsive genes are shown. (C) Bar plots for expression of Ptgs2, Cp, and Il12a in WT and NKO BMDMs treated with or without KLA. The significance symbols indicate statistical significance, ***P-adj < 0.001 reported by DESeq2 using the Benjamini–Hochberg method for the multiple-testing correction. (D) Kaplan–Meier survival curves of WT and NKO mice subjected to 6 mg/kg LPS by intraperitoneal injection. **P < 0.01 calculated using a Mantel–Cox test. Please see also SI Appendix, Fig. S1.
Fig. 2.
Fig. 2.
TLR4 signaling induces recruitment of NCoR/HDAC3 complex to enhancers and promoters. (A) Scatter plot of distal NCoR- (Left) or HDAC3- (Right) associated H3K27ac in WT at Veh vs. WT at KLA. KLA-induced NCoR- or HDAC3-associated H3K27ac peaks (FDR < 0.05, FC > 2) are color-coded (light blue dots: significantly NCoR- or HDAC3-associated lost H3K27ac in WT at KLA, dark blue dots: significantly NCoR- or HDAC3-associated gained H3K27ac in WT at KLA). The overlap between NCoR-associated gained H3K27ac (n = 1,194) and HDAC3-associated gained H3K27ac (n = 1,439) is shown by the Venn diagram. (B) De novo motif enrichment analysis of KLA-induced NCoR and HDAC3-associated gained H3K27ac peaks (n = 779 in Fig. 2A) using a GC-matched genomic background. (C) Genome browser tracks of NCoR, HDAC3, p65, Fosl2, PU.1, and H3K27ac ChIP-seq peaks in the vicinity of the Ptgs2 and Cp loci at Veh and KLA. Yellow shading: KLA-induced peaks. Please see also SI Appendix, Fig. S2.
Fig. 3.
Fig. 3.
HDAC3 activity leads to TLR4-induced H3K27 acetylation. (A) Normalized distribution of H3K27ac tag density in WT and NKO at the vicinity of NCoR and HDAC3-associated gained H3K27ac peaks in WT at KLA (n = 779 in Fig. 2A). (B) Heatmap of differential gene expression (FC > 1.5, P-adj < 0.05) in WT cells treated with the combination of RGFP966 with KLA. (C) The overlap between hyporesponsive genes to KLA in RGFP966 treatment and in NKO (Fig. 1B) is shown by the Venn diagram. The significant gene ontology terms associated with the hyporesponsive genes (n = 81) are shown. (D) Bar plots for expression of Ptgs2, Cp, and Il12a. The significance symbols indicate statistical significance, ***P-adj < 0.001 reported by DESeq2 using the Benjamini–Hochberg method for the multiple-testing correction. (E) Heatmap of differential H3K27ac ChIP-seq IDR peaks associated with ATAC-seq IDR peaks at Veh in a 1,000-bp window (FC > 2, P-adj < 0.05). (F) Normalized distribution of H3K27ac tag density in Veh, KLA, and RGFP966 + KLA conditions at the vicinity of NCoR and HDAC3-associated gained H3K27ac peaks in WT at KLA (n = 779 in Fig. 2A). (G) Genome browser tracks of H3K27ac, NCoR, and HDAC3 ChIP-seq peaks in the vicinity of the Ptgs2 and Cp loci in BMDMs at Veh, KLA, and the combination of RGFP966 with KLA. Yellow shading: KLA-induced/RGFP966-sensitive peaks. (H) Kaplan–Meier survival curves of wild-type mice subjected to 6 mg/kg LPS by intraperitoneal injection with pretreatment of either vehicle control (10% DMSO) or 10 mg/kg RGFP966. *P < 0.05 calculated using a Mantel–Cox test. Please see also SI Appendix, Fig. S3.
Fig. 4.
Fig. 4.
Signal-specific assembly and function of NCoR/HDAC3/PGC1β complexes. (A) Immunoblot (IB) analysis showing acetylated PGC1β and interaction of PGC1β with NCoR/HDAC3 complex. BMDMs were treated with or without each ligand in the presence or absence of RGFP966, and then, the whole-cell lysates were subjected to immunoprecipitation (IP) using anti-PGC1β antibody and IB analysis with antiacetylated lysine, PGC1β, HDAC3, or NCoR antibody. Uncropped images of the blots are shown in SI Appendix, Fig. S7. (B) Bar plots for expression of Ptgs2, Cp, and Il12a in Pgc1bf/f (WT) and Pgc1bf/f LysM-Cre (KO) BMDMs treated with or without KLA. The significance symbols indicate statistical significance, ***P-adj < 0.001 reported by DESeq2 using the Benjamini–Hochberg method for the multiple-testing correction. (C) Genome browser tracks of H3K27ac, PGC1β, NCoR, and HDAC3 ChIP-seq peaks in the vicinity of the Ptgs2 and Acp5 loci. Yellow shading: lost H3K27ac by PGC1β KO at KLA- (Top) or RANKL- (Bottom) induced NCoR, HDAC3 and PGC1β binding regions. (D) De novo motif enrichment analysis of NCoR/HDAC3/PGC1β binding sites gaining H3K27ac peaks under KLA treatment conditions (n = 1,486 in SI Appendix, Fig. S4D) using a GC-matched genomic background. (E) The overlap between KLA- and RANKL-induced NCoR/HDAC3/PGC1β peaks at sites gaining H3K27ac peaks is shown by the Venn diagram. Please see also SI Appendix, Fig. S4.
Fig. 5.
Fig. 5.
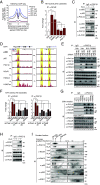
TRAF6-ERK1 signaling is required for PGC1β interaction with NCoR/HDAC3 complex. (A) Normalized distribution of H3K27ac ChIP-seq tag density in Pgc1bf/f (WT) and Pgc1bf/f LysM-Cre (KO) BMDMs at the vicinity of NCoR and HDAC3-associated gained H3K27ac peaks in WT under KLA conditions (n = 779 in Fig. 2A). (B) Histone acetyltransferase (HAT) activity of immunoprecipitated NCoR protein in whole-cell lysates from BMDMs treated with or without each ligand was measured in the presence of acetyl-CoA and histone H3 substrate. Data are mean ± SD (n = 3 biological replicates). Student’s t test was performed for comparisons. **P < 0.01 was considered statistically significant. (C) Immunoblot (IB) analysis showing the interaction of PGC1β with p300 or NFκB-p65 in BMDMs treated with or without KLA. The whole-cell lysates were subjected to immunoprecipitation (IP) using anti-PGC1β antibody and IB analysis with anti-p300, p65, or PGC1β antibody. (D) Genome browser tracks of p300, p65, PGC1β, NCoR, HDAC3, and H3K27ac ChIP-seq peaks in the vicinity of the Ptgs2 and Cp loci in BMDMs at Veh and KLA. Yellow shading: KLA-induced peaks. (E) IB analysis showing acetylated PGC1β and interaction of PGC1β with NCoR/HDAC3. Control or Traf6 siRNA-transduced BMDMs were treated with or without KLA or RANKL, and then, the whole-cell lysates were subjected to IP using anti-PGC1β antibody and IB analysis with antiacetylated lysine, PGC1β, NCoR, or HDAC3 antibody. (F) HAT activity of immunoprecipitated NCoR (Left) or PGC1β (Right) protein in whole-cell lysate from control or Traf6 siRNA-transduced BMDMs treated with or without KLA or RANKL was measured in the presence of acetyl-CoA and histone H3 substrate. Data are mean ± SD (n = 3 biological replicates). ANOVA was performed followed by Tukey’s post hoc comparison. *P < 0.05 and **P < 0.01 were considered statistically significant. (G) IB analysis showing acetylated PGC1β and interaction of PGC1β with NCoR/HDAC3. BMDMs were treated with or without KLA or RANKL in the presence or absence of ERK inhibitor (LY3214996), and then, the whole-cell lysates were subjected to IP using anti-PGC1β antibody and IB analysis with antiacetylated lysine, PGC1β, NCoR, or HDAC3 antibody. (H) IB analysis showing the interaction of PGC1β with ERK1 in BMDMs treated with or without KLA. The whole-cell lysates were subjected to IP using anti-PGC1β antibody and IB analysis with anti-ERK1 or PGC1β antibody. (I) 10 to 30% sucrose density gradient centrifugation was performed on nuclear fractions from BMDMs treated with or without KLA. All fractions (1 to 24, top to bottom) were subjected to IB analysis with anti-PGC1β, NCoR, HDAC3, p65, p300, or ERK1 antibody. The molecular weight standards are indicated at the top of the panel; 66 kDa, bovine serum albumin; 200 kDa, β-amylase; 669 kDa, thyroglobulin. Uncropped images of the blots (C, E, G, H, and I) are shown in SI Appendix, Figs. S7 and S8. Please see also SI Appendix, Fig. S5.
Fig. 6.
Fig. 6.
ERK activity is required for KLA-induced NCoR recruitment to active genes. (A) The overlap between IDR-defined ERK1 ChIP-seq peaks at Veh and KLA is shown by the Venn diagram. (B) De novo motif enrichment analysis of ERK1 peaks under KLA conditions (n = 19,712 in Fig. 6A) using a GC-matched genomic background. (C) The overlap between IDR-defined ERK1, PGC1β, p65, and Fosl2 ChIP-seq peaks under KLA conditions is shown by the Venn diagram. (D) Genome browser tracks of ERK1, p65, Fosl2, PGC1β, NCoR, HDAC3, and H3K27ac ChIP-seq peaks in the vicinity of the Ptgs2 and Cp loci in WT at Veh and KLA. Yellow shading: KLA-induced peaks. (E) Normalized distribution of NCoR (Top) or PGC1β (Bottom) ChIP-seq tag density in BMDMs treated with or without KLA in the presence or absence of ERK inhibitor (LY3214996) at the vicinity of NCoR and HDAC3-associated gained H3K27ac peaks in WT under KLA conditions (n = 779 in Fig. 2A). Please see also SI Appendix, Fig. S6.
Fig. 7.
Fig. 7.
TRAF6-TBK1 cascade accelerates HDAC3-dependent PGC1β deacetylation. (A) HDAC3 deacetylase activity of immunoprecipitated PGC1β (Left) or HDAC3 (Right) protein in whole-cell lysate from BMDMs treated with or without KLA in the presence or absence of TBK1 inhibitor (GSK8612) was measured by the fluorescent signal of the enzymatically cleaved model substrates. Data are mean ± SD (n = 3 biological replicates). ANOVA was performed followed by Tukey’s post hoc comparison. *P < 0.05 and **P < 0.01 were considered statistically significant. (B) Immunoblot (IB) analysis showing acetylated PGC1β, phosphorylated HDAC3, and interaction of PGC1β with NCoR/HDAC3. BMDMs were treated with or without KLA, and then, the whole-cell lysates were subjected to immunoprecipitation (IP) using anti-PGC1β (Left) or HDAC3 (Right) antibody and IB analysis with antiacetylated lysine, phosphorylated HDAC3 (Ser424), PGC1β, NCoR, or HDAC3 antibody. Uncropped images of the blots are shown in SI Appendix, Fig. S9. (C) Bar plots for expression of Ptgs2, Cp, and Il12a in BMDMs treated with or without KLA in the presence or absence of TBK1 inhibitor (GSK8612). The significance symbols indicate statistical significance, ***P-adj < 0.001 reported by DESeq2 using the Benjamini–Hochberg method for the multiple-testing correction. (D) A schematic model. See the Discussion for details.

Similar articles

Cited by

References

    1. Perissi V., Jepsen K., Glass C. K., Rosenfeld M. G., Deconstructing repression: Evolving models of co-repressor action. Nat. Rev. Genet 11, 109–123 (2010). - PubMed
    1. Ferrante F., et al. , HDAC3 functions as a positive regulator in Notch signal transduction. Nucleic Acids Res. 48, 3496–3512 (2020). - PMC - PubMed
    1. Guenther M. G., Barak O., Lazar M. A., The SMRT and N-CoR corepressors are activating cofactors for histone deacetylase 3. Mol. Cell Biol. 21, 6091–6101 (2001). - PMC - PubMed
    1. Mondello P., et al. , Selective inhibition of HDAC3 targets synthetic vulnerabilities and activates immune surveillance in lymphoma. Cancer Discov. 10, 440–459 (2020). - PMC - PubMed
    1. Hu X., Li S., Wu J., Xia C., Lala D. S., Liver X receptors interact with corepressors to regulate gene expression. Mol. Endocrinol. 17, 1019–1026 (2003). - PubMed

MeSH terms