. 2024 Jan 2;19(1):e0295522.
doi: 10.1371/journal.pone.0295522. eCollection 2024.

Role of Influenza A virus protein NS1 in regulating host nuclear body ND10 complex formation and its involvement in establishment of viral pathogenesis

Affiliations

Role of Influenza A virus protein NS1 in regulating host nuclear body ND10 complex formation and its involvement in establishment of viral pathogenesis

Ujjal Das et al. PLoS One. .

Abstract

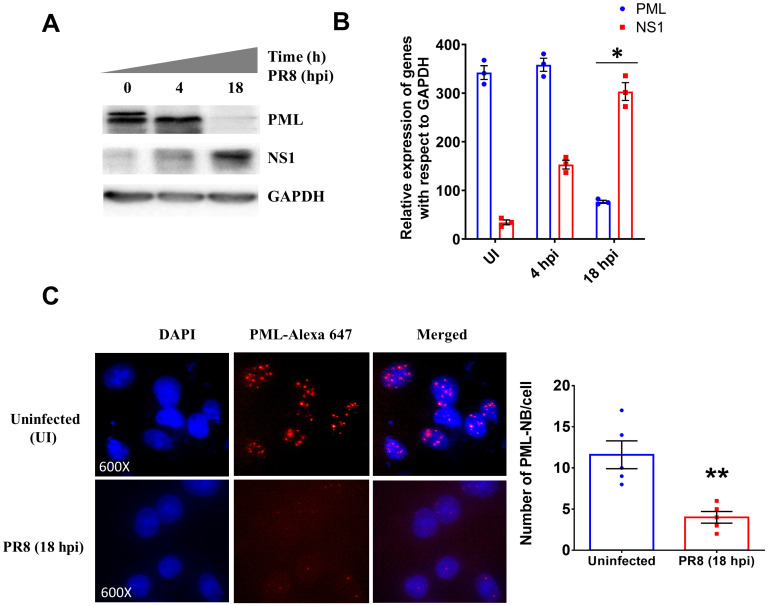
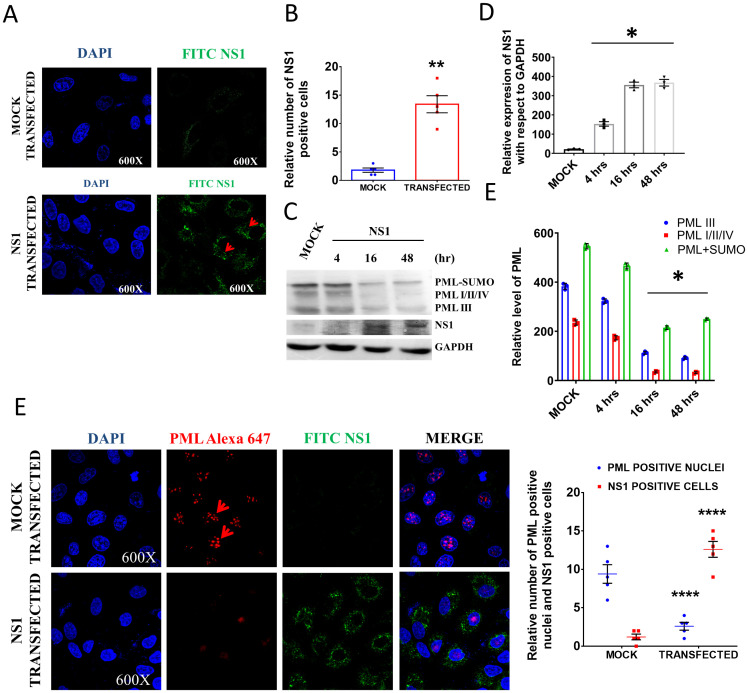
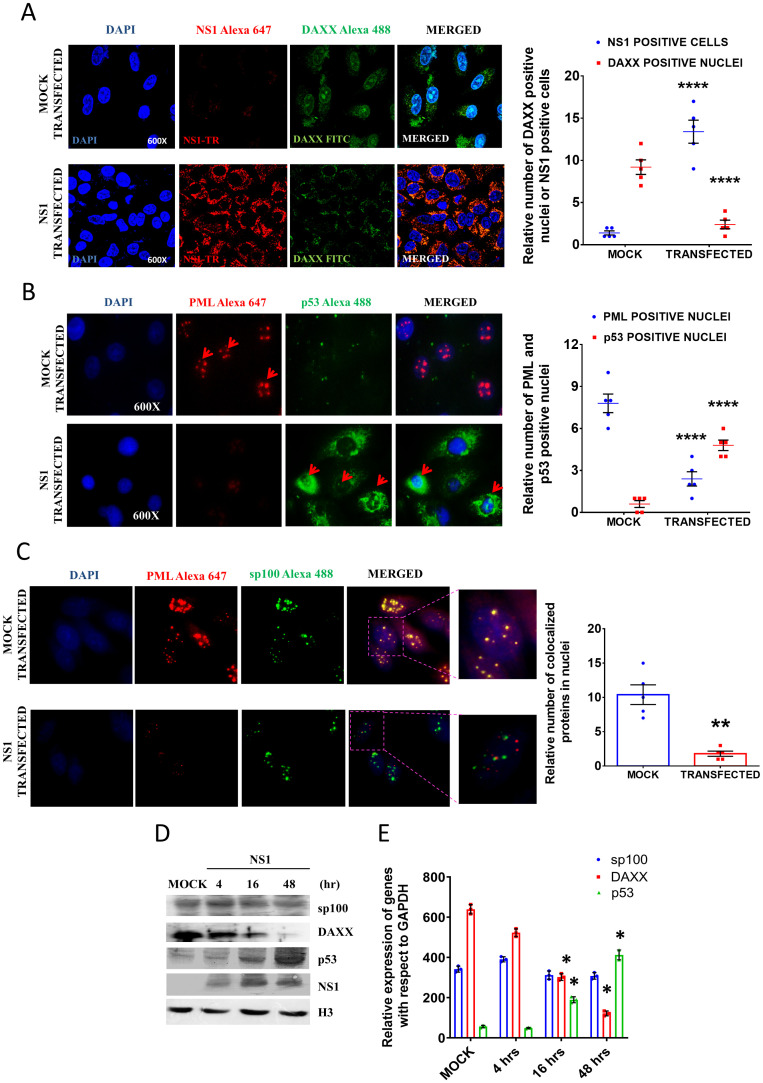
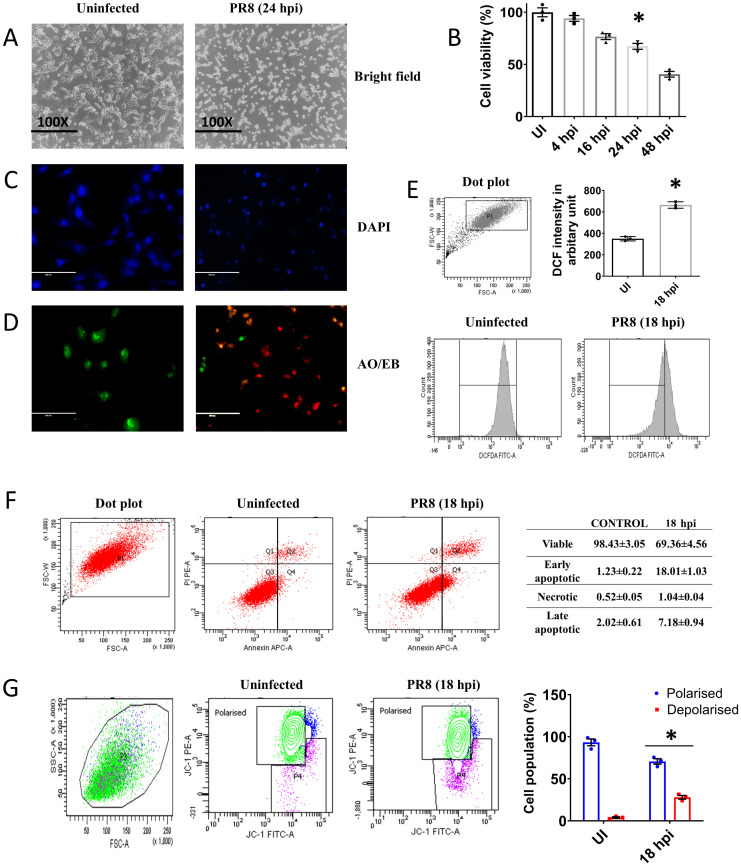
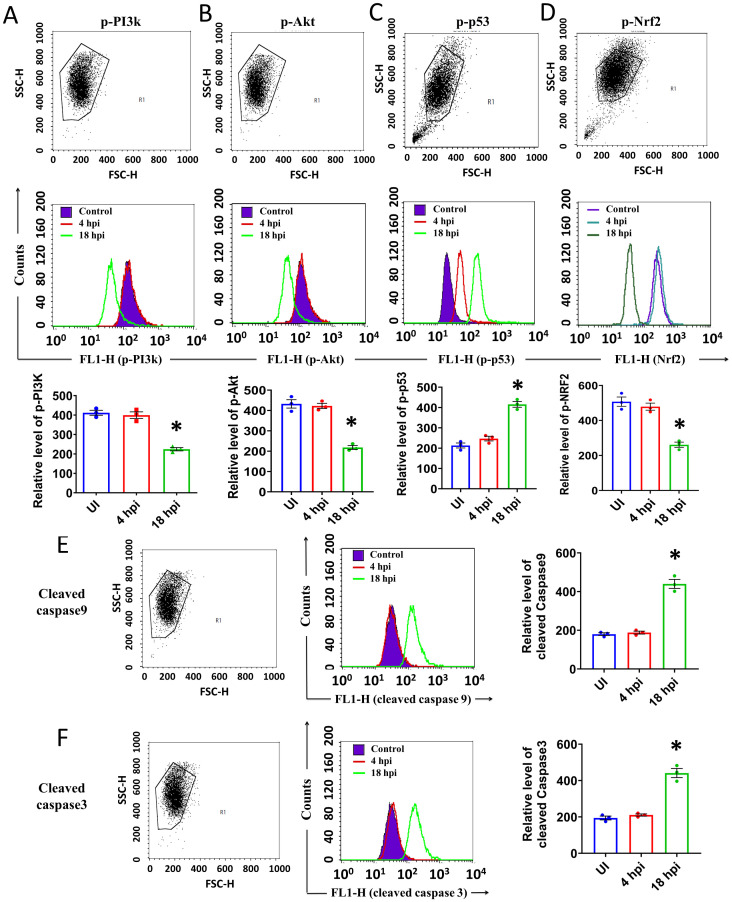
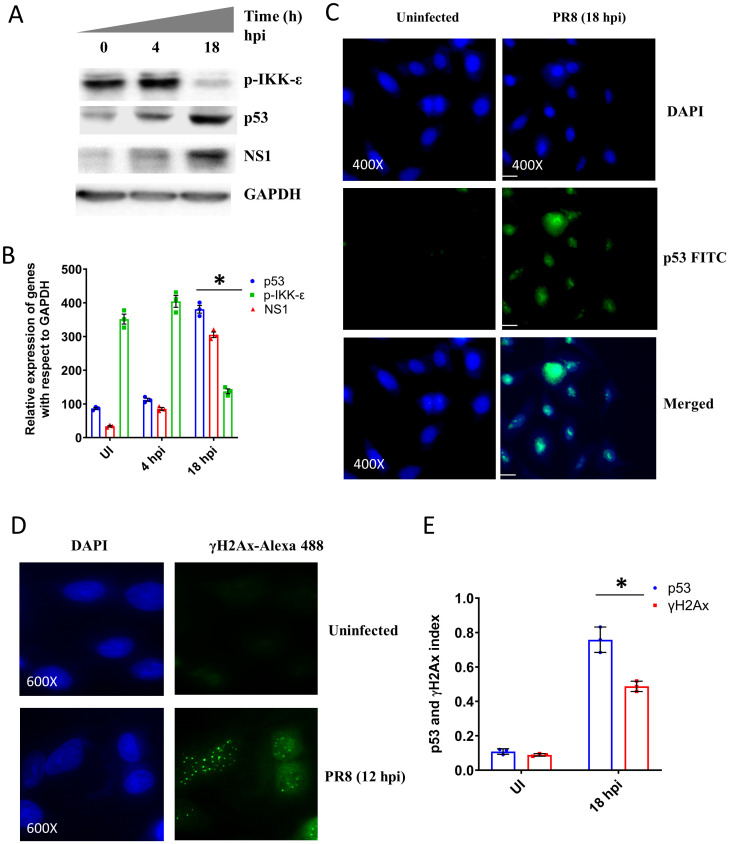
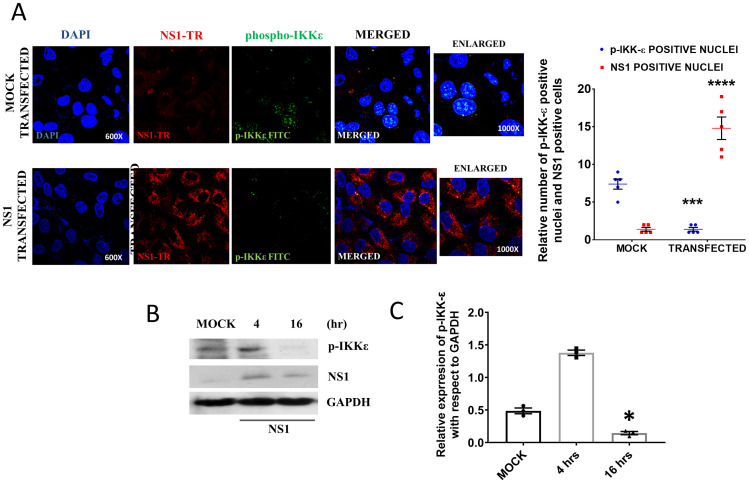
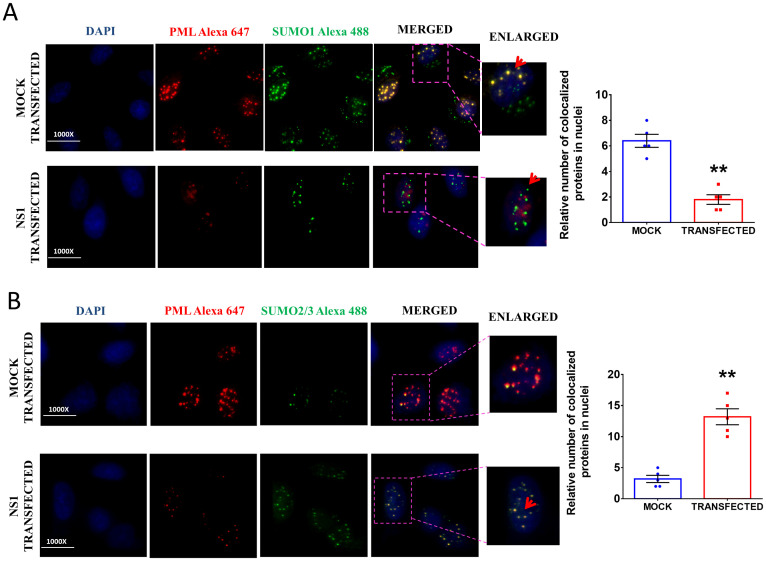
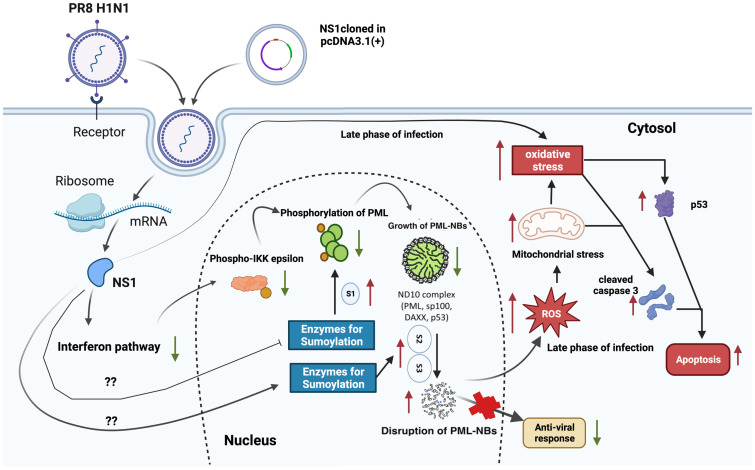
Influenza viral infection is a seasonal infection which causes widespread acute respiratory issues among humans globally. This virus changes its surface receptor composition to escape the recognition process by the host's immune cells. Therefore, the present study focussed to identify some other important viral proteins which have a significant role in establishment of infection and having apparent conserved structural composition. This could facilitate the permanent vaccine development process or help in designing a drug against IAV (influenza A virus) infection which will eliminate the seasonal flu shot vaccination process. The NS1 (Non-structural protein 1) protein of IAV maintains a conserved structural motif. Earlier studies have shown its significant role in infection establishment. However, the mechanism by which viruses escape the host's ND10 antiviral action remains elusive. The present study clearly showed that IAV infection and NS1 transfection in A549 cells degraded the main component of the ND10 anti-viral complex, PML and therefore, inhibited the formation of Daxx-sp100-p53-PML complex (ND10) at the mid phase of infection/transfection. PML degradation activated the stress axis which increased cellular ROS (reactive oxygen species) levels as well as mitochondrial dysfunction. Additionally, IAV/NS1 increased cellular stress and p53 accumulation at the late phase of infection. These collectively activated apoptotic pathway in the host cells. Along with the inactivation of several interferon proteins, IAV was found to decrease p-IKKε. A549 cells transfected with pcDNA3.1-NS1 showed a similar effect in the interferon axis and IKKε. Moreover, NS1 induced the disintegration of the host's ND10 complex through the changes in the SUMOylation pattern of the PML nuclear body. These findings suggest the possible mechanism of how NS1 helps IAV to establish infection in the host cells. However, it demands further detailed study before targeting NS1 to develop permanent vaccines or novel drugs against IAV in future.


Conflict of interest statement

The authors have declared that no competing interests exist.

Figures

Fig 1
Fig 1. Degradation of PML nuclear body structure after IAV infection.
A. The immunoblot images show the expression of different proteins. B. The densitometric analysis of immunoblot data. C. The confocal images show the degradation of the PML nuclear body after IAV infection. Nuclei were stained by DAPI and PML was stained with Alexa-647. D. The bar diagram shows the number of PML-NB/cell in uninfected and infected cells. The values represent the Mean±SEM of five microscopic fields of independent experiment. p < 0.05 was considered as significant. The values were represented as Mean±SEM [(n = 3 for immunoblot) and (n = 5 for microscopic data)]. The significance of differences was calculated between the ‘*’ control vs infection/transfection group.
Fig 2
Fig 2. NS1 transfection degrades PML nuclear body structure.
A. Expression of NS1 after transfection in A549 cells. DAPI was used to stain the nuclei and NS1 was stained by FITC tagged secondary antibody. B. Quantitative analysis of microscopic data represents the relative number of NS1 positive cells after transfection five microscopic fields of independent experiment C. Immunoblot images showed the PML expression at different time points after NS1 transfection. D. The densitometric analysis of immunoblot data. E. The fluorescence image showed the degradation of the PML nuclear body in NS1 transfected A549 cells. Nuclei were stained by DAPI and PML was stained by Alexa-647 (red) tagged secondary antibody. The red dots in the nuclei of mock transfected cells indicate the presence of the PML nuclear body. The bar diagram shows the number of PML-NB/cell in mock and NS1 transfected cells. The values represent the Mean±SEM [(n = 3 for immunoblot) and (n = 5 for microscopic data)]. p < 0.05 was considered as significant. The significance of differences was calculated between the ‘*’ control vs infection/transfection group.
Fig 3
Fig 3. Effect of NS1 transfection on localization of Daxx, p53 and sp100.
A. The confocal images show the subcellular localization of Daxx protein. The nuclei were stained by DAPI and Daxx was stained by Alexa-488 tagged secondary antibody and NS1 was stained by Alexa-647 tagged secondary antibody. The bar diagram represents the number of Daxx positive nuclei in mock and NS1 transfected cells. B. The localization of p53 protein in the PML nuclear body under mock and NS1 transfected conditions. P53 was stained by Alexa-488 tagged secondary antibody and PML was stained by Alexa 647 tagged secondary antibody. The red arrow indicated nuclear localization of p53 and PML. The bar diagram shows the number of PML-NB/cells and p53 positive nuclei in mock and NS1 transfected cells. C. The localization of sp100 protein in the PML nuclear body under mock and NS1 transfected conditions. Sp100 was stained by Alexa-488 tagged secondary antibody and PML was stained by Alexa 647 tagged secondary antibody. The yellow dots in the merged image indicate the co-localization of sp100 protein in the PML nuclear body. The bar diagram shows the number of PML-NB/cells and sp100 colocalized nuclei in mock and NS1 transfected cells. D. The immunoblot images and E. densitometric analysis showed time dependent expression of Daxx, p53 and sp100 proteins (nuclear fraction) in NS1 and mock transfected cells. p < 0.05 was considered as significant. The values were represented as Mean±SEM [(n = 3 for immunoblot) and (n = 5 for microscopic data)].
Fig 4
Fig 4. IAV infection induced apoptosis in A549 cells at later phase of infection.
A. The bright field images show the morphological alteration. B. The bar diagram shows the cell viability at different time points after infection. C. DAPI staining to observe nuclear damage in infected cells. D. AO-EB staining to observe membrane disintegration. E. The histogram plot shows the ROS level and bar diagram indicating the DCF fluorescence intensity in different groups. F. AnnexinV-APC and PI staining. The Q3 quadrant represents viable cell population, Q4 early apoptotic, Q2 late apoptotic and Q1 necrotic. G. JC1 staining to determine MMP. The green population represents the viable cells with no loss of MMP and the purple population stands for the depolarised population with loss of MMP. The values were represented as Mean±SEM (n = 3). p < 0.05 was considered as significant. The significance of differences was calculated between the ‘*’ control vs infection/transfection group.
Fig 5
Fig 5. IAV infection induced apoptosis in A549 cells.
The expression of A p-PI3K, B p-Akt, C p-53, D p-Nrf2, E cleaved caspase9, and F cleaved caspase3 was measured by flowcytometry in uninfected and IAV infected cells. The counts were plotted along the Y axis and the fluorescence intensity was plotted along the X axis. The bar diagrams represent the intensity of fluorescence in the FL1-H channel. The values were represented as Mean±SEM (n = 3). p < 0.05 was considered as significant. The significance of differences was calculated between the ‘*’ control vs infection/transfection group.
Fig 6
Fig 6. The IAV infection increased γ-H2Ax but prevents IKKε activation.
A. The immunoblot images show the phosphorylation and expression of different proteins. B. The densitometric analysis of immunoblot data. C. Immunofluorescence data show nuclear localization of p53 (FITC positive cells) after IAV infection. D. Immunofluorescence data show γ-H2Ax focci after 18 hpi. E. Quantification of immunofluorescence data of C and D. p < 0.05 was considered as significant. The values were represented as Mean±SEM [(n = 3 for immunoblot) and (n = 3 for microscopic data)]. The significance of differences was calculated between the ‘*’ control vs infection/transfection group.
Fig 7
Fig 7. The NS1 overexpression in transfected cells prevents IKKε phosphorylation and nuclear localization.
A. The confocal images show the phosphorylation level of IKKε. The nuclei were stained by DAPI and p-IKKε was stained by FITC tagged secondary antibody and NS1 was stained by Texas red tagged secondary antibody. The bar diagram represents the number of phospho-IKKε positive nuclei in mock and NS1 transfected cells as observed in 5 independent microscopic data B. The immunoblot images showed time dependent levels of p-IKKε and expression of NS1 and transfected cells. C. Densitometric analysis of the p-IKKε immunoblot data. p < 0.05 was considered as significant. The values were represented as Mean±SEM [(n = 3 for immunoblot) and (n = 5 for microscopic data)]. The significance of differences was calculated between the ‘*’ control vs infection/transfection group.
Fig 8
Fig 8. NS1 changes the SUMOylation pattern of PML.
The confocal images show the co-localization of A. PML with SUMO 1. The bar diagram represents the number of PML and SUMO1 colocalized nuclei in mock and NS1 transfected cells as observed in 5 independent microscopic fields. and B. PML with SUMO 2/3 in different groups. The nuclei were stained by DAPI, PML was stained by Alexa 647 and SUMO 1 or SUMO 2/3 was stained by an Alexa 488 tagged secondary antibody. The bar diagram denotes the number of PML and SUMO2/3 colocalized nuclei in mock and NS1 transfected cells as observed in 5 independent microscopic fields. p < 0.05 was considered as significant. The values were represented as Mean±SEM (n = 5).
Fig 9
Fig 9. The schematic representation of overall outcome of the study.
IAV infection/NS1 transfection alters the interferon pathway and IKKε phosphorylation which inhibits PML-NB formation. NS1 also changes the SUMOylation pattern of PML-NB which leads to its degradation. PML-NB degradation increases the oxidative stress through elevated level of ROS at the late phase of infection. On the top of that IAV infection and NS1 transfection both generate cellular stress at late time points and induce oxidative stress. ROS alters the mitochondrial function and activates several stress signalling pathways which at the end activate p53 and caspase 3 to induce apoptosis.

Similar articles

Cited by

References

    1. Centers for Disease Control and Prevention 2010. Estimates of deaths associated with seasonal influenza—United States, 1976–2007. MMWR Morb Mortal Wkly Rep. 2010; 59:1057–1062. - PubMed
    1. Thompson WW, Shay DK, Weintraub E, Brammer L, Bridges CB, Cox NJ, et al.. Influenza-associated hospitalizations in the United States. JAMA 2004; 292:1333–1340. doi: 10.1001/jama.292.11.1333 - DOI - PubMed
    1. Al Hajjar S, McIntosh K. The first influenza pandemic of the 21st century. Ann Saudi Med. 2010;30(1):1–10. doi: 10.4103/0256-4947.59365 - DOI - PMC - PubMed
    1. Hu B, Guo H, Zhou P, Shi ZL. Characteristics of SARS-CoV-2 and COVID-19. Nat Rev Microbiol. 2021;19(3):141–154. doi: 10.1038/s41579-020-00459-7 - DOI - PMC - PubMed
    1. Wong SS, Webby RJ. Traditional and new influenza vaccines. Clin Microbiol Rev. 2013;26(3):476–492. doi: 10.1128/CMR.00097-12 - DOI - PMC - PubMed

MeSH terms