Observational Study
. 2024 Jan 2;21(1):e1004332.
doi: 10.1371/journal.pmed.1004332. eCollection 2024 Jan.

Price negotiation and pricing of anticancer drugs in China: An observational study

Affiliations
Observational Study

Price negotiation and pricing of anticancer drugs in China: An observational study

Jing Zhou et al. PLoS Med. .

Abstract

Background: While China has implemented reimbursement-linked drug price negotiation annually since 2017, emphasizing value-based pricing to achieve a value-based strategic purchase of medical insurance, whether drug prices became better aligned with clinical value after price negotiation has not been sufficiently established. This study aimed to assess the changes in prices and their relationship with the clinical value of anticancer drugs after the implementation of price negotiations in China.

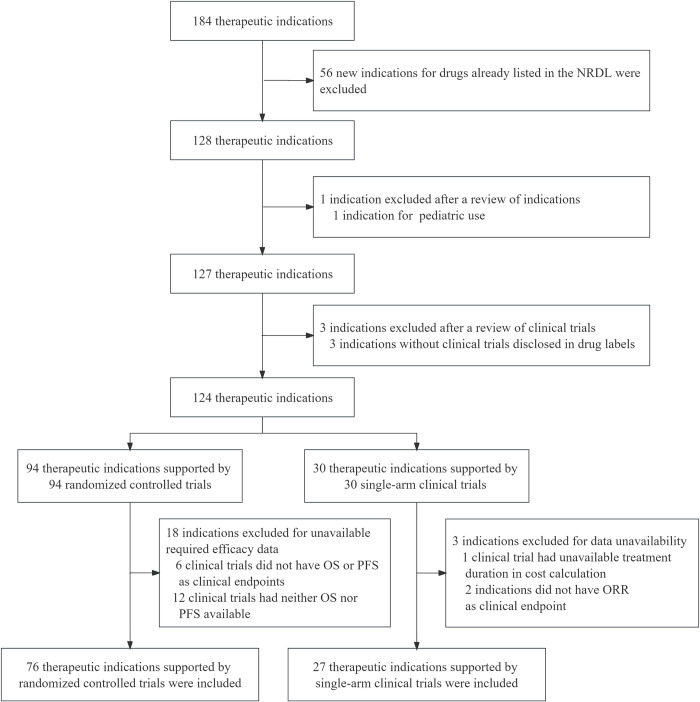
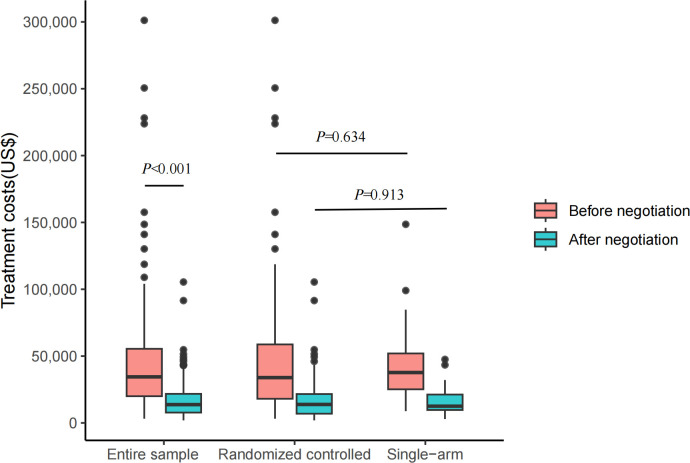
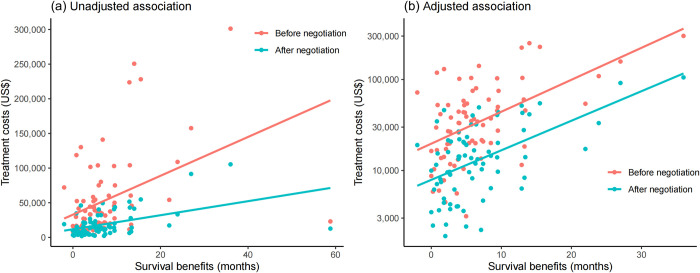
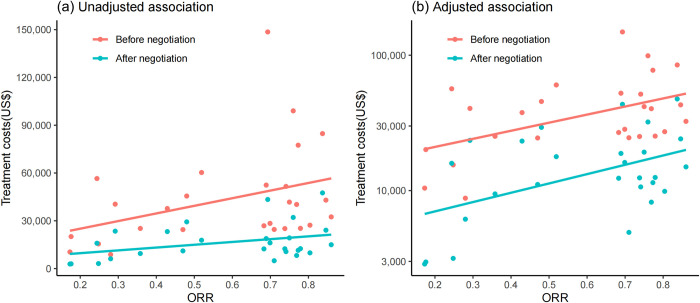
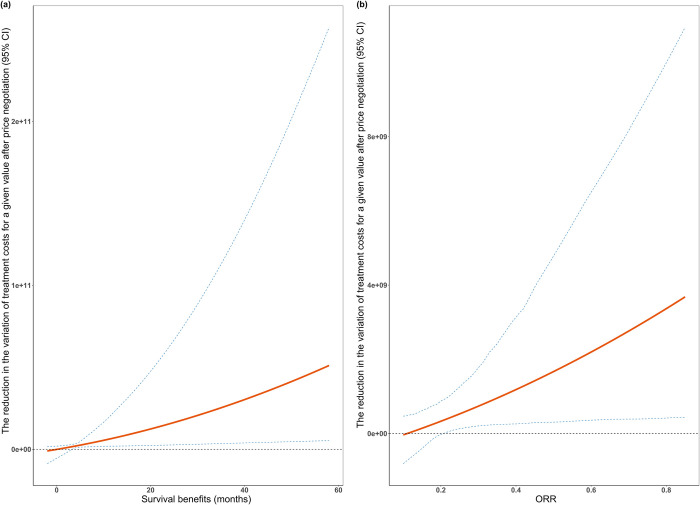
Methods and findings: In this observational study, anticancer drug indications that were negotiated successfully between 2017 and 2022 were identified through National Reimbursement Drug Lists (NRDL) of China. We excluded extensions of indications for drugs already listed in the NRDL, indications for pediatric use, and indications lacking corresponding clinical trials. We identified pivotal clinical trials for included indications by consulting review reports or drug labels issued by the Center for Drug Evaluation, National Medical Products Administration. We calculated treatment costs as outcome measures based on publicly available prices and collected data on clinical value including safety, survival, quality of life, and overall response rate (ORR) from publications of pivotal clinical trials. The associations between drug costs and clinical value, both before and after negotiation, were analyzed using regression analyses. We also examined whether price negotiation has led to a reduction in the variation of treatment costs for a given value. We included 103 anticancer drug indications, primarily for the treatment of blood cancer, lung cancer, and breast cancer, with 76 supported by randomized controlled trials and 27 supported by single-arm clinical trials. The median treatment costs over the entire sample have been reduced from US$34,460.72 (interquartile range (IQR): 19,990.49 to 55,441.66) to US$13,688.79 (IQR: 7,746.97 to 21,750.97) after price negotiation (P < 0.001). Before price negotiation, each additional month of survival gained was associated with an increase in treatment costs of 3.4% (95% confidence interval (CI) [2.1, 4.8], P < 0.001) for indications supported by randomized controlled trials, and a 10% increase in ORR was associated with a 6.0% (95% CI [1.6, 10.3], P = 0.009) increase in treatment costs for indications supported by single-arm clinical trials. After price negotiation, the associations between costs and clinical value may not have changed significantly, but the variation of drug costs for a given value was reduced. Study limitations include the lack of transparency in official data, missing data on clinical value, and a limited sample size.

Conclusions: In this study, we found that the implementation of price negotiation in China has led to drug pricing better aligned with clinical value for anticancer drugs even after substantial price reductions. The achievements made in China could shed light on the price regulation in other countries, particularly those with limited resources and increasing drug expenditures.


Conflict of interest statement

The authors have declared that no competing interests exist.

Figures

Fig 1
Fig 1. Flowchart of sample selection.
NRDL, National Reimbursement Drug Lists; ORR, overall response rate; OS, overall survival; PFS, progression-free survival.
Fig 2
Fig 2. Treatment costs over expected durations for indications both before and after negotiation in China.
This boxplot shows costs over expected treatment durations of indications over the entire sample (N = 103), of indications supported by randomized controlled trials (N = 76), and of indications supported by single-arm clinical trials (N = 27), both before and after negotiation. Entire sample = indications supported by both randomized controlled trials and single-arm clinical trials; randomized controlled = indications supported by randomized controlled trials; and single-arm = indications supported by single-arm clinical trials. Pink color represents indications before negotiation, while blue-green color represents indications after negotiation. Asymptotic P values were attached to show group differences. The box displays the median and IQR. The band near the middle of the box is the median, and the bottom and top of the box are the first and third quartiles (the 25th and 75th percentiles, respectively). The solid lines below and above the box describe the bottom and top whiskers. The small dots indicate extreme outliers. IQR, interquartile range.
Fig 3
Fig 3. Associations between treatment costs and survival benefits for indications supported by randomized controlled trials.
Fig 3A displays the raw data of 76 indications supported by randomized controlled trials, illustrating the unadjusted association between treatment costs and survival benefits. Fig 3B depicts the adjusted association between treatment costs and survival benefits for 75 indications after excluding the extreme outliers and log-transforming treatment costs based on data distribution. Notably, the Y-axis scale for treatment costs in Fig 3B has been log-transformed, while the axis labels display the original values for a clearer visual representation. Pink dots represent indications before negotiation, while blue-green dots represent indications after negotiation. Lines indicate the associations between treatment costs and survival benefits, with a pink line for the association before negotiation and a blue line for the association after negotiation.
Fig 4
Fig 4. Associations between treatment costs and overall response rates for indications supported by single-arm clinical trials.
ORR, overall response rates. Fig 4A displays the raw data of 27 included indications supported by single-arm clinical trials, illustrating the unadjusted association between treatment costs and ORR. Fig 4B depicts the adjusted association between treatment costs and ORR after log-transforming treatment costs based on data distribution. Notably, the Y-axis scale for treatment costs in Fig 4B has been log-transformed, while the axis labels display the original values for a clearer visual representation. Pink dots represent indications before negotiation, while blue-green dots represent indications after negotiation. Lines indicate the association between treatment costs and ORR, pink line for the association before negotiation and blue line for the association after negotiation.
Fig 5
Fig 5. Reductions in the variation of treatment costs for a given value after price negotiation.
ORR, overall response rates. Fig 5a shows the survival benefits and the reduction in the variation of treatment costs for a given survival after price negotiation for indications supported by randomized controlled trials. Fig 5b shows the ORR and the reduction in the variation of treatment costs for a given ORR after price negotiation for indications supported by single-arm clinical trials. The red line represents the reduction in the variation of treatment costs after price negotiation for a given value, and the blue dotted lines represent the 95% CI.

Similar articles

Cited by

References

    1. Kocarnik JM, Compton K, Dean FE, Fu W, Gaw BL, Harvey JD, et al.. Cancer Incidence, Mortality, Years of Life Lost, Years Lived With Disability, and Disability-Adjusted Life Years for 29 Cancer Groups From 2010 to 2019: A Systematic Analysis for the Global Burden of Disease Study 2019. JAMA. Oncol. 2022;8(3):420–444. doi: 10.1001/jamaoncol.2021.6987 . - DOI - PMC - PubMed
    1. Beall RF, Hwang TJ, Kesselheim AS. Major Events in the Life Course of New Drugs, 2000–2016. N Engl J Med. 2019;380(11):e12. doi: 10.1056/NEJMp1806930 . - DOI - PubMed
    1. IQVIA institute. Global Oncology Trends 2023: Outlook to 2027. 2023.
    1. Li G, Liu Y, Xie C, Zhou Q, Chen X. Characteristics of expedited programmes for cancer drug approval in China. Nat Rev Drug Discov. 2021;20(6):416. doi: 10.1038/d41573-021-00080-0 . - DOI - PubMed
    1. Liu GG, Wu J, He X, Jiang Y. Policy Updates on Access to and Affordability of Innovative Medicines in China. Value Health Reg Issues. 2022;30:59–66. doi: 10.1016/j.vhri.2021.12.003 . - DOI - PubMed

Publication types

Substances