. 2024 Jan 23;18(3):2047-2065.
doi: 10.1021/acsnano.3c08738. Epub 2024 Jan 2.

Ultrasound Stimulation of Piezoelectric Nanocomposite Hydrogels Boosts Chondrogenic Differentiation in Vitro, in Both a Normal and Inflammatory Milieu

Affiliations

Ultrasound Stimulation of Piezoelectric Nanocomposite Hydrogels Boosts Chondrogenic Differentiation in Vitro, in Both a Normal and Inflammatory Milieu

Leonardo Ricotti et al. ACS Nano. .

Abstract

The use of piezoelectric nanomaterials combined with ultrasound stimulation is emerging as a promising approach for wirelessly triggering the regeneration of different tissue types. However, it has never been explored for boosting chondrogenesis. Furthermore, the ultrasound stimulation parameters used are often not adequately controlled. In this study, we show that adipose-tissue-derived mesenchymal stromal cells embedded in a nanocomposite hydrogel containing piezoelectric barium titanate nanoparticles and graphene oxide nanoflakes and stimulated with ultrasound waves with precisely controlled parameters (1 MHz and 250 mW/cm2, for 5 min once every 2 days for 10 days) dramatically boost chondrogenic cell commitment in vitro. Moreover, fibrotic and catabolic factors are strongly down-modulated: proteomic analyses reveal that such stimulation influences biological processes involved in cytoskeleton and extracellular matrix organization, collagen fibril organization, and metabolic processes. The optimal stimulation regimen also has a considerable anti-inflammatory effect and keeps its ability to boost chondrogenesis in vitro, even in an inflammatory milieu. An analytical model to predict the voltage generated by piezoelectric nanoparticles invested by ultrasound waves is proposed, together with a computational tool that takes into consideration nanoparticle clustering within the cell vacuoles and predicts the electric field streamline distribution in the cell cytoplasm. The proposed nanocomposite hydrogel shows good injectability and adhesion to the cartilage tissue ex vivo, as well as excellent biocompatibility in vivo, according to ISO 10993. Future perspectives will involve preclinical testing of this paradigm for cartilage regeneration.

Keywords: chondrogenesis; hydrogel; inflammation; mesenchymal stromal cell; nanomaterial; piezoelectric; ultrasound.


Conflict of interest statement

The authors declare no competing financial interest.

Figures

Scheme 1
Scheme 1. Depiction of the Possible Future Therapeutic Paradigm Grounded on the Hypothesis of This Work
(a) Degenerated cartilage tissue; (b) application of the cell-laden nanocomposite hydrogel in situ, (c) stimulation with US waves, triggering the generation of intracellular local charges by exploiting nanomaterial piezoelectricity, (d) regenerated cartilage tissue.
Figure 1
Figure 1
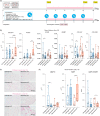
Characterization of the bare hydrogel (Hydrogel) and the nanocomposite one (Nanocomp). (a) Compression modulus (left), swelling ratio (center), and sol fraction (right) (n = 5 per group). (b) Viscosity vs shear rate plots (n = 5 per group). (c) K and n indexes extracted by viscosity vs shear rate curves. (d) Estimated shear stress acting on cells for different needles. (e) Mass loss over time for Hydrogel and Nanocomp, accounting for material degradation in different media. n = 5 per group. In all graphs, data are represented as box plots with median, minimum, and maximum. *p < 0.05, **p < 0.01.
Figure 2
Figure 2
Injectability, stability after injection, and adhesion to the cartilage tissue of the bare hydrogel (Hydrogel) and the nanocomposite one (Nanocomp). (a) Setup used and results obtained for Nanocomp injection force (n = 4 per group). (b) Analysis of the sliding behavior onto a bovine cartilage tissue sample. The heat map shows successful trials in green (the material drop remained on site) and unsuccessful ones in red (the material drop flew away from the cartilage). n = 5 per each angle tested. (c) Setup and procedure to evaluate the adhesion strength ex vivo, which allowed recording the adhesion strength between the top surface of a cartilage sample and the bottom surface of the hydrogel, through a circular surface contact area (in dashed red, in the figure); representative stress–strain curves and maximum adhesion strength data. n = 5 per group. (d) Representative adhesion strength vs displacement curves (left) and maximum adhesion strength values (right) for the hydrogel embedding different concentrations of BTNPs and nondoped control (CTR) (n = 5 per group). (e) Representative adhesion strength vs displacement curves (left) and maximum adhesion strength values (right) for the hydrogel embedding different concentrations of GO nanoflakes and nondoped control (CTR) (n = 5 per group). In all graphs, data are represented as box plots with median, minimum, and maximum. *p < 0.05, **p < 0.01.
Figure 3
Figure 3
Setup for dose-controlled ultrasound (US) stimulation and modeling of nanocomposite–US wave interaction. (a) Components of the high-frequency US stimulation system adopted in the study (left), normalized peak-to-peak pressure field maps (center), and spatial-average pulse–average intensity measurements results as a function of the input voltage provided by the generator at 1 and 5 MHz (right). (b) Components of the low-frequency US stimulation system adopted in the study (left), normalized peak-to-peak pressure field map (center), and spatial-average pulse–average intensity measurements as a function of the input voltage provided by the generator at 38 kHz (right).
Figure 4
Figure 4
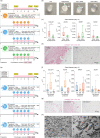
Chondrogenesis of ASCs embedded in the samples on day 10. (a) Scheme of the experiment. (b) Expression of COL2A1, ACAN, SOX9, MKI67, COL1A1, and COL10A1 genes on day 10 in Hydrogel and Nanocomp, with and without US stimulation. Data are derived from six independent experiments, n = 30 per group. (c) Collagen type 2 (top) and proteoglycans (bottom) immunostaining on day 10 in Hydrogel and Nanocomp, −US and +US. Scale bars = 100 μm. The images are representative of four independent experiments. (d) Expression of MMP13, TIMP1, and MMP13/TIMP1 genes on day 10 in Hydrogel and Nanocomp, −US and +US. Data are derived from six independent experiments, n = 24 per group. In all graphs, data are represented with box plots showing the median, minimum, and maximum values. *p < 0.05, **p < 0.01, ****p < 0.0001.
Figure 5
Figure 5
Effects of different LIPUS parameters on ASC chondrogenesis. (a) Scheme of the experimentfor evaluating different US frequencies. (b) Representative photos of Nanocomp–US and Nanocomp+US (38 kHz, 1 MHz, 5 MHz) on day 10, after receiving five US stimulations. (c) Expression of COL2A1, ACAN, SOX9, and MKI67 genes on day 10. n = 16 per group. (d) Collagen type 2 immunostaining on day 28 corresponding to different US frequencies. Scale bar: 100 μm. The images are representative of three independent experiments. (e) Scheme of the experiment for evaluating different US intensities. (f) Expression of COL2A1, ACAN, MKI67, and SOX9 genes on day 10. n = 20 per group. (g) Collagen type 2 immunostaining on day 28 corresponding to different US intensities. The images are representative of three independent experiments. Scale bar = 100 μm. (h) Representative TEM image (on day 28) of Nanocomp+US samples stimulated at 1 MHz and 250 mW/cm2, showing collagen fibers having the typical banding featuring collagen type 2. In all graphs, data are represented with box plots showing the median, minimum, and maximum values. *p < 0.05, **p < 0.01, ***p < 0.001.
Figure 6
Figure 6
Results of in vitro proteomic analyses. (a) Venn diagram showing the proteins identified by LC-MS analysis for the Nanocomp–US and Nanocomp+US samples. (b) Bars represent % of proteins belonging to Gene Ontology biological terms comparing the Nanocomp–US and the Nanocomp+US data sets. Data are derived from two independent experiments. (c) String network originated from Nanocomp+US proteins differentially expressed with respect to Nanocomp–US (up- or down-regulated) and identified only in that sample. Arrows represent up/down-regulated proteins resulting from spectral counting analysis. On the right, bars represent the fold enrichment of Gene Ontology terms with respect to the whole human proteome used as a reference background. (d) String network in which the curated Reactome pathway was interrogated, showing that annotated protein complexes were enriched. Arrows represent up/down-regulated proteins resulting from spectral counting analysis. Data refer to two independent experiments.
Figure 7
Figure 7
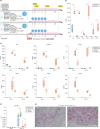
ASC chondrogenic differentiation in an inflammatory environment. (a) Scheme of the experiment. (b) IL6, CXCL8, TNF-α, CCL2, CCL4, and CCL5 release on day 2 (n = 5). (c) IL6, IL8, CXCL8, TNF-α, CCL2, CCL4, and CCL5 release on day 3 and day 10 (n = 5). (d) COL2A1 gene expression on day 3 and day 10 (n = 14). (e) Collagen type 2 immunostaining on day 28 in Infl–US and Infl+US samples. Images are representative of two independent experiments. In all graphs, data are represented with box plots showing the median, minimum, and maximum values. *p < 0.05, **p < 0.01, ***p < 0.001.
Figure 8
Figure 8
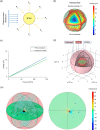
Analytic and computational model of the US wave–nanoparticle interaction. (a) Scheme of a single BTNP invested by a plane pressure wave expressed as hydrostatic pressure. (b) Visualization of the electric potential developed by a single BTNP invested by a peak-to-peak hydrostatic pressure (Ppk-pk) of 172 kPa, corresponding to a spatial average pulse intensity of 250 mW/cm2. (c) Maximum voltage generated by a single BTNP as a function of the hydrostatic pressure: comparison between the analytical model and the FEM simulations. (d) Scheme of the 3D COMSOL framework. (e) Electric potential in a representative 2D plane in which BTNPs are located (Ppk-pk = 172 kPa).

References

    1. Cafarelli A.; Marino A.; Vannozzi L.; Puigmartí-Luis J.; Pané S.; Ciofani G.; Ricotti L. Piezoelectric nanomaterials activated by ultrasound: the pathway from discovery to future clinical adoption. ACS Nano 2021, 15, 11066–11086. 10.1021/acsnano.1c03087. - DOI - PMC - PubMed
    1. Dolai J.; Biswas A.; Jana N. R. Piezoelectric Nanoparticles for Ultrasound-Based Wireless Therapies. ACS Appl. Nano Mater. 2022, 5, 14038–14050. 10.1021/acsanm.2c03421. - DOI
    1. Ji J.; Yang C.; Shan Y.; Sun M.; Cui X.; Xu L.; Li Z.; et al. Research Trends of Piezoelectric Nanomaterials in Biomedical Engineering. Adv. NanoBiomed Res. 2023, 3, 2200088.10.1002/anbr.202200088. - DOI
    1. Ciofani G.; Danti S.; D’Alessandro D.; Ricotti L.; Moscato S.; Bertoni G.; Menciassi A.; et al. Enhancement of neurite outgrowth in neuronal-like cells following boron nitride nanotube-mediated stimulation. ACS Nano 2010, 4, 6267–6277. 10.1021/nn101985a. - DOI - PubMed
    1. Marino A.; Arai S.; Hou Y.; Sinibaldi E.; Pellegrino M.; Chang Y. T.; Ciofani G.; et al. Piezoelectric nanoparticle-assisted wireless neuronal stimulation. ACS Nano 2015, 9, 7678–7689. 10.1021/acsnano.5b03162. - DOI - PMC - PubMed

Publication types