. 2023 Dec;248(23):2273-2288.
doi: 10.1177/15353702231214266. Epub 2024 Jan 2.

Link between m6A modification and infiltration characterization of tumor microenvironment in lung adenocarcinoma

Affiliations

Link between m6A modification and infiltration characterization of tumor microenvironment in lung adenocarcinoma

Sha Yang et al. Exp Biol Med (Maywood). 2023 Dec.

Abstract

N6-methyladenosine (m6A) RNA methylation plays a pivotal role in immune responses and the onset and advancement of cancer. Nonetheless, the precise impact of m6A modification in lung adenocarcinoma (LUAD) and its associated tumor microenvironment (TME) remains to be fully elucidated. Here, we distinguished distinct m6A modification patterns within two separate LUAD cohorts using a set of 21 m6A regulators. The TME characteristics associated with these two patterns align with the immune-inflamed and immune-excluded phenotypes, respectively. We identified 2064 m6A-related genes, which were used as a basis to divide all LUAD samples into three distinct m6A gene clusters. We applied a scoring system to evaluate the m6A gene signature of the m6A modification pattern in individual patients. To authenticate the categorization significance of m6A modification patterns, we established a correlation between m6A score and TME infiltration profiling, tumor somatic mutations, and responses to immunotherapy. A high level of m6A modification may be associated with the aggressiveness and poor prognosis of LUAD. Further studies should investigate the mechanism of action of m6A regulators and m6A-related genes to improve the diagnosis and treatment of patients with LUAD.

Keywords: immunotherapy; lung adenocarcinoma; m6A; stroma; tumor microenvironment; tumor somatic mutation.


Conflict of interest statement

Declaration of conflicting interestsThe author(s) declared no potential conflicts of interest with respect to the research, authorship, and/or publication of this article.

Figures
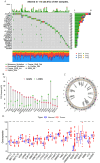
Figure 1.
Figure 1.
The genetic variation landscape of m6A regulators in LUAD. (A) Mutation frequencies of 21 m6A regulators in 561 LUAD patients from GSE68465 and TCGA-LUAD meta-cohorts. Each column represents an individual patient. The right-side numbers depict the mutation frequency for each regulator, while the proportion of each variant type is shown in the right barplot. Upper barplot indicates TMB, and the stacked barplot below displays the fraction of conversions for individual sample. (B) The CNV variation frequency of each m6A regulator (TCGA-LUAD cohort). Each column’s height corresponds to the alteration frequency, with green dots indicating deletion frequency and red dots signifying amplification frequency. (C) A circular diagram was employed to depict the location of CNV alterations of m6A regulators across the 23 chromosomes (TCGA-LUAD cohort). (D) The comparison of expression levels for the 21 m6A regulators (between tumor and normal tissues) was illustrated using red and blue boxes for tumor and normal samples, respectively. The boxes represented the interquartile range, with median values depicted as lines within the boxes, and outliers shown as black dots. The statistical P value was calculated (Kruskal–Wallis test), denoted by *P < 0.05, **P < 0.01, and ***P < 0.001.
Figure 2.
Figure 2.
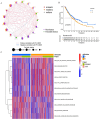
Distinctive m6A modification patterns orchestrated by the 21 m6A regulators. (A) Interplay among m6A regulators in LUAD. The circle sizes denoted the impact of regulators on prognosis, evaluated using Cox-rank test values: P < 0.0001, P < 0.0001, P < 0.01, P < 0.05, and P < 1. Purple dots signified risk factors, while green dots indicated favorable prognosis factors. Interactions were visualized by linking lines, with their thickness reflecting correlation strength. Positive correlations were highlighted in red and negative correlations in blue. Writers, readers, and erasers were denoted by gray, orange, and red, respectively. (B) OS of all LUAD patients in distinct m6A clusters. Log-rank test showed an overall P = 0.016. All LUAD patients included 919 cases from one GEO cohort (GSE68465) and TCGA-LUAD cohort. (C) GSVA analysis reveals activation status of biological pathways in each m6A modification patterns. Heatmap representation of biological processes displays activated pathways in red and inhibited pathways in blue. Annotations from LUAD cohorts were applied for sample categorization.
Figure 3.
Figure 3.
Distinct m6A modification patterns and their impact on TME infiltration and transcriptome traits. (A) Distribution of tumor-infiltrating cells in each m6A modification pattern. Interquartile ranges were depicted by the upper and lower box ends. Median values were indicated by lines within the boxes, while outliers were represented by black dots. Statistical significance was assessed (Kruskal–Wallis test). *P < 0.05; **P < 0.01; ***P < 0.001. (B) A significant contrast in transcriptome profiles between the two m6A modification patterns, visualized using t-SNE. (C) The unsupervised clustering of all LUAD patients based on the 21 m6A regulators. Patient annotations included survival status, N staging, T staging, gender, age, project, and m6A cluster. High expression of m6A regulators was denoted by red, while low expression was denoted by blue.
Figure 4.
Figure 4.
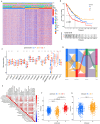
Identification of m6A gene signatures. (A) Using unsupervised clustering, overlapping m6A phenotype-related genes were clustered in all LUAD cohorts, leading to the categorization of patients into three distinct genomic subtypes known as m6A gene clusters A–C. Survival status, N staging, T staging, gender, age, project, and m6A cluster for patient annotations. High expression of m6A regulators was visualized in red, while low expression was depicted in blue. (B) For all LUAD patients within different m6A gene clusters, Kaplan–Meier curves were generated to depict OS outcomes. The log-rank test indicated a significant overall P value of < 0.001. The collective cohort consisted of 919 cases from both the GEO cohort (GSE68465) and the TCGA-LUAD cohort. (C) The proportion of tumor-infiltrating cells was assessed across the three m6A gene clusters (Kruskal–Wallis test). In the box plots, the interquartile range was depicted by the upper and lower edges, the median value was represented by lines within the boxes, and outliers were indicated by black dots. The statistical significance was denoted as *P < 0.05, **P < 0.01, and ***P < 0.001. (D) An alluvial diagram illustrating the distribution of m6A clusters among various groups based on distinct m6A gene clusters, survival status, and m6A scores. (E) Analyzing the correlation between m6A score and each type of TME infiltration cell through Spearman analysis. Positive correlations were denoted by red, while negative correlations were indicated by blue (*P < 0.05; **P < 0.01). (F) Using the Kruskal–Wallis test, we examined the variations in m6A scores across the three gene clusters among all LUAD patients (P < 0.001). (G) Employing the Wilcoxon test, we assessed the disparities in m6A scores within the two m6A clusters across all LUAD patients, highlighting a substantial statistical distinction (P < 0.001).
Figure 5.
Figure 5.
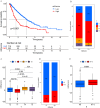
Distinctive traits of m6A modification. (A) Kaplan–Meier survival analysis for OS of all LUAD patients between patients with a high m6A score and those with a low m6A score. The log-rank test indicated a significant overall P value of < 0.001. All LUAD patients included 919 cases from one GEO cohort (GSE68465) and TCGA-LUAD cohort. (B) The proportion of T staging 1–4 in high and low m6A score group. T1, blue; T2, red; T3, yellow; T4, purple. (C) Variations in m6A scores among patients with different T staging. The Kruskal–Wallis test was employed to assess the statistical significance across four T-staging groups, yielding a significant P value of <0.0001. (D) The proportion of N staging 0 and N staging 1–3 in high and low m6A score group. N0, blue; N1–3, red. (E) Variations in m6A scores were investigated between patients categorized as N staging 0 and those with N staging 1–3, revealing a highly significant P value of < 0.0001.(Kruskal–Wallis test).
Figure 6.
Figure 6.
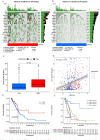
Features of m6A modification in TCGA tumor somatic mutations. (A, B) A comparison of tumor somatic mutations was depicted using waterfall plots for individuals with (A) high m6A score and (B) low m6A score. Each column represented an individual patient. The upper barplot displayed the TMB, while the right barplot illustrated the proportion of each variant type. The mutation frequency for each gene was indicated by the number on the right. (C) Statistical analysis using the Wilcoxon test revealed a significant difference in TMB between the subgroups with high and low m6A scores (P < 0.0001). (D) In the TCGA-LUAD cohort, scatterplots illustrate a positive correlation between m6A scores and mutation load, with a Spearman correlation coefficient of 0.36 and a P value of < 0.0001. (E) OS of the TCGA-LUAD cohort stratified by high and low TMB. Log-rank test showed a P = 0.012. (F) Kaplan–Meier survival curves in the TCGA-LUAD cohort were plotted to stratify patients based on both TMB and m6A scores. The log-rank test revealed a significant P value of < 0.001 for OS in this stratification.
Figure 7.
Figure 7.
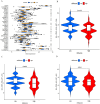
M6A score and the response to immunotherapy. (A) Comparison of checkpoint gene expression in high and low m6A score subgroups was conducted. The boxes’ left and right ends denoted the interquartile range, median values were indicated by lines within, and outliers were depicted as black dots. (*P < 0.05; **P < 0.01; ***P < 0.001; Kruskal–Wallis test). In the figure, the high m6A score subgroup is denoted by blue, while the low m6A score subgroup is represented by yellow. (B–D) Response disparities to different treatments were observed between high and low m6A score subgroups. Specifically, there were differences in response to (B) anti-CTLA4, (C) anti-CTLA4, and (D) the combination of anti-CTLA4 with anti-CTLA4, P < 0.0001, P = 0.00078, P = 0.0015, and P = 0.0001, respectively.(Kruskal–Wallis test).

Similar articles

Cited by

References

    1. Lavi U, Fernandez-Muñoz R, Darnell JE., Jr. Content of N-6 methyl adenylic acid in heterogeneous nuclear and messenger RNA of HeLa cells. Nucleic Acids Res 1977;4:63–9 - PMC - PubMed
    1. Sun T, Wu R, Ming L. The role of m6A RNA methylation in cancer. Biomed Pharmacother 2019;112:108613. - PubMed
    1. Zhuang Z, Chen L, Mao Y, Zheng Q, Li H, Huang Y, Hu Z, Jin Y. Diagnostic, progressive and prognostic performance of m6A methylation RNA regulators in lung adenocarcinoma. Int J Biol Sci 2020;16:1785–97 - PMC - PubMed
    1. Ma Y, Liu X, Bi Y, Wang T, Chen C, Wang Y, Han D, Cao F. Alteration of N6-methyladenosine mRNA methylation in a human stem cell-derived cardiomyocyte model of tyrosine kinase inhibitor-induced cardiotoxicity. Front Cardiovasc Med 2022;9:849175. - PMC - PubMed
    1. Ma S, Chen C, Ji X, Liu J, Zhou Q, Wang G, Yuan W, Kan Q, Sun Z. The interplay between m6A RNA methylation and noncoding RNA in cancer. J Hematol Oncol 2019;12:121. - PMC - PubMed