

Single-cell and transcriptomic analyses reveal the influence of diabetes on ovarian cancer
- PMID: 38166541
- PMCID: PMC10759538
- DOI: 10.1186/s12864-023-09893-2
Single-cell and transcriptomic analyses reveal the influence of diabetes on ovarian cancer
Abstract
Background: There has been a significant surge in the global prevalence of diabetes mellitus (DM), which increases the susceptibility of individuals to ovarian cancer (OC). However, the relationship between DM and OC remains largely unexplored. The objective of this study is to provide preliminary insights into the shared molecular regulatory mechanisms and potential biomarkers between DM and OC.
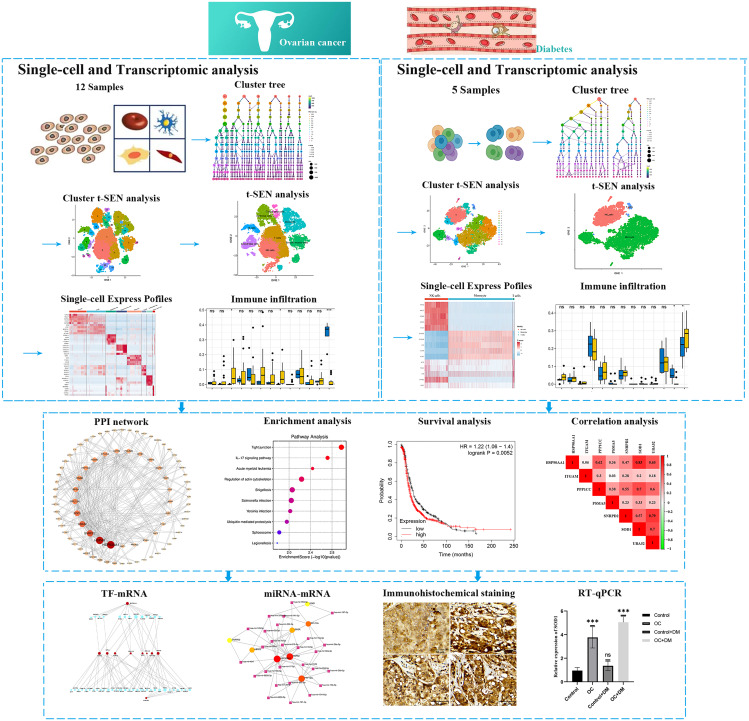
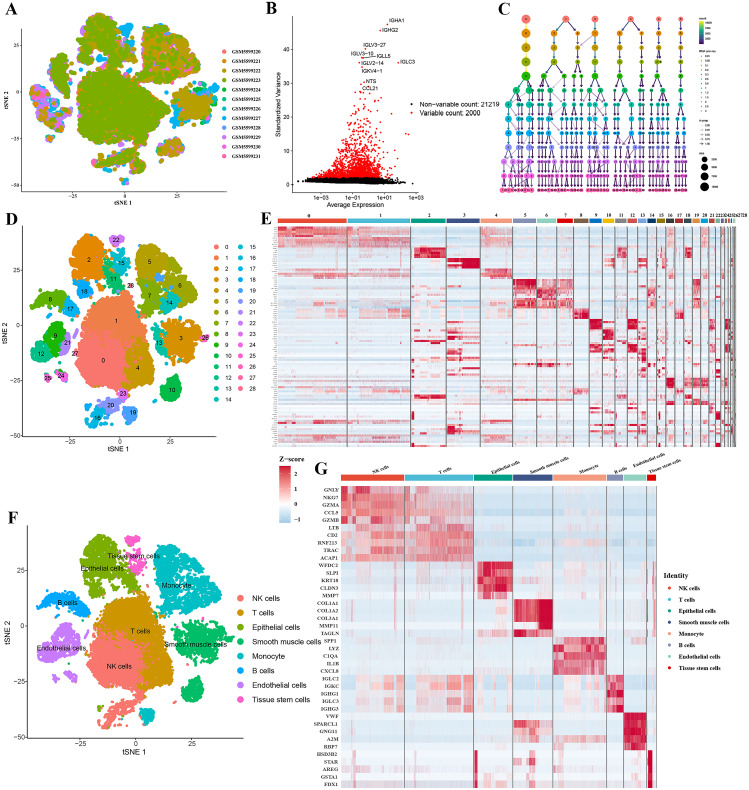
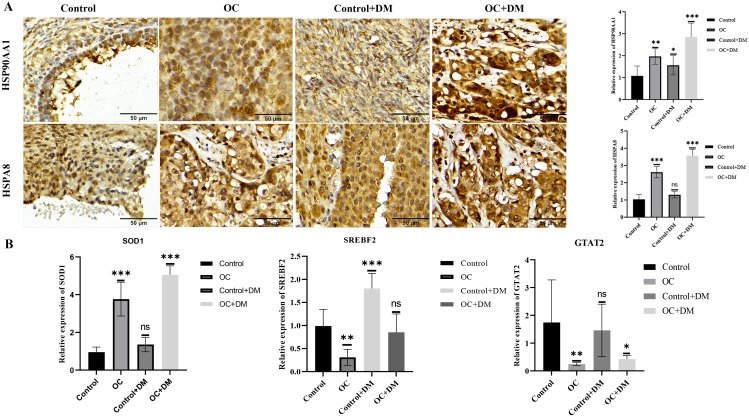
Methods: Multiple datasets from the GEO database were utilized for bioinformatics analysis. Single cell datasets from the GEO database were analysed. Subsequently, immune cell infiltration analysis was performed on mRNA expression data. The intersection of these datasets yielded a set of common genes associated with both OC and DM. Using these overlapping genes and Cytoscape, a protein‒protein interaction (PPI) network was constructed, and 10 core targets were selected. Gene Ontology (GO) and Kyoto Encyclopedia of Genes and Genomes (KEGG) enrichment analyses were then conducted on these core targets. Additionally, advanced bioinformatics analyses were conducted to construct a TF-mRNA-miRNA coregulatory network based on identified core targets. Furthermore, immunohistochemistry staining (IHC) and real-time quantitative PCR (RT-qPCR) were employed for the validation of the expression and biological functions of core proteins, including HSPAA1, HSPA8, SOD1, and transcription factors SREBF2 and GTAT2, in ovarian tumors.
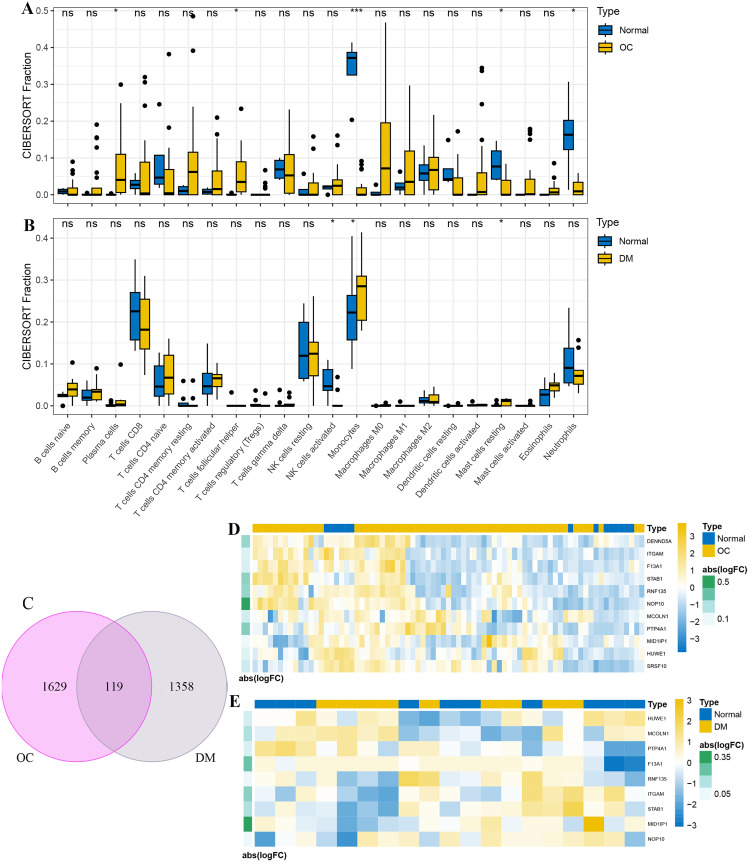
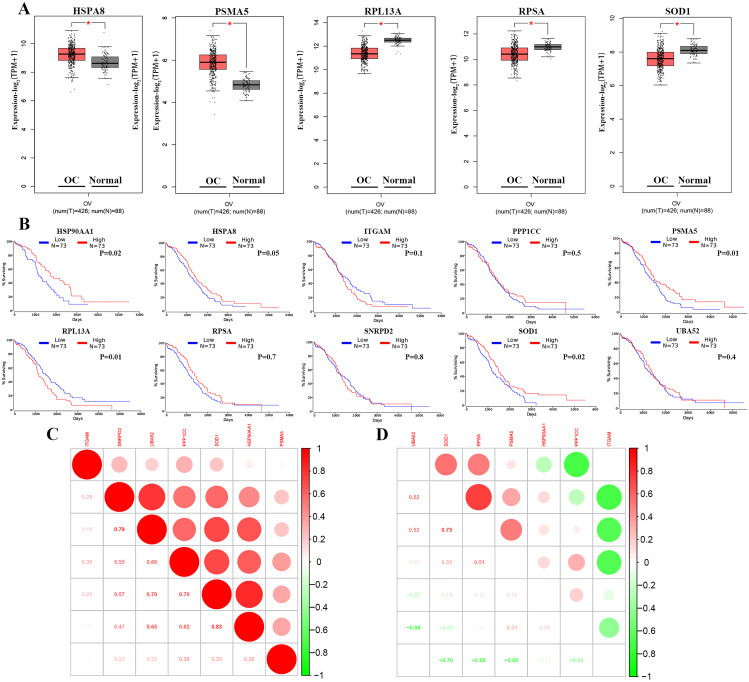
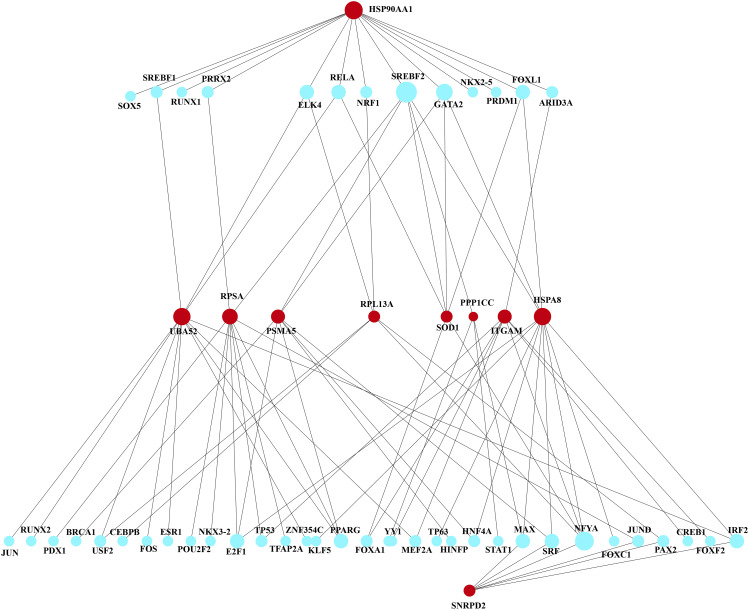
Results: The immune cell infiltration analysis based on mRNA expression data for both DM and OC, as well as analysis using single-cell datasets, reveals significant differences in mononuclear cell levels. By intersecting the single-cell datasets, a total of 119 targets related to mononuclear cells in both OC and DM were identified. PPI network analysis further identified 10 hub genesincludingHSP90AA1, HSPA8, SNRPD2, UBA52, SOD1, RPL13A, RPSA, ITGAM, PPP1CC, and PSMA5, as potential targets of OC and DM. Enrichment analysis indicated that these genes are primarily associated with neutrophil degranulation, GDP-dissociation inhibitor activity, and the IL-17 signaling pathway, suggesting their involvement in the regulation of the tumor microenvironment. Furthermore, the TF-gene and miRNA-gene regulatory networks were validated using NetworkAnalyst. The identified TFs included SREBF2, GATA2, and SRF, while the miRNAs included miR-320a, miR-378a-3p, and miR-26a-5p. Simultaneously, IHC and RT-qPCR reveal differential expression of core targets in ovarian tumors after the onset of diabetes. RT-qPCR further revealed that SREBF2 and GATA2 may influence the expression of core proteins, including HSP90AA1, HSPA8, and SOD1.
Conclusion: This study revealed the shared gene interaction network between OC and DM and predicted the TFs and miRNAs associated with core genes in monocytes. Our research findings contribute to identifying potential biological mechanisms underlying the relationship between OC and DM.
Keywords: Diabetes Mellitus; Immunotherapy; Monocyte marker genes; Ovarian cancer; Single-cell RNA sequencing.
© 2023. The Author(s).
Conflict of interest statement
The authors declare that the research was conducted in the absence of any commercial or financial relationships that could be construed as a potential conflict of interest.
Figures


References
MeSH terms
Substances
Grants and funding
- No.81873195/National Natural Science Foundation of China
- No.81873195/National Natural Science Foundation of China
- No.81873195/National Natural Science Foundation of China
- No.81873195/National Natural Science Foundation of China
- No.81873195/National Natural Science Foundation of China
- No.81873195/National Natural Science Foundation of China
- No.81873195/National Natural Science Foundation of China
- No.81873195/National Natural Science Foundation of China
- No.81873195/National Natural Science Foundation of China
- XLYC1907113/Liaoning Revitalization Talents Program
- XLYC1907113/Liaoning Revitalization Talents Program
- XLYC1907113/Liaoning Revitalization Talents Program
- XLYC1907113/Liaoning Revitalization Talents Program
- XLYC1907113/Liaoning Revitalization Talents Program
- XLYC1907113/Liaoning Revitalization Talents Program
- XLYC1907113/Liaoning Revitalization Talents Program
- XLYC1907113/Liaoning Revitalization Talents Program
- XLYC1907113/Liaoning Revitalization Talents Program
- 2023010109-JH2/1013/Natural Science Foundation of Liaoning Province
- 2023010109-JH2/1013/Natural Science Foundation of Liaoning Province
- 2023010109-JH2/1013/Natural Science Foundation of Liaoning Province
- 2023010109-JH2/1013/Natural Science Foundation of Liaoning Province
- 2023010109-JH2/1013/Natural Science Foundation of Liaoning Province
- 2023010109-JH2/1013/Natural Science Foundation of Liaoning Province
- 2023010109-JH2/1013/Natural Science Foundation of Liaoning Province
- 2023010109-JH2/1013/Natural Science Foundation of Liaoning Province
- 2023010109-JH2/1013/Natural Science Foundation of Liaoning Province
- 2022RJ19/Distinguished Young Scholars in Dalian
- 2022RJ19/Distinguished Young Scholars in Dalian
- 2022RJ19/Distinguished Young Scholars in Dalian
- 2022RJ19/Distinguished Young Scholars in Dalian
- 2022RJ19/Distinguished Young Scholars in Dalian
- 2022RJ19/Distinguished Young Scholars in Dalian
- 2022RJ19/Distinguished Young Scholars in Dalian
- 2022RJ19/Distinguished Young Scholars in Dalian
- 2022RJ19/Distinguished Young Scholars in Dalian
- 111906010210/Dalian Medical University Foundation for Teaching Reform Project of Undergraduate Innovative Talents Training
- 111906010210/Dalian Medical University Foundation for Teaching Reform Project of Undergraduate Innovative Talents Training
- 111906010210/Dalian Medical University Foundation for Teaching Reform Project of Undergraduate Innovative Talents Training
- 111906010210/Dalian Medical University Foundation for Teaching Reform Project of Undergraduate Innovative Talents Training
- 111906010210/Dalian Medical University Foundation for Teaching Reform Project of Undergraduate Innovative Talents Training
- 111906010210/Dalian Medical University Foundation for Teaching Reform Project of Undergraduate Innovative Talents Training
- 111906010210/Dalian Medical University Foundation for Teaching Reform Project of Undergraduate Innovative Talents Training
- 111906010210/Dalian Medical University Foundation for Teaching Reform Project of Undergraduate Innovative Talents Training
- 111906010210/Dalian Medical University Foundation for Teaching Reform Project of Undergraduate Innovative Talents Training
LinkOut - more resources
Full Text Sources
Medical
Research Materials
Miscellaneous
