

Genome-wide identification and expression pattern analysis of the kiwifruit GRAS transcription factor family in response to salt stress
- PMID: 38166720
- PMCID: PMC10759511
- DOI: 10.1186/s12864-023-09915-z
Genome-wide identification and expression pattern analysis of the kiwifruit GRAS transcription factor family in response to salt stress
Abstract
Background: GRAS is a family of plant-specific transcription factors (TFs) that play a vital role in plant growth and development and response to adversity stress. However, systematic studies of the GRAS TF family in kiwifruit have not been reported.
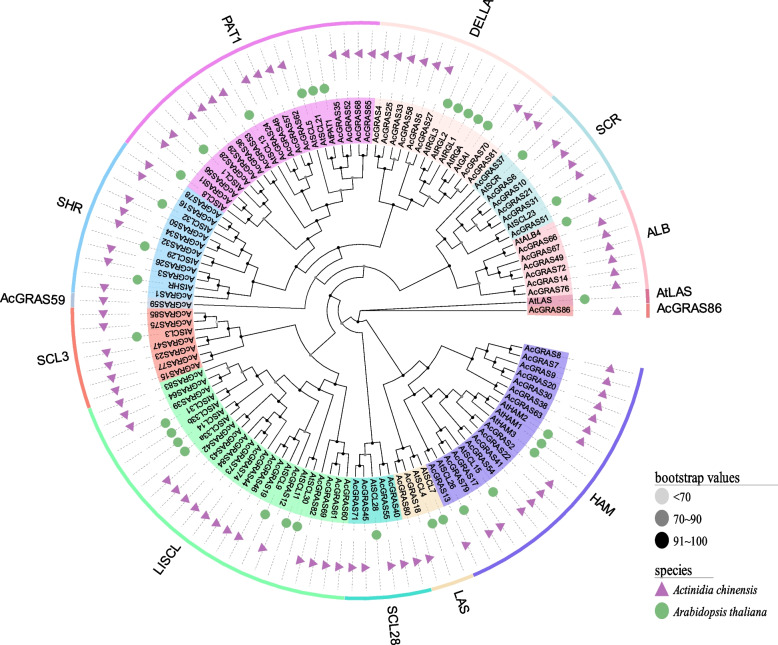
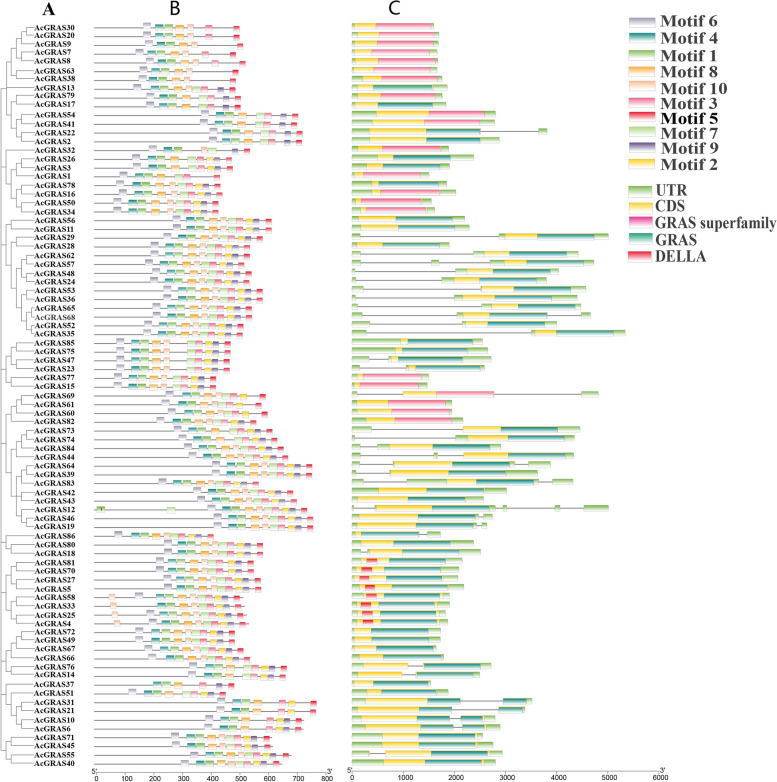
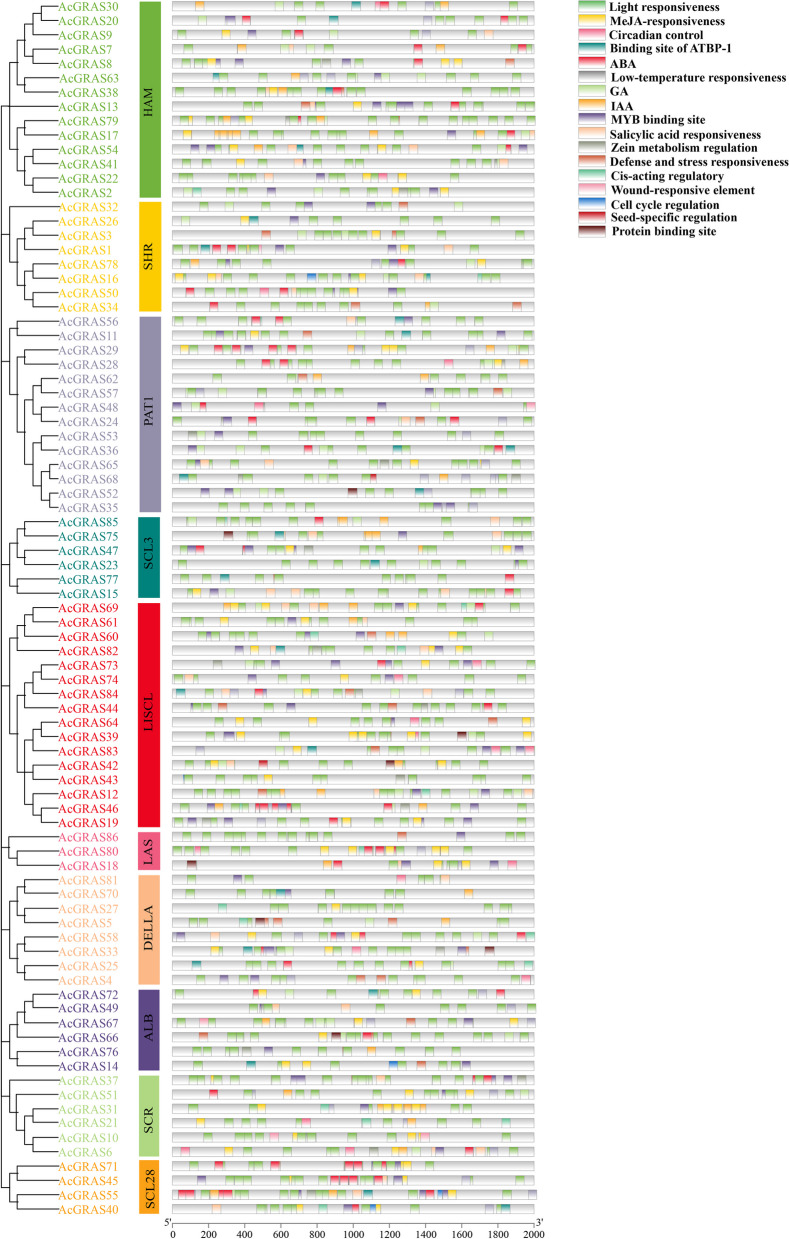
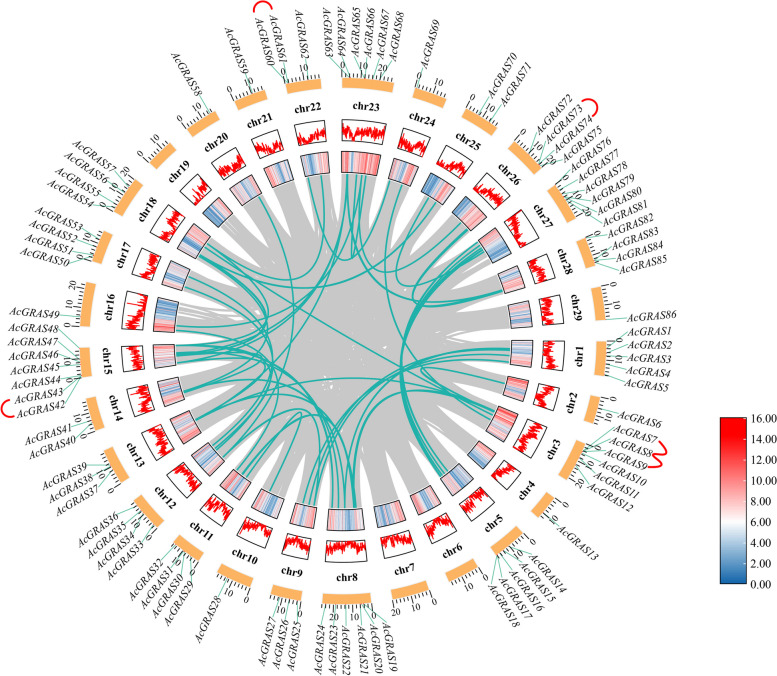
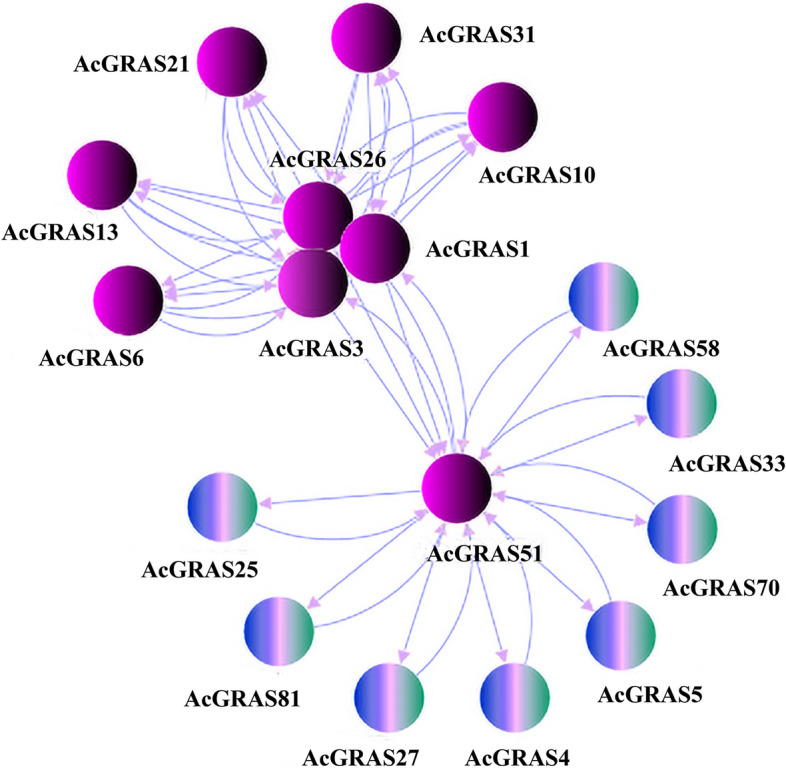
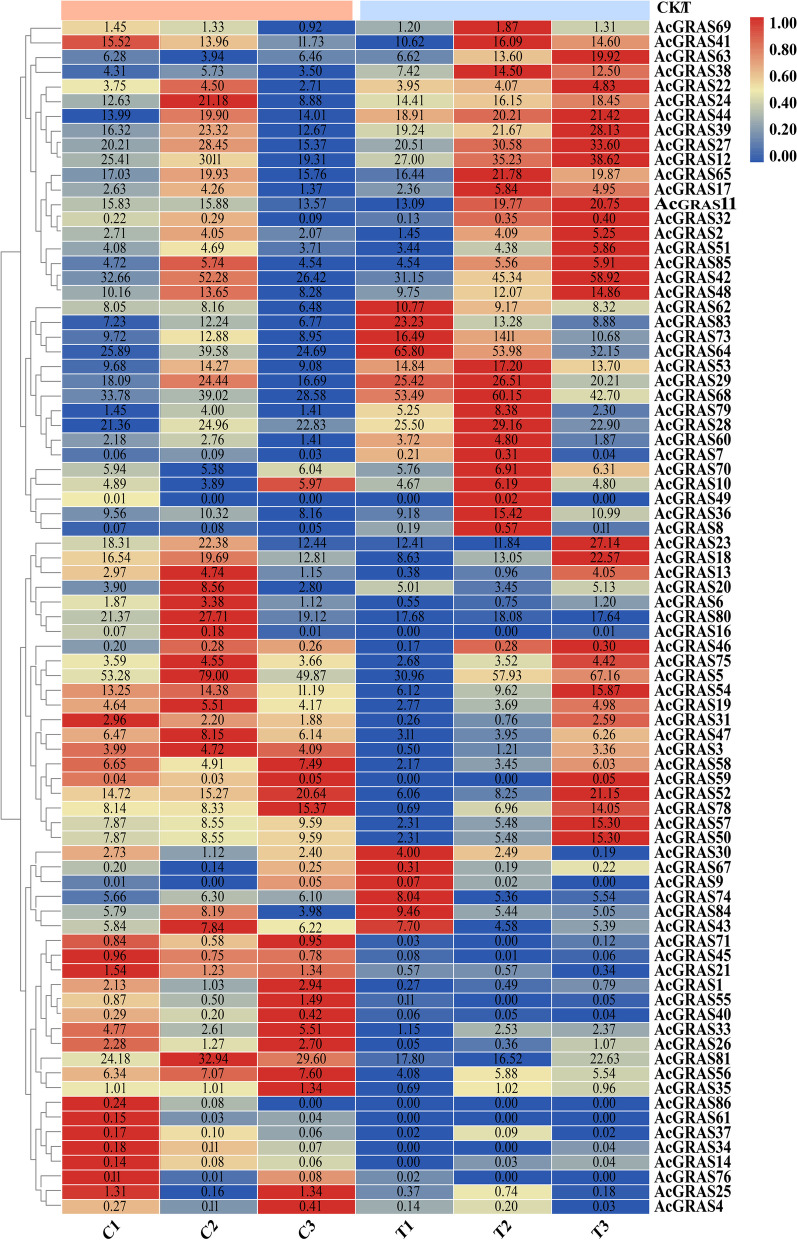
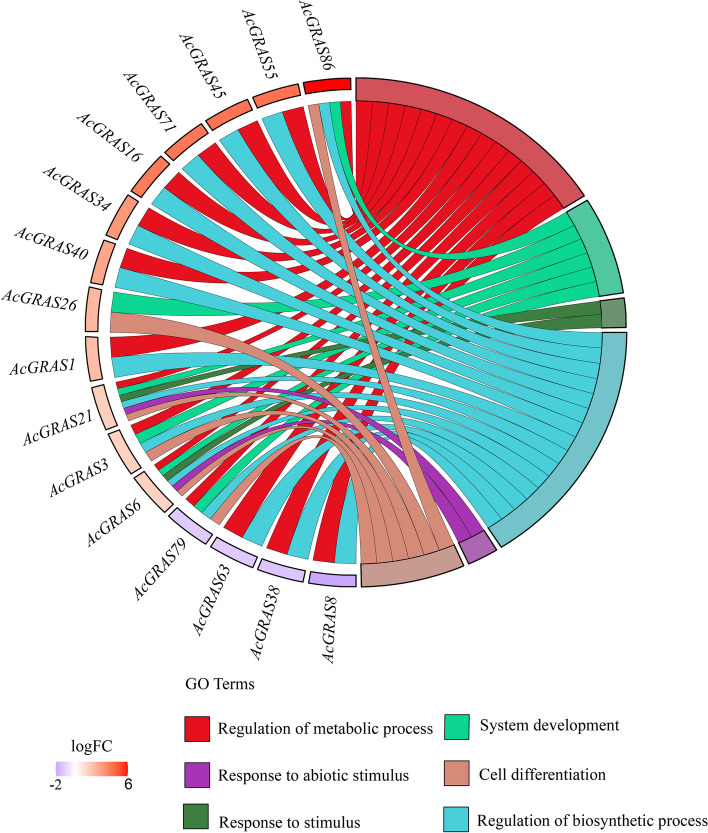
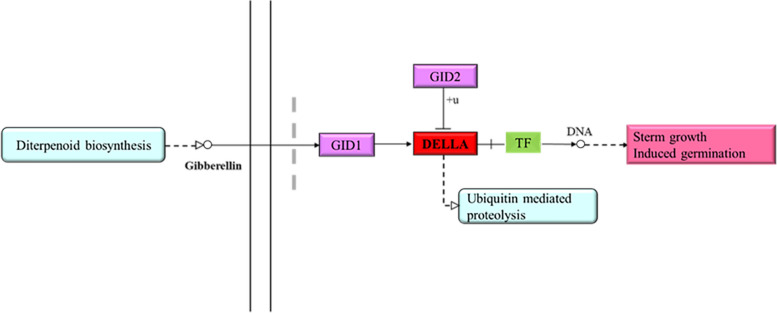
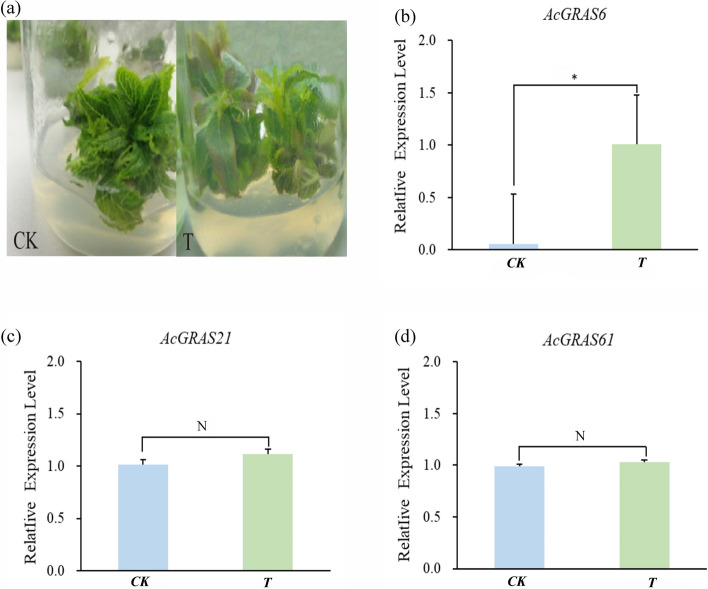
Results: In this study, we used a bioinformatics approach to identify eighty-six AcGRAS TFs located on twenty-six chromosomes and phylogenetic analysis classified them into ten subfamilies. It was found that the gene structure is relatively conserved for these genes and that fragmental duplication is the prime force for the evolution of AcGRAS genes. However, the promoter region of the AcGRAS genes mainly contains cis-acting elements related to hormones and environmental stresses, similar to the results of GO and KEGG enrichment analysis, suggesting that hormone signaling pathways of the AcGRAS family play a vital role in regulating plant growth and development and adversity stress. Protein interaction network analysis showed that the AcGRAS51 protein is a relational protein linking DELLA, SCR, and SHR subfamily proteins. The results demonstrated that 81 genes were expressed in kiwifruit AcGRAS under salt stress, including 17 differentially expressed genes, 13 upregulated, and four downregulated. This indicates that the upregulated AcGRAS55, AcGRAS69, AcGRAS86 and other GRAS genes can reduce the salt damage caused by kiwifruit plants by positively regulating salt stress, thus improving the salt tolerance of the plants.
Conclusions: These results provide a theoretical basis for future exploration of the characteristics and functions of more AcGRAS genes. This study provides a basis for further research on kiwifruit breeding for resistance to salt stress. RT-qPCR analysis showed that the expression of 3 AcGRAS genes was elevated under salt stress, indicating that AcGRAS exhibited a specific expression pattern under salt stress conditions.
Keywords: Expression patterns; GRAS transcription factors; Genome-wide analysis; Kiwifruit; Salt stress; Transcriptome.
© 2023. The Author(s).
Conflict of interest statement
The authors declare no competing interests.
Figures


Similar articles
-
The GRAS gene family and its roles in pineapple (Ananas comosus L.) developmental regulation and cold tolerance.BMC Plant Biol. 2024 Dec 19;24(1):1204. doi: 10.1186/s12870-024-05913-9. BMC Plant Biol. 2024. PMID: 39701971 Free PMC article.
-
Genome-wide identification of kiwifruit K+ channel Shaker family members and their response to low-K+ stress.BMC Plant Biol. 2024 Sep 6;24(1):833. doi: 10.1186/s12870-024-05555-x. BMC Plant Biol. 2024. PMID: 39243055 Free PMC article.
-
Genome-Wide Identification of the GRAS Transcription Factor Family in Sweet Orange and the Regulation of Salt Stress-Enhanced Plant Salt Tolerance in Sweet Orange by CsGRAS15 and CsGRAS27.Biomolecules. 2025 Jun 29;15(7):946. doi: 10.3390/biom15070946. Biomolecules. 2025. PMID: 40723818 Free PMC article.
-
Genome-Wide Identification of GRAS Gene Family in Cunninghamia lanceolata and Expression Pattern Analysis of ClDELLA Protein Under Abiotic Stresses.Int J Mol Sci. 2024 Nov 15;25(22):12262. doi: 10.3390/ijms252212262. Int J Mol Sci. 2024. PMID: 39596328 Free PMC article.
-
GRAS transcription factors emerging regulator in plants growth, development, and multiple stresses.Mol Biol Rep. 2022 Oct;49(10):9673-9685. doi: 10.1007/s11033-022-07425-x. Epub 2022 Jun 17. Mol Biol Rep. 2022. PMID: 35713799 Review.
Cited by
-
Genome-Wide Identification of the DOF Gene Family in Kiwifruit (Actinidia chinensis) and Functional Validation of AcDOF22 in Response to Drought Stress.Int J Mol Sci. 2024 Aug 22;25(16):9103. doi: 10.3390/ijms25169103. Int J Mol Sci. 2024. PMID: 39201789 Free PMC article.
-
Deciphering of Genomic Loci Associated with Alkaline Tolerance in Soybean [Glycine max (L.) Merr.] by Genome-Wide Association Study.Plants (Basel). 2025 Jan 24;14(3):357. doi: 10.3390/plants14030357. Plants (Basel). 2025. PMID: 39942919 Free PMC article.
-
Identification of the bHLH Transcription Factor Family in Orah Mandarin and the Response of CrbHLH46 to Low-Temperature Stress.Plants (Basel). 2025 Mar 12;14(6):882. doi: 10.3390/plants14060882. Plants (Basel). 2025. PMID: 40265795 Free PMC article.
-
Genome-wide identification and expression analysis of the Eriobotrya japonica TIFY gene family reveals its functional diversity under abiotic stress conditions.BMC Genomics. 2024 May 14;25(1):468. doi: 10.1186/s12864-024-10375-2. BMC Genomics. 2024. PMID: 38745142 Free PMC article.
-
Genome-Wide Identification of DREB Gene Family in Kiwifruit and Functional Characterization of Exogenous 5-ALA-Mediated Cold Tolerance via ROS Scavenging and Hormonal Signaling.Plants (Basel). 2025 Aug 17;14(16):2560. doi: 10.3390/plants14162560. Plants (Basel). 2025. PMID: 40872184 Free PMC article.
References
-
- Zhong C, Huang W, Li D, Zhang Q, Li L. Dynamic analysis of the development of the world kiwifruit industry and fresh fruit trade. Chinese Fruit Trees. 2021;07:101–108.
-
- Zhong C, Li D. Scientific and technological achievements of kiwifruit contribute to poverty alleviation in the industry. Chin. Acad. Sci. 2020;35(Z2):45–56.
MeSH terms
Substances
LinkOut - more resources
Full Text Sources
Miscellaneous
