. 2024 Jan 2;24(1):9.
doi: 10.1186/s12879-023-08890-w.

Platelet distribution width as an useful indicator of influenza severity in children

Affiliations

Platelet distribution width as an useful indicator of influenza severity in children

Seyin Zou et al. BMC Infect Dis. .

Abstract

Purpose: The present study aims to investigate the potential of platelet distribution width as an useful parameter to assess the severity of influenza in children.

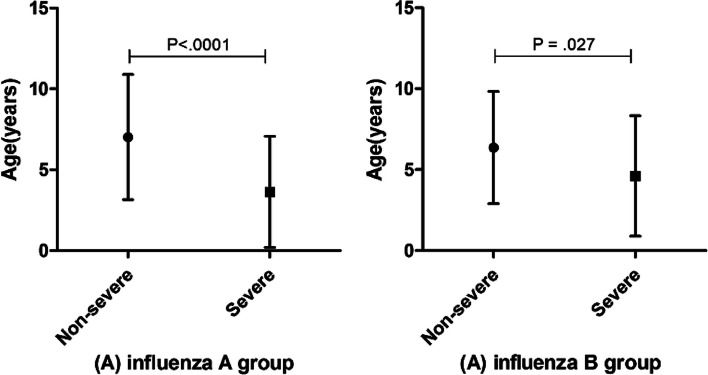
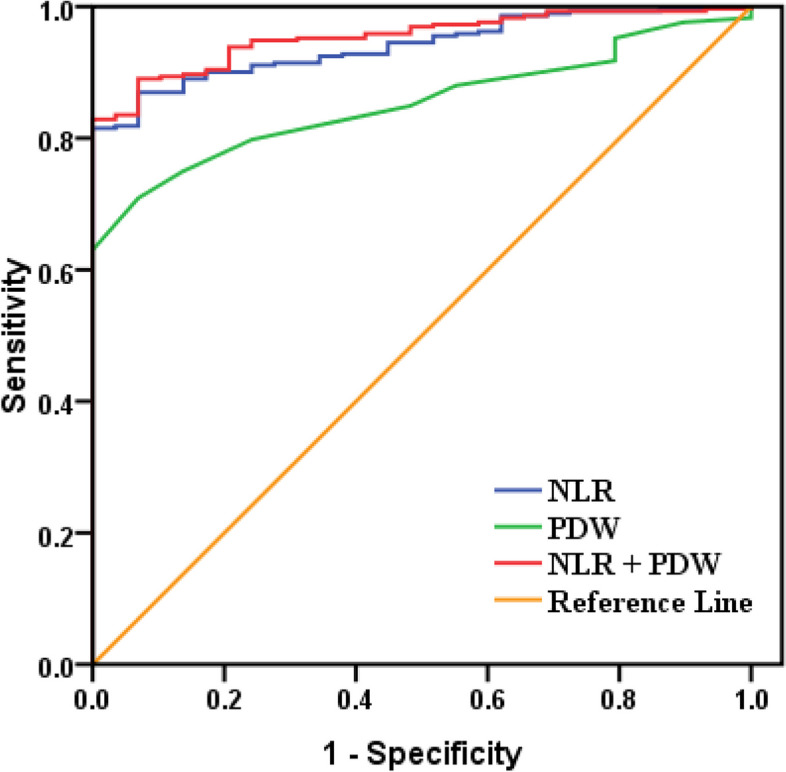
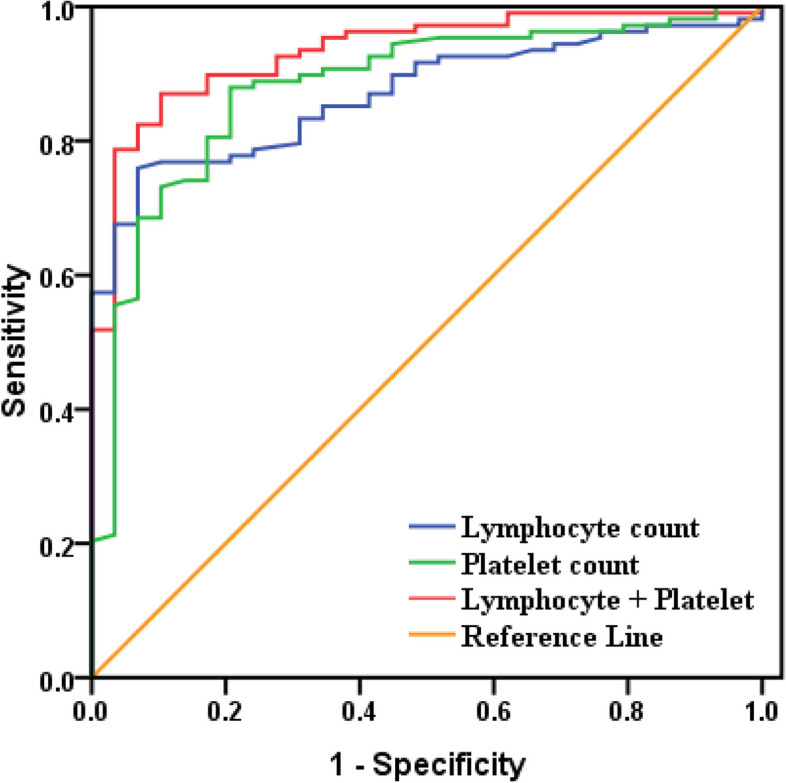
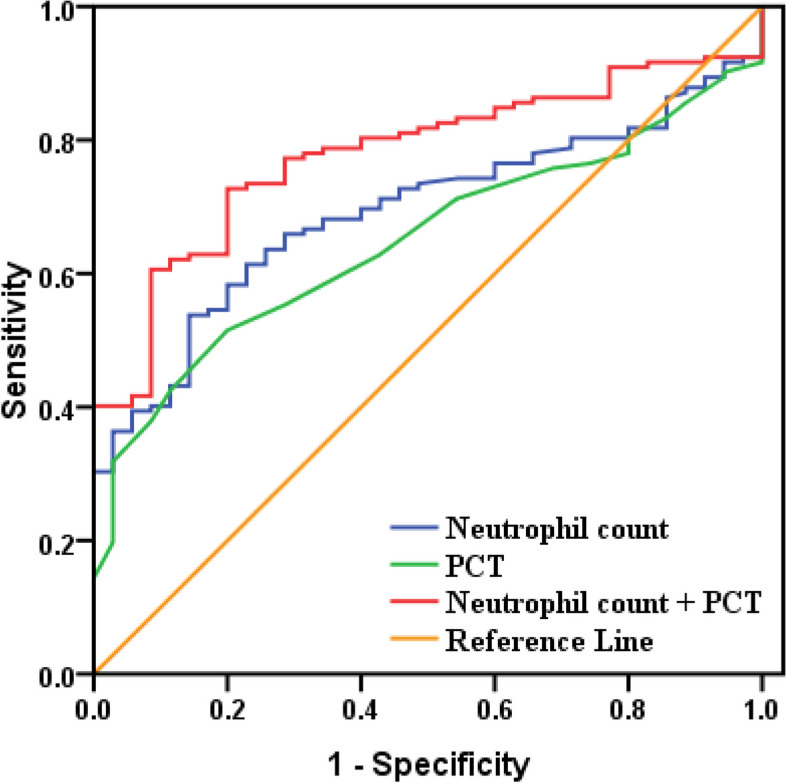
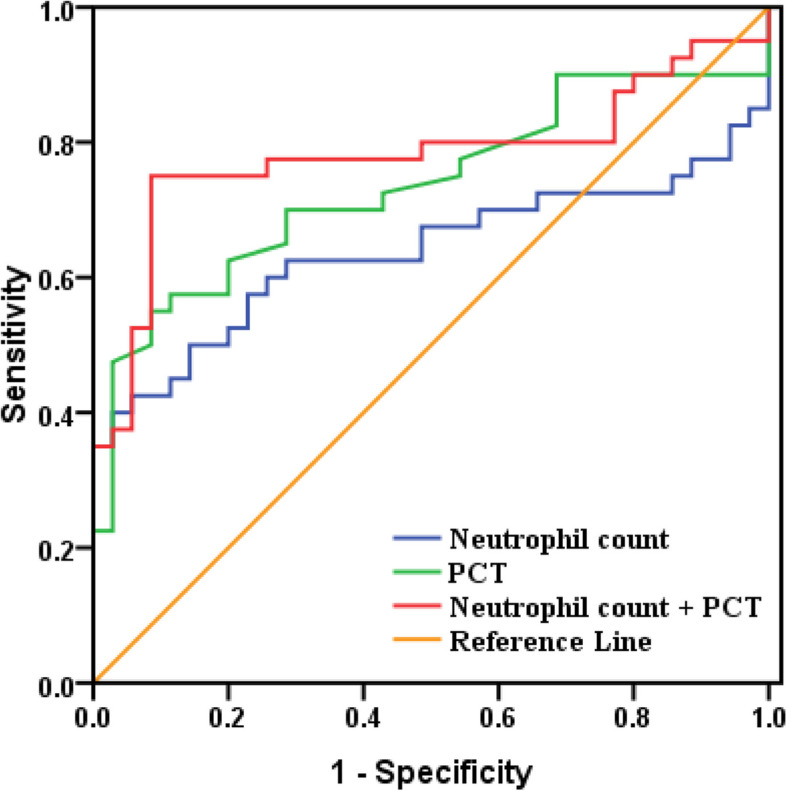
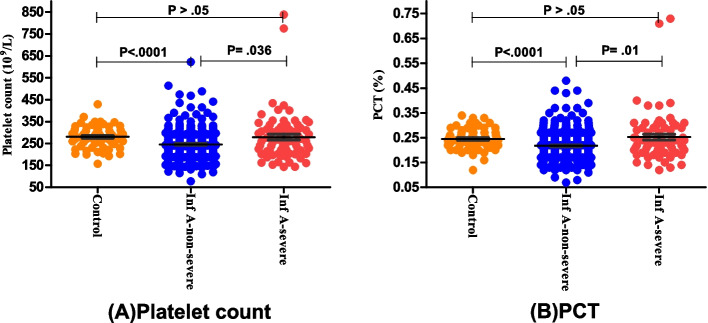
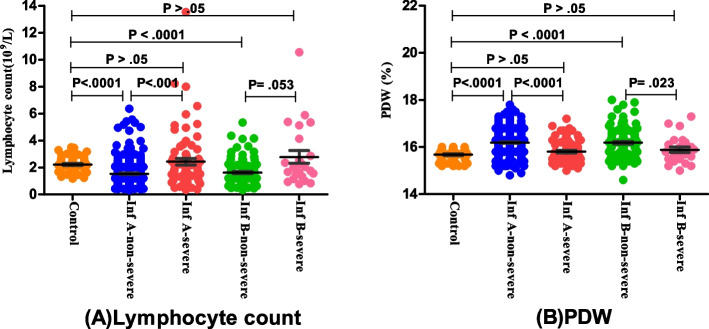
Methods: Baseline characteristics and laboratory results were collected and analyzed. Receiver operating characteristic (ROC) curve analysis was used to joint detection of inflammatory markers for influenza positive children, and the scatter-dot plots were used to compare the differences between severe and non-severe group.

Results: Influenza B positive children had more bronchitis and pneumonia (P < 0.05), influenza A infected children had more other serious symptoms (P = 0.007). Neutrophil count, lymphocyte count, neutrophil-to-lymphocyte ratio (NLR), and platelet parameters performed differently among < 4 years and ≥ 4 years children with influenza. Combined detection of platelet parameters and other indicators could better separate healthy children from influenza infected children than single indicator detection. The levels of platelet distribution width of children with severe influenza (A and B) infection was significantly dropped, compared with non-severe group (P < 0.05).

Conclusions: Platelet distribution width could be a very useful and economic indicator in distinction and severity assessment for children with influenza.

Keywords: Influenza; Neutrophil-to-lymphocyte ratio; Platelet distribution width; Platelet parameters; Severity assessment.


Conflict of interest statement

The authors declare no competing interests.

Figures

Fig. 1
Fig. 1
Comparison of age for children with non-severe and severe Influenza infection. Error bars indicate the mean and standard deviation of age of non-severe group and severe group for children with Influenza A (A) and Influenza B (B)
Fig. 2
Fig. 2
ROC curve of PDW and NLR for children with Influenza A(≥4 years). When the detection of PDW alone, the area under the ROC curve was 0.853 (95% CI: 0.808–0.898; P < 0.05). When the detection of NLR alone, the area under the ROC curve was 0.940(95% CI: 0.913–0.968; P < 0.05). When the combined detection of them, the area under the ROC curve was 0.954 (95% CI: 0.930–0.978; P < 0.05)
Fig. 3
Fig. 3
ROC curve of Platelet count and Lymphocyte count for children with Influenza B(≥4 years). When the detection of Lymphocyte count alone, the area under the ROC curve was 0.870(95% CI: 0.811–0.929; P < 0.05). When the detection of Platelet count alone, the area under the ROC curve was 0.879 (95% CI: 0.810–0.949; P < 0.05). When the combined detection of them, the area under the ROC curve was 0.933 (95% CI: 0.888–0.978; P < 0.05)
Fig. 4
Fig. 4
ROC curve of Neutrophil count and PCT for children with Influenza A(< 4 years). When the detection of PCT alone, the area under the ROC curve was 0.649 (95% CI: 0.564–0.734; P < 0.05). When the detection of Neutrophil count alone, the area under the ROC curve was 0.692(95% CI: 0.611–0.773; P < 0.05). When the combined detection of them, the area under the ROC curve was 0.779 (95% CI: 0.707–0.851; P < 0.05)
Fig. 5
Fig. 5
ROC curve of Neutrophil count and PCT for children with Influenza B(< 4 years). When the detection of PCT alone, the area under the ROC curve was 0.735 (95% CI: 0.619–0.851; P < 0.05). When the detection of Neutrophil count alone, the area under the ROC curve was 0.637(95% CI: 0.505–0.770; P < 0.05). When the combined detection of them, the area under the ROC curve was 0.781 (95% CI: 0.669–0.894; P < 0.05)
Fig. 6
Fig. 6
Comparison of laboratory indicators among children with Influenza A. Scatter-dot plots showing the levels of Platelet count (A) and PCT (B) among control group, non-severe group, and severe group. Error bars in the scatter-dot plots indicate the mean and standard deviation. Inf:Influenza
Fig. 7
Fig. 7
Comparison of laboratory indicators among children with Influenza. Scatter-dot plots showing the levels of Lymphoctye count (A) and PDW (B) among control group, non-severe group, and severe group. Error bars in the scatter-dot plots indicate the mean and standard deviation. Inf:Influenza

Similar articles

References

    1. World Health Organization. Up to 650000 people died of respiratory diseases linked to seasonal FLU each year [EB/OL]. [2017-12-14].
    1. Timothy MU, David SH, Maria Z, David EW, Arnold SM. Influenza. Lancet. 2022;400(10353):693–706. doi: 10.1016/S0140-6736(22)00982-5. - DOI - PMC - PubMed
    1. Iuliano AD, Roguski KM, Chang HH, Schanzer D, Park M, Krishnan A, et al. Estimates of global seasonal influenza-associated respiratory mortality: a modelling study. Lancet. 2018;391:1285–1300. doi: 10.1016/S0140-6736(17)33293-2. - DOI - PMC - PubMed
    1. Paules C, Subbarao K. Influenza. Lancet. 2017;390:697–708.5. doi: 10.1016/S0140-6736(17)30129-0. - DOI - PubMed
    1. Bautista E, Chotpitayasunondh T, Gao Z, Harper SA, Shaw M, Uyeki TM, et al. Clinical aspects of pandemic 2009 influenza A (H1N1) virus infection. N Engl J Med. 2010;362:1708–1719. doi: 10.1056/NEJMra1000449. - DOI - PubMed