. 2024 Jan 2;22(1):1.
doi: 10.1186/s12964-023-01388-7.

Macrophages reprogramming driven by cancer-associated fibroblasts under FOLFIRINOX treatment correlates with shorter survival in pancreatic cancer

Affiliations

Macrophages reprogramming driven by cancer-associated fibroblasts under FOLFIRINOX treatment correlates with shorter survival in pancreatic cancer

Zainab Hussain et al. Cell Commun Signal. .

Abstract

Background: Pancreatic ductal adenocarcinoma (PDAC) remains a clinically challenging cancer, mainly due to limited therapeutic options and the presence of a highly prominent tumor microenvironment (TME), facilitating tumor progression. The TME is predominated by heterogeneous populations of cancer-associated fibroblasts (CAFs) and tumor associated macrophages (TAMs), in constant communication with each other and with tumor cells, influencing many tumoral abilities such as therapeutic resistance. However how the crosstalk between CAFs and macrophages evolves following chemotherapeutic treatment remains poorly understood, limiting our capacity to halt therapeutic resistance.

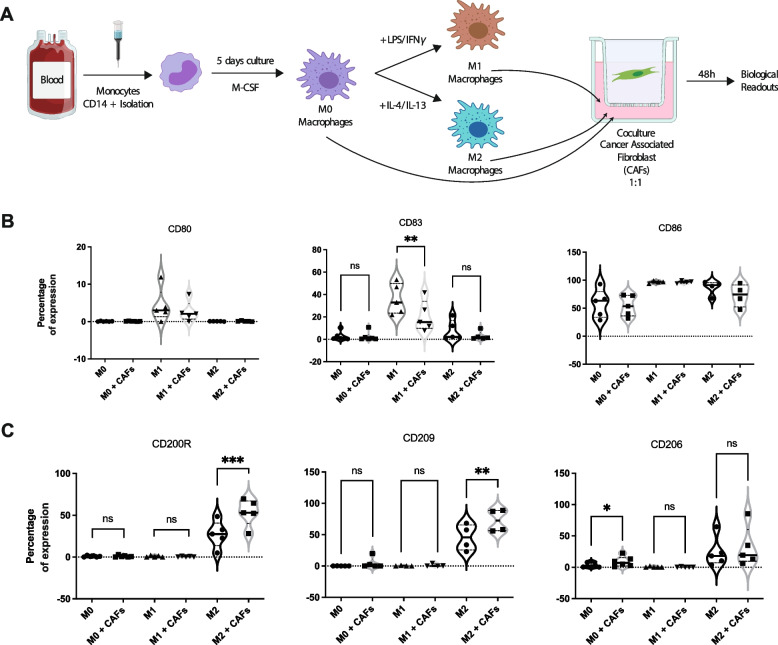
Methods: We combined biological characterization of macrophages indirectly cocultured with human PDAC CAFs, under FOLFIRINOX treatment, with mRNAseq analyses of such macrophages and evaluated the relevance of the specific gene expression signature in a large series of primary PDAC patients to search for correlation with overall survival (OS) after FOLFIRINOX chemotherapy.

Results: Firstly, we demonstrated that CAFs polarize naïve and M1 macrophages towards an M2-like phenotype with a specific increase of CD200R and CD209 M2 markers. Then, we demonstrated that CAFs counteract the pro-inflammatory phenotype induced by the FOLFIRINOX on Macrophages. Indeed, we highlighted that, under FOLFIRINOX, CAFs limit the FOLFIRINOX-induced cell death of macrophages and further reinforce their M2 phenotype as well as their immunosuppressive impact through specific chemokines production. Finally, we revealed that under FOLFIRINOX CAFs drive a specific macrophage gene expression signature involving SELENOP and GOS2 that correlates with shortened OS in FOLFIRINOX-treated PDAC patients.

Conclusion: Our study provides insight into the complex interactions between TME cells under FOLFIRINOX treatment. It suggests potential novel candidates that could be used as therapeutic targets in combination with FOLFIRINOX to prevent and alleviate TME influx on therapeutic resistance as well as biomarkers to predict FOLFIRINOX response in PDAC patients. Video Abstract.

Keywords: Chemoresistance; FOLFIRINOX; Intercellular communication; Pancreatic cancer; Tumor-associated macrophages; cancer-associated fibroblasts.


Conflict of interest statement

The authors declare no competing interests.

Figures

Fig. 1
Fig. 1
Phenotyping of polarized macrophages M0, M1, and M2 in monoculture or coculture with PDAC CAFs. A Schematic depiction of experimental protocol. B Expression of M1 markers CD80, CD83 and CD86 in macrophages with or without CAFs. C Expression of M2 markers CD200R, CD209, and CD206 in macrophages with or without CAFs. Significant differences in expression with p-values < 0.0001 ****, < 0.001 ***, < 0.01 **, and < 0.05 * are indicated
Fig. 2
Fig. 2
Phenotyping of polarized M1 and M2 macrophages cocultured with PDAC CAFs under FOLFIRINOX treatment. A Schematic depiction of experimental protocol. B M1 macrophage markers, CD80, CD83 and CD86, expression in M1 macrophages with or without CAFs coculture and with or without FOLFIRINOX treatment. C M2 macrophage markers, CD200R, CD209, and CD206, expression in M2 macrophages with or without CAFs coculture and with or without FOLFIRINOX treatment. D Fold change of percentage of expression of CD200R, CD209, and CD206 between M2 macrophages cocultured with CAFs vs. monoculture M2 macrophages, and M2 macrophages treated with FOLFIRINOX and cocultured with CAFs vs. M2 macrophages treated with FOLFIRINOX in monoculture. Significant differences in expression with p-values < 0.0001 ****, < 0.001 ***, < 0.01 **, and < 0.05 * are indicated
Fig. 3
Fig. 3
M2 macrophage viability, phagocytosis, and secretory profile in monoculture or coculture with PDAC CAFs under FOLFIRINOX treatment. A Expression of dead/dying-cell marker, cytotox green fluorescent protein, in M2 macrophages over 48 hours by Incucyte live-imaging. B Integrated green fluorescence intensity of cytotox protein at 48 hours in M2 macrophages. C Representative images of cytotox fluorescence in untreated, monoculture M2 macrophages, FOLFIRINOX-treated monoculture M2 macrophages, untreated CAF-cocultured M2 macrophages, and FOLFIRINOX-treated CAF-cocultured M2 macrophages with indicated scale at 2 days. D Phagocytosis of green fluorescent E.coli bioparticles measured by integrated green fluorescence intensity in M2 macrophages over 2 hours. E Integrated green fluorescence intensity of E.coli bioparticles in M2 macrophages at 2 hours. F Comparison of fold changes of phagocytosis capacity between M2 macrophages cocultured with CAFs vs. M2 macrophages in monoculture and M2 macrophages cocultured with CAFs treated with FOLFIRINOX vs. M2 macrophages cocultured with CAFs untreated. G Representative images of fluorescent E.coli bioparticle uptake in M2 macrophages in conditions as described in (C) at 105 minutes. H Heat map of fold-change of concentration (pg/mL) of 27 cytokines/chemokines in M2 macrophages measured using multiplex ELISA. I Comparison of fold changes of cytokine and chemokine concentrations between M2 macrophages cocultures with CAFs vs. M2 macrophages in monoculture and M2 macrophages cocultured with CAFs treated with FOLFIRINOX vs. M2 macrophages cocultured with CAFs untreated. Significant differences in expression with p-values < 0.0001 ****, < 0.001 ***, < 0.01 **, and < 0.05 * are indicated
Fig. 4
Fig. 4
RNA sequencing analysis of M2 macrophages cocultured with PDAC CAFs and/or treated with FOLFIRINOX. Volcano plots of differential gene expression between (A) M2 macrophages and M2 macrophages cocultured with CAFs (B) M2 macrophages treated with FOLFIRINOX vs. untreated (C) M2 macrophages treated with FOLFIRINOX in monoculture vs. in coculture with CAFs (D) M2 macrophages in cocultures with CAFs treated and untreated with FOLFIRINOX. Genes were considered significantly differentially regulated if p-value < 0.05 and log2fold-change > 1. E Heat map of group “0” showing log2-fold changes in M2 macrophages vs. M2 macrophages cocultured with CAFs and log2-fold changes in M2 macrophages treated with FOLFIRINOX in mono- or cocultures with CAFs
Fig. 5
Fig. 5
Analysis in clinical PDAC samples of expression of 10 under genes differentially expressed in macrophage under impact of CAFs and FOLFIRINOX treatment. A Bar graph indicating the log2-fold change of the top 10 genes from group “0”. B Left: Univariate analyses for OS in the whole population for the 10 genes. Right: Kaplan-Meier OS curves according to “high” and “low” mRNA expression in the whole population for the five significant genes. C Univariate analysis for OS and the five significant genes in two sub-populations: patients without any post-operative chemotherapy (“CT none”) and patients with delivery of post-operative FOLFIRINOX chemotherapy (“CT + FOLFIRINOX”). D Kaplan-Meier OS curves according to combined “high” and “low” mRNA expression of SELENOP and GOS2 in the sub-population treated by post-operative FOLFIRINOX chemotherapy. E Comparison of prognostic information (OS) of the 2-gene model versus each 1-gene models in the sub-population treated by post-operative FOLFIRINOX chemotherapy. F Multivariate analysis for OS in the sub-population treated by post-operative FOLFIRINOX chemotherapy

Similar articles

Cited by

References

    1. Sung H, Ferlay J, Siegel RL, Laversanne M, Soerjomataram I, Jemal A, et al. Global Cancer statistics 2020: GLOBOCAN estimates of incidence and mortality worldwide for 36 cancers in 185 countries. CA Cancer J Clin. 2021;71:209–249. doi: 10.3322/caac.21660. - DOI - PubMed
    1. Grant TJ, Hua K, Singh A. Molecular pathogenesis of pancreatic Cancer. Prog Mol Biol Transl Sci. 2016;144:241–275. doi: 10.1016/bs.pmbts.2016.09.008. - DOI - PMC - PubMed
    1. Shinde RS, Bhandare M, Chaudhari V, Shrikhande SV. Cutting-edge strategies for borderline resectable pancreatic cancer. Ann Gastroenterol Surg Japan. 2019;3:368–372. doi: 10.1002/ags3.12254. - DOI - PMC - PubMed
    1. Principe DR, Korc M, Kamath SD, Munshi HG, Rana A. Trials and tribulations of pancreatic cancer immunotherapy. Cancer Lett Ireland. 2021;504:1–14. doi: 10.1016/j.canlet.2021.01.031. - DOI - PMC - PubMed
    1. Principe DR, Underwood PW, Korc M, Trevino JG, Munshi HG, Rana A. The current treatment paradigm for pancreatic ductal adenocarcinoma and barriers to therapeutic efficacy. Front Oncol. 2021;11:1–25. doi: 10.3389/fonc.2021.688377. - DOI - PMC - PubMed

Publication types

MeSH terms