. 2024 Jan 2;15(1):189.
doi: 10.1038/s41467-023-43794-y.

Midbrain node for context-specific vocalisation in fish

Affiliations

Midbrain node for context-specific vocalisation in fish

Eric R Schuppe et al. Nat Commun. .

Abstract

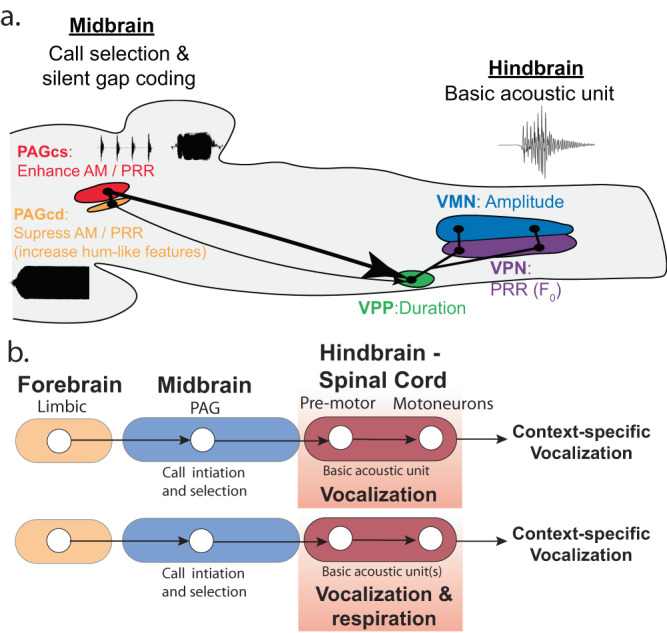
Vocalizations communicate information indicative of behavioural state across divergent social contexts. Yet, how brain regions actively pattern the acoustic features of context-specific vocal signals remains largely unexplored. The midbrain periaqueductal gray (PAG) is a major site for initiating vocalization among mammals, including primates. We show that PAG neurons in a highly vocal fish species (Porichthys notatus) are activated in distinct patterns during agonistic versus courtship calling by males, with few co-activated during a non-vocal behaviour, foraging. Pharmacological manipulations within vocally active PAG, but not hindbrain, sites evoke vocal network output to sonic muscles matching the temporal features of courtship and agonistic calls, showing that a balance of inhibitory and excitatory dynamics is likely necessary for patterning different call types. Collectively, these findings support the hypothesis that vocal species of fish and mammals share functionally comparable PAG nodes that in some species can influence the acoustic structure of social context-specific vocal signals.


Conflict of interest statement

The authors declare no competing interests.

Figures

Fig. 1
Fig. 1. Vocal diversity in fishes and tetrapods.
Despite the diversity of vocal organs among vertebrate lineages, e.g., sonic swim bladder, syrinx and larynx, the available evidence suggests shared patterns of vocal-acoustic features. Shown here are oscillogram traces of plainfin midshipman fish grunt train (Porichthys notatus, focal species of current study), estrildid finch song (Lonchura striata domestica) song, Japanese quail call (Coturnix japonica, other Aves; from xeno-canto [XC266707]; recordist: Albert Lastukhin), house mouse ultrasonic vocalisations (Mus musculus; from DeepSqueak), and squirrel monkey caw (Saimiri sciureus). Animal sillouttes are from PhyloPic (creative commons).
Fig. 2
Fig. 2. Courtship and agonistic calling differentially activates midbrain periaqueductal gray (PAG).
ac Male midshipman (Porichthys notatus) produce three, acoustically distinct vocalisations during the breeding season. Scale bars = 500 ms for ac. d Midshipman vocal motor network, sagittal view. Abbreviations: PAG rostral (r) and caudal (c) zones; preoptic area, POA; vocal motor (VMN), vocal pacemaker (VPN) and vocal prepacemaker (VPP) nuclei ventral tuberal hypothalamus, vT. ei, eii Nissl-stained, coronal sections illustrating PAG zones (rostral and caudal superficial: rs, cs; caudal deep, cd; levels indicated in d); fi, fii are higher magnification views of ei and eii, respectively. Scale bars = 250 µm for fi, fii. LL lateral lemniscus, MLF medial longitudinal fasciculus, nLV nucleus lateralis valvulae, PAGm medial PAG, TeM midbrain tectum, Pe periventricular layer of auditory division of torus semicircularis, PTT paratoral tegmentum, PTT. g Male inside an artificial nest; photograph taken during lights-on to maximise clarity of the housing conditions. h Nesting male presented with 3-D printed model of midshipman male, picture taken at “night” under red light conditions. hi Photograph of male in the nest taken with a front facing camera. i Bar plots (mean ± SEM) illustrating number of c-fos mRNA expressing cells in PAGrs (ANOVA: p = 0.24; see table S2), PAGcs (ANOVA: p = 1.579e-05) and PAGcd (ANOVA: p = 0.0001) in silent (n = 5 animals), silent and hearing (n = 3), courtship calling (n = 8) and agonistic calling (n = 6) males. *denotes significant BH corrected post-hoc differences for Analysis of Variance (ANOVA) tests, p < 0.05. jm Relationship of call number to c-fos expressing cell number in PAGcs and PAGcd. Solid trend lines denote significant relationships p < 0.05 (see table S2 for statistics ). np Representative staining of c-fos mRNA (green) in PAGcs and PAGcd (see Fig. S3 for PAGrs). Scale bars = 250 µm. ni, ii, oi, ii, pi, ii Scale bars = 50 µm.
Fig. 3
Fig. 3. Vocal and non-vocal activation of PAG neurons.
a Experimental timing for catFISH (cellular Compartment Analysis of Temporal activity by Fluorescence In Situ Hybridization) experiments: initial 5 min behavioural period followed by 30 min break and second 5 min behavioural period. bd Representative combinations of catFISH behavioural paradigms performed by male midshipman fish (n = 5/condition): only courtship (b) or agonistic (c) calling or courtship followed by agonistic calling (d). e Schematic of labelling patterns for cells only activated in period 1 (predominantly cytoplasmic) or 2 (predominantly nuclear, intronic), or in both 1 and 2 (nuclear and cytoplasmic). f Plots (mean ± SEM) illustrating number of c-fos intron expressing cells within the PAGcs (ANOVA: p = 3.272e-07) and PAGcd (ANOVA: p = 1.101e-05). Asterisk in f denotes significant BH corrected post hoc differences (p < 0.05, ANOVA). g Plot illustrating the reactivation index (percent of cells (mean ± standard error) activated in second behavioural period (nuclear c-fos intron signal) that were activated during the first period (cytoplasmic c-fos coding signal)) in PAGcs (ANOVA: p = 6.782e-10; n = 5 animals/condition) and PAGcd (ANOVA: p = 1.262e-07). ho Representative confocal images of PAGcs and PAGcd in different behavioural conditions. Dashed white boxes in lower magnification images (h, j, l) illustrate location of inserts showing examples of intron (red), cytoplasmic (green) and SYTOX nuclear (blue) labelling. Orange and purple boxes exhibit examples of nuclear only labelling (ni, oi; second behaviour only) or cytoplasmic and nuclear labelling (nii, oii). Scale bars = 250 µm. n, o Representative combinations of catFISH behavioural paradigms to investigate involvement of vocal PAGcs and PAGcd neurons in a non-vocal behaviour, foraged twice (n = 4, p) or foraged once followed by agonistic calling (n = 3, q). r Plots (mean ± standard error) illustrating number of c-fos intron expressing cells within the PAGcs (two tailed t-test: p = 0.03) and PAGcd (two tailed t-test: p = 0.01), n = 4/foraging-foraging; n = 3/foraging-agonistic calling. s Plots (mean ± SEM) illustrating percent of neurons activated in second behaviour period that were also activated during the first period. Asterisk in r, s denotes significant condition differences (p < 0.05, two tailed t-test). A detailed summary of statistics is presented in Table S2.
Fig. 4
Fig. 4. Glutamate (GLU) activation of caudal periaqueductal gray (PAG) generates full range of natural-like fictive calls.
ad Similar acoustic features between natural and fictive calls were measured, and dimensionality was reduced using UMAP (Uniform Manifold Approximation and Projection) analyses. UMAP plots illustrating how recordings of fictive grunts (a, b) or growls (c, d) evoked following GLU microinjections in the PAGcs (red) or PAGcd (yellow) overlap natural calls (green) elicited during simulated intrusions using a 3-D model midshipman (Fig. 2g, h). Boxes illustrate representative recordings of natural and fictive calls also shown that were adjacent to each other on UMAP plots. ej Statistical comparisons and box plots of key acoustic features that define grunts and growls, including duration (e [grunt: LMM: p = 0.39], h [growl: LMM: p = 0.52]), coefficient of variation (CV) in pulse repetition rate (PRR; f [grunt: LMM: p = 0.02], i [growl: LMM: p = 0.008]), and amplitude (AMP; g [grunt: LMM: p = 0.0003], j [growl: LMM: p = 0.01) between natural (grunt: n = 119 calls across 11 animals; growl:41 calls across 8 animals), GLU-evoked PAGcs (grunt: 525 calls across 7 animals; growl:137 calls across 4 animals), and GLU-evoked PAGcd (grunt:1882 calls across 7 animals; growl: 82 calls across 7 animals). In box plots, the centre line indicates the median, the edges of the box represent the first and third quartiles, and the whiskers extend to span a 1.5 interquartile range from the edges, and individual dots are points that fall outside this range. *denotes significant post-hoc differences (p < 0.05, from linear mixed model analyses); n.s. denotes no significant difference between groups. km Representative example of a natural courtship hum (k) and those evoked following GLU injection into PAGcs (l) or PAGcd (m). All fictive hums exhibited similar features to natural hums. A detailed summary of statistics is presented in Table S2.
Fig. 5
Fig. 5. Removing inhibition of caudal periaqueductal gray (PAG) neurons does not generate full range of natural-like fictive calls.
a, b Similar acoustic features between natural and fictive calls were measured, and dimensionality was reduced using UMAP (Uniform Manifold Approximation and Projection) analyses. UMAP plots (top) illustrating how gabazine-evoked fictive grunts (a) or growls (b) from the PAGcs (blue) or PAGcd (purple) overlap natural calls (green). Orange boxes illustrate representative recordings of natural and fictive calls also shown that were adjacent to each other on the UMAP plots. ch Statistical comparisons and box plots of key acoustic features that define grunts and growls, including duration (c [grunt: LMM: p = 0.02], f [growl: LMM: p = 0.04]), coefficient of variation (CV) in pulse repetition rate (PRR; d [grunt: LMM: p = 0.40], g [growl: LMM: p = 0.61]), and amplitude (AMP; e [grunt: LMM: p = 0.0008], h [growl: LMM: p = 0.0006]) between natural (grunt: n = 119 calls across 11 animals; growl:41 calls across 8 animals), Gabazine-evoked PAGcs (grunt: 181 calls across 3 animals; growl:11 calls across 2 animals), and Gabazine-evoked PAGcd (grunt:467 calls across 3 animals; growl: 154 calls across 3 animals. In box plots, the centre line indicates the median, the edges of the box represent the first and third quartiles, and the whiskers extend to span a 1.5 interquartile range from the edges, and individual dots are points that fall outside this range. *denotes significant post-hoc differences after BH correction (p < 0.05); n.s. denotes no significant difference between groups. A detailed summary of statistics is presented in Table S2.
Fig. 6
Fig. 6. Glutamate (GLU) modulation of vocal hindbrain.
a Neurobiotin-filled VPP neurons ~75 µm caudal to VPP injection site. b Locations of GLU-neurobiotin injections into VPP (red circles) White circles illustrate non-vocal sites that missed VPP (n = 2 animals) and showed no label in VMN or PAG. c Super-resolution image of neurobiotin-filled VPP neurons labelled with VGLUT (red) and a post-synaptic marker for glutamatergic neurons (PSD-95, blue). (ci is high magnification of region outlined withwhite box in c). Scale bars = 10 µm (a), 1 µm (ai). d, e Box plots comparing fictive call duration (d; two-tailed t-test: p = 0.0003) and latency to start calling (e; two-tailed t-test: p = 0.04) following GLU-VPP injection (n = 3) or periaqueductal gray (PAG) (n = 4). * denote significant differences. f Fictive calls recorded from vocal nerve (VN) following GLU injection in PAG (top) or VPP (bottom). Blue boxes in upper record indicate location of lower records of unstructured growls and grunt trains produced following GLU-VPP injection compared to structured ones following GLU-PAG injection. Scale bars = 1 s. g Natural, GLU-PAG and GLU-VPP bouts of grunts. Scale bar = 1 sec. h Average inter-grunt interval (±SD) for natural and GLU evoked bouts of grunts (5–7 grunts/bout; n = 6 natural; 7 GLU-PAGcs; 4 GLU-VPP). i, j UMAP plots illustrating how individual GLU-VPP (grey), fictive grunt-like (i) and growl-like calls (j) overlap natural calls (green). kp Statistical comparisons and box plots of key features defining grunts and growls: duration (k[grunt: LMM: p = 0.47], n[growl: LMM: p = 0.01]), coefficient of variation (CV) in pulse repetition rate (PRR; l[grunt:LMM: p = 0.59], o[growl: LMM: p = 0.06]), and amplitude (AMP; m[grunt: LMM: p = 0.38], p[growl: LMM: p = 0.17]) between natural (grunt n = 119 calls /11 animals; growl n = 41 calls/ 8 animals) GLU-VPP (grunt: 116 calls/3 animals; growl:26 calls/3 animals). Box plots: centre line indicates median edges represent first and third quartiles; whiskers extend to span a 1.5 interquartile range from edges; individual dots are points falling outside range. *denotes significant post-hoc differences (p < 0.05); n.s. denotes no significant difference between groups.
Fig. 7
Fig. 7. A conserved midbrain periaqueductal gray (PAG) node for social context-specific vocalisation.
a Sagittal brain drawing for midshipman fish summarises proposed roles of the caudal superficial (cs) and deep (cd) PAG zones in generating social context-specific vocal output (current study), and how hindbrain-spinal vocal prepacemaker (VPP), pacemaker (VPN), and motor (VMN) nuclei shape acoustic features of grunts (see ). b PAG stimulation via glutamate or excitatory amino acids leads to vocal output in fish (current study) and mammals (see Discussion). Schematic drawing of proposal that the PAG activates one or more hindbrain-spinal motor populations driving vocalisation, including those for respiration, a major character distinguishing mammals from fishes given the dependence of vocalisation among most tetrapods on respiration. Hindbrain-spinal motor populations in toadfishes (e.g., midshipman fish) and mammals (e.g., see,) are proposed to refine the properties of clade- or species-typical basic acoustic unit(s), with the PAG selectively reconfiguring the output of one or more units to determine the temporal features of different context-specific vocalisations.

Similar articles

Cited by

References

    1. Chen Z, Wiens JJ. The origins of acoustic communication in vertebrates. Nat. Commun. 2020;11:369. doi: 10.1038/s41467-020-14356-3. - DOI - PMC - PubMed
    1. Rice AN, et al. Evolutionary patterns in sound production across fishes. Ichthyol. Herpetol. 2022;110:1–12. doi: 10.1643/i2020172. - DOI
    1. Jorgewich-Cohen G, et al. Common evolutionary origin of acoustic communication in choanate vertebrates. Nat. Commun. 2022;13:6089. doi: 10.1038/s41467-022-33741-8. - DOI - PMC - PubMed
    1. Subramanian HH, Arun M, Silburn PA, Holstege G. Motor organization of positive and negative emotional vocalization in the cat midbrain periaqueductal gray. J. Comp. Neurol. 2016;524:1540–1557. doi: 10.1002/cne.23869. - DOI - PubMed
    1. Hage SR, Nieder A. Dual neural network model for the evolution of speech and language. Trends Neurosci. 2016;39:813–829. doi: 10.1016/j.tins.2016.10.006. - DOI - PubMed