. 2024 Jan 2;15(1):27.
doi: 10.1038/s41467-023-44301-z.

Non-canonical interplay between glutamatergic NMDA and dopamine receptors shapes synaptogenesis

Affiliations

Non-canonical interplay between glutamatergic NMDA and dopamine receptors shapes synaptogenesis

Nathan Bénac et al. Nat Commun. .

Abstract

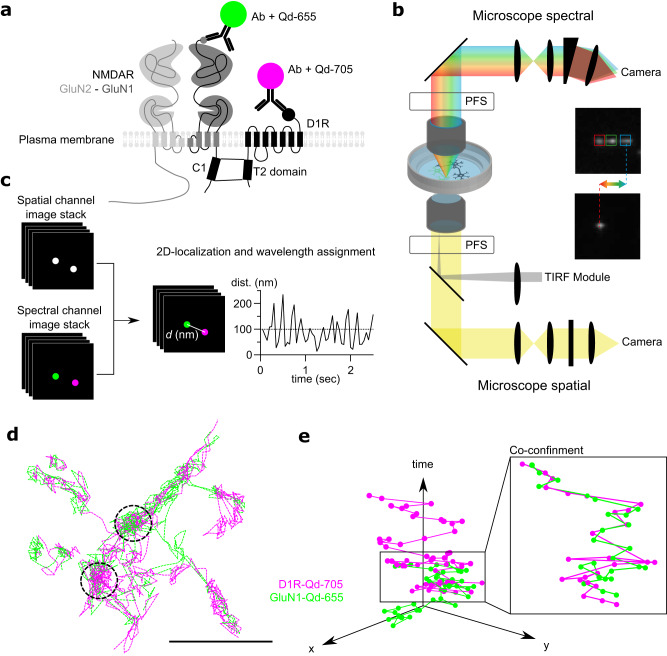
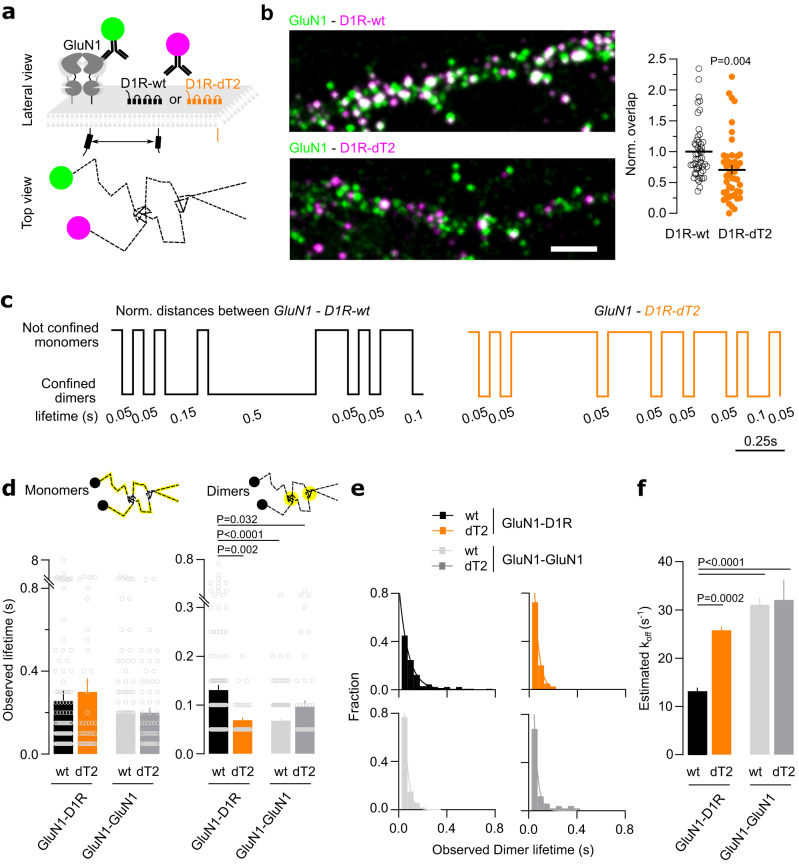
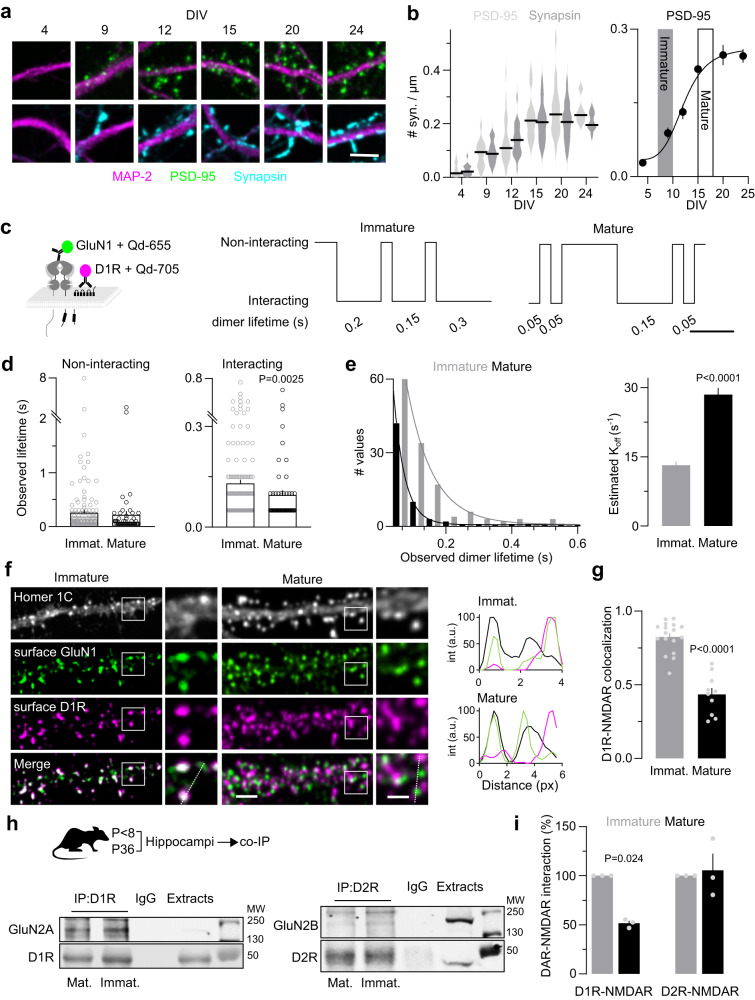
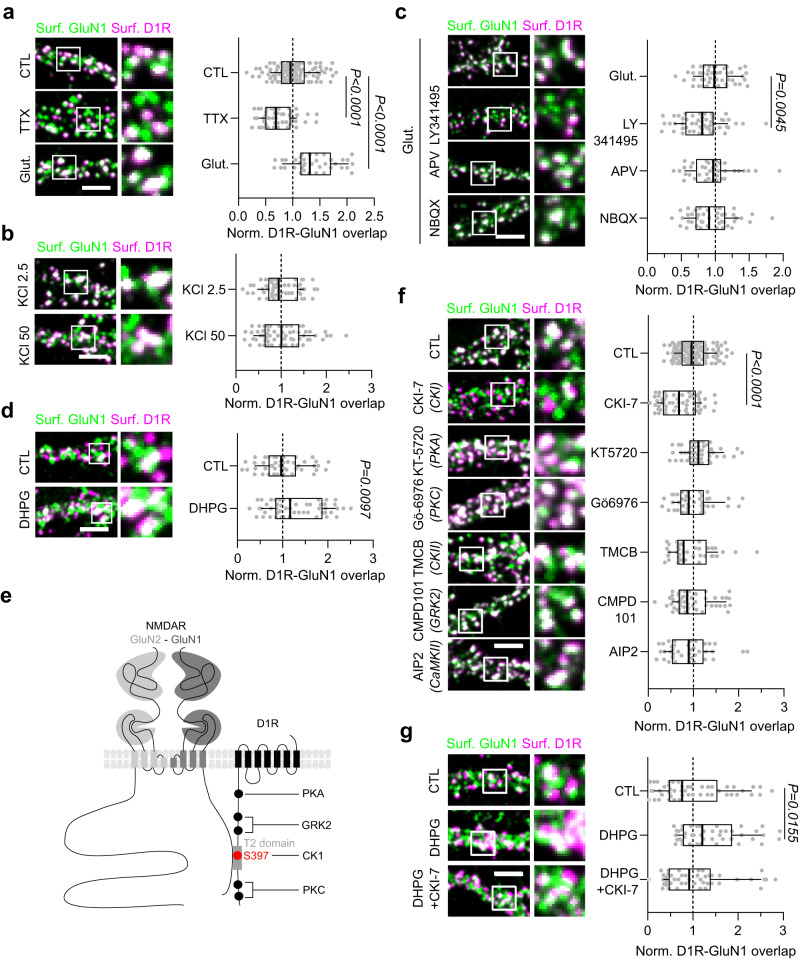
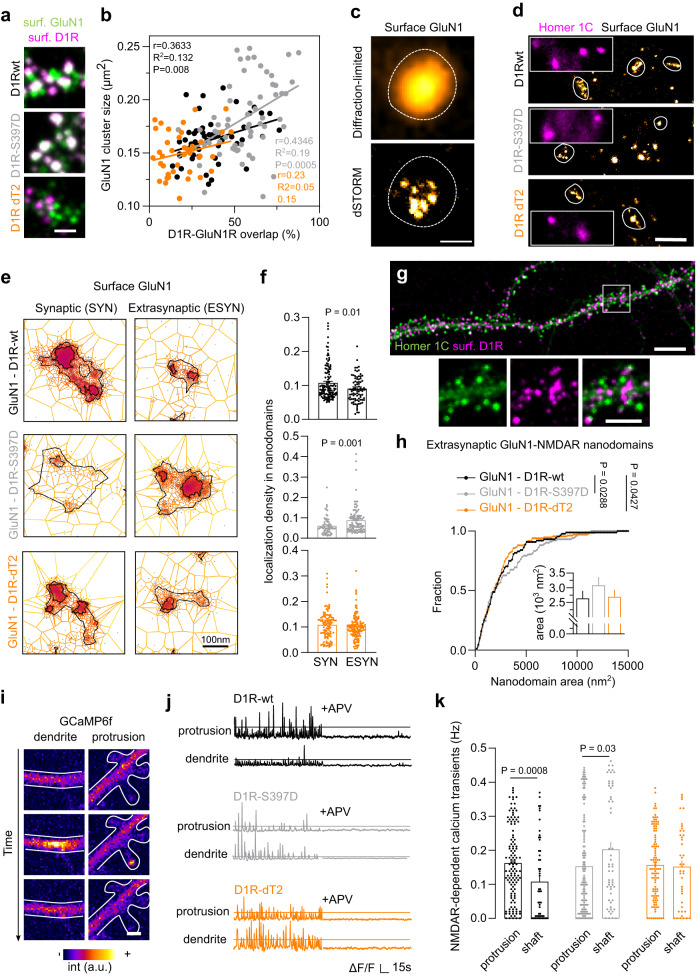
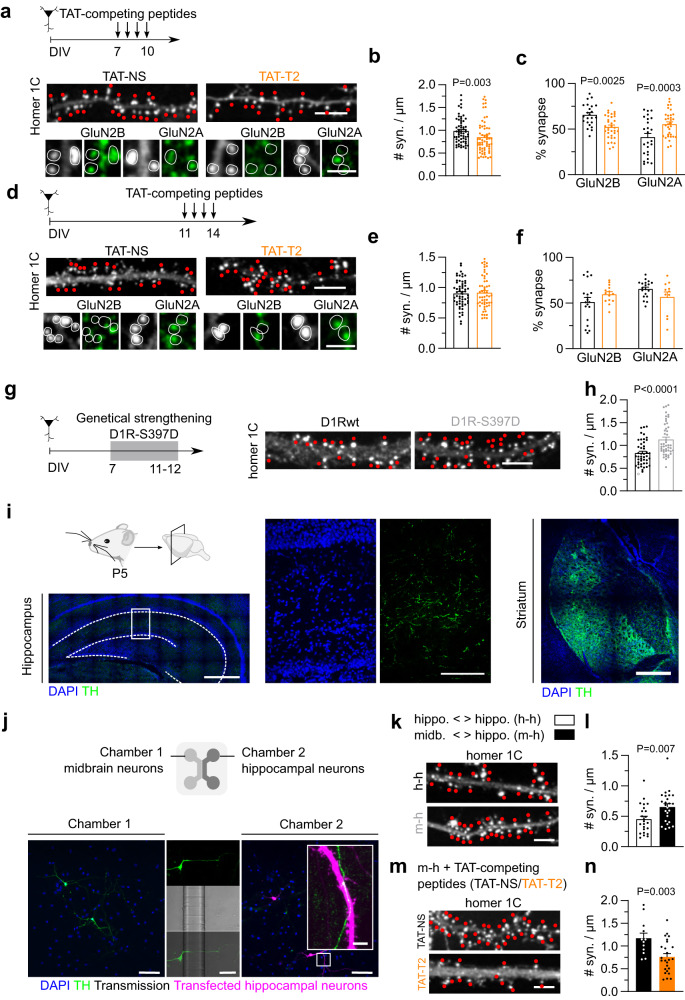
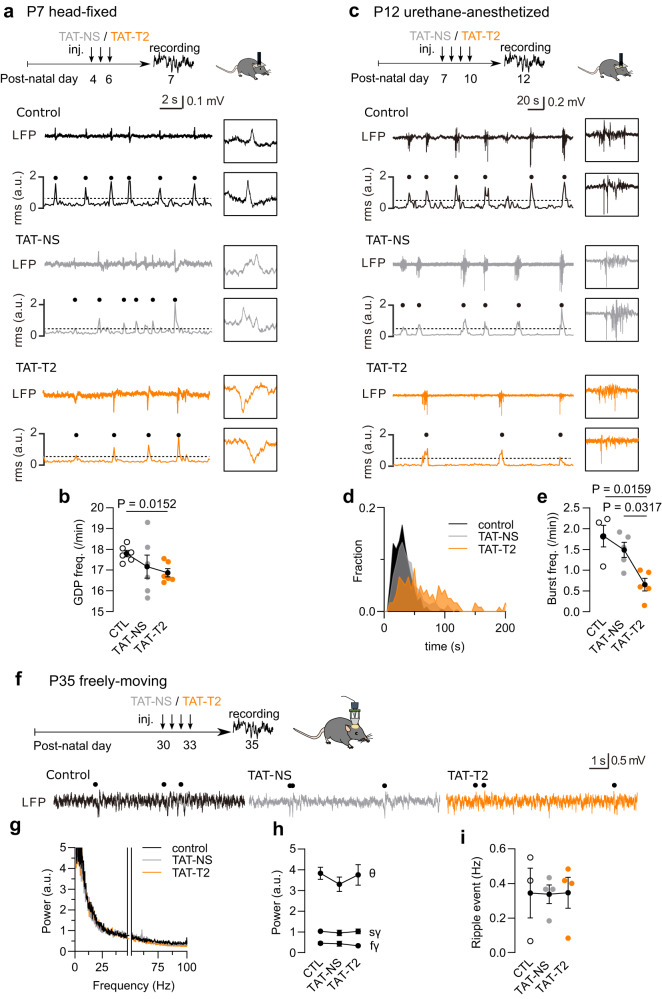
Direct interactions between receptors at the neuronal surface have long been proposed to tune signaling cascades and neuronal communication in health and disease. Yet, the lack of direct investigation methods to measure, in live neurons, the interaction between different membrane receptors at the single molecule level has raised unanswered questions on the biophysical properties and biological roles of such receptor interactome. Using a multidimensional spectral single molecule-localization microscopy (MS-SMLM) approach, we monitored the interaction between two membrane receptors, i.e. glutamatergic NMDA (NMDAR) and G protein-coupled dopamine D1 (D1R) receptors. The transient interaction was randomly observed along the dendritic tree of hippocampal neurons. It was higher early in development, promoting the formation of NMDAR-D1R complexes in an mGluR5- and CK1-dependent manner, favoring NMDAR clusters and synaptogenesis in a dopamine receptor signaling-independent manner. Preventing the interaction in the neonate, and not adult, brain alters in vivo spontaneous neuronal network activity pattern in male mice. Thus, a weak and transient interaction between NMDAR and D1R plays a structural and functional role in the developing brain.


Conflict of interest statement

The authors declare no competing interests.

Figures

Fig. 1
Fig. 1. Multidimensional spectral single molecule localization microscopy (MS-SMLM) principle.
a Experimental design of the single Qd tracking. Receptors were labeled with antibodies directed against extracellular tags. Qd-655 and Qd-705 were used to distinguish receptor types. The interaction between receptors occurs intracellularly at the T2 domain (C1 cassette of the GluN1 subunit). b Microscopy setting to perform MS-SMLM using two microscopes and cameras. PFS: perfect focus system. c SM-SMLM principle. d Representative reconstruction of GuN1-NMDAR and D1R surface diffusion, scale bar, 1 µm. e Example trajectories of one GluN1-NMDAR and one D1R laterally diffusing (x, y) onto the neuronal surface over time.
Fig. 2
Fig. 2. MS-SMLM allows for the direct visualization and qualitative investigation of surface receptor-receptor interaction events in live neurons.
a Experimental design of the surface single Qd tracking of NMDAR and D1R. b Representative images with quantification of the normalized overlap between GluN1-NMDAR-D1R-wt (n = 50 neuronal fields) and GluN1-NMDAR-D1R-dT2 (n = 44 neuronal fields; two-tailed unpaired t-test). Data are presented as mean +/- SEM. Scale bar, 5 µm. c Representative normalized timeline of the distances separating one GluN1 from one D1R-wt or one GluN1 from one D1R-dT2. d Comparison of the average observed lifetime of the receptors (left) in non-confined space (monomeric state) for GluN1-D1R-wt (n = 168 events), GluN1-D1R-dT2 (n = 45), GluN1-GluN1 with D1R-wt (n = 165) or D1R-dT2 (n = 65); (right) in a co-confined space (dimeric state) between GluN1 and D1R-wt (n = 138), GluN1 and D1R-dT2 (n = 40), GluN1 and GluN1 expressed with D1R-wt (n = 159) or D1R-dT2 (n = 50; Kruskal-Wallis with Dunn’s multiple comparisons test). Data are presented as mean +/- SEM. e Distribution and one exponential fit of the interaction events. f Comparison of the estimated Koff, i.e. dissociation rate (One-way ANOVA with Tukey’s multiple comparisons test). Data are presented as mean +/- SEM. Source data are provided as a Source Data file.
Fig. 3
Fig. 3. Increased dopamine-NMDA receptor interaction in immature neurons.
a Representative image of hippocampal dendrites over in vitro development. Dendrites were labeled with MAP-2 (magenta), postsynaptic densities with PSD-95 (green), and presynaptic terminals with synapsin (blue). Scale bar, 5 µm. b (left) Quantification of the number of post-synapses (PSD-95) and pre-synapses (synapsin) at 4 DIV (n = 18 fields for both PSD-95 and synapsin), 9 DIV (n = 17 fields for both PSD-95 and synapsin), 12 DIV (n = 30 fields for PSD-95 and 29 for synapsin), 15 DIV (n = 21 for PSD-95 and 20 for synapsin), 21 DIV (n = 21 for PSD-95 and 20 for synapsin), 24 DIV (n = 11 for both PSD-95 and synapsin). Error bars represent the mean values; (right) non-linear fitting of the number of post-synapses over time, inflection point is at ~12 DIV. Data are presented as mean +/- SEM. c (left) Experimental design. (right) Representative normalized timeline of the distance separating one GluN1 from one D1R in immature and mature neurons. d Comparison of the observed mean lifetime of (left) non-interacting GluN1-NMDAR-D1R in immature (n = 168 events) and mature (n = 55) neurons, (right) individual interacting events between GluN1 and D1R in immature (n = 138) and mature neurons (n = 61; two-tailed Mann-Whitney U test). Data are presented as mean +/- SEM. e Distribution and one exponential fit of the interaction events between GluN1-D1R in immature and mature neurons with estimated Koff (two-tailed unpaired t-test). Data are presented as mean +/- SEM. f Representative images of hippocampal dendrites on which surface GluN1-NMDAR (green), D1R (magenta), and Homer 1 C (white) were imaged in immature and mature neurons alongside corresponding intensity plots. Scale bar, 5 and 2 µm. g Quantification of the colocalization between D1R and GluN1-NMDAR in immature (n = 17 cells) and mature (n = 10 cells) neurons (two-tailed unpaired t-test). Data are presented as mean +/- SEM. h Experimental set-up and immunoblots. i Densitometric analysis of the levels of GluN2A and GluN2B co-immunoprecipitated by antibody directed towards D1R or D2R, respectively. The levels of D1R-NMDAR interaction were considered as the ratio of NMDAR co-IP with D1R-IP. Results are normalized to P8, 3 animals per condition (One-way ANOVA with Tukey’s post hoc test). Data are presented as mean +/- SEM. Source data are provided as a Source Data file.
Fig. 4
Fig. 4. GluN1-D1R interaction is activity-dependent and increased by the phosphorylation of D1R by casein kinase 1 (CK1).
ad Representative images of hippocampal dendrites on which surface GluN1-NMDAR (green) and D1R (magenta) were labeled after exposures to various pharmacological treatments with respective quantification of D1R-GluN1-NMDAR mean overlap, (a) Buffer (CTL, n = 105 fields), TTX (1 µM, n = 49) and glutamate (50 µM, n = 37); (b) KCl 2.5 mM (CTL, n = 55) or KCl 50 mM (n = 60); (d) Buffer (CTL, n = 47) or DHPG (50 µM, n = 51); (c) glutamate alone (n = 47) or together with APV (50 µM, n = 40), LY-341495 (100 µM, n = 52) or NBQX (2 µM, n = 43) (a, c One-way ANOVA with Dunnett’s post hoc test; b-d, two-tailed unpaired t-test). Scale bar, 5 µm. Results are normalized to CTL (a, b, d) or glutamate (c). e Cartoon illustrating putative D1R phosphorylation sites. f Representative images of hippocampal dendrites on which surface GluN1-NMDAR (green) and D1R (magenta) were labeled after exposures to various kinase inhibitors with respective quantification of the normalized GluN1-NMDAR-D1R mean overlap in control (CTL) condition (n = 126 fields) or following acute treatment with CKI-7 (100 µM, n = 57), KT-5720 (25 µM, n = 49), Gö−6976 (1 µM, n = 41), TMCB (5 µM, n = 37), CMPD101 (1 µM, n = 50) and AIP2 (1 µM, n = 40; One-way ANOVA with Dunnett’s post-hoc test). Scale bar, 5 µm. g Representative images of hippocampal dendrites on which surface GluN1-NMDAR (green) and D1R (magenta) were labeled after treatment with buffer (CTL, n = 48 fields), DHPG alone (50 µM, n = 44) or together with CKI-7 (100 µM, n = 45) with respective quantification of D1R-GluN1-NMDAR mean overlap (One-way ANOVA with Dunnett’s post-hoc test). Scale bar, 5 µm. Data are presented as box-and-whisker plots: line at median, IQR in box, whiskers represent 10–90 percentile. Source data are provided as a Source Data file.
Fig. 5
Fig. 5. Surface interaction with D1R shapes GluN1 nano-organization and clustering.
a Representative image of hippocampal dendrites on which surface GluN1-NMDAR (green) and D1R (magenta) were labeled from D1R-wt, D1R-S397D (grey), or D1R-dT2 (orange) expressing neurons from 3 independent experiments. Scale bar, 2 µm. b Correlation between the size of GluN1-NMDAR cluster and the overlap between GluN1-NMDAR and D1R when co-expressed with D1R-wt, D1R-S397D or D1R-dT2. P-value were calculated using a two-sided t-test. c Example of diffraction-limited and super-resolution images of surface GluN1-NMDAR. Scale bar, 300 nm. d Representative images of super-resolved surface GluN1-NMDAR and diffraction-limited Homer 1 C staining. Scale bar, 1 µm. c, d Representative images from 4 independent experiments. e Representative clustering images obtained with SR-Tesseler software. Scale bar, 100 nm. f Comparison of the density of localizations per nanodomains inside and outside synapses when GluN1 is co-transfected with either D1R-WT (n = 7 cells), D1R-dT2 (n = 7) or D1R-S397D (n = 6; two-tailed Mann-Whitney U test). Data are presented as mean +/- SEM. g Representative immunofluorescence image of surface D1R (magenta) and Homer 1 C (green) from 3 independent experiments. Scale bar, 10 and 5 µm. h Cumulative distribution of the area in nm2 of extra-synaptic GluN1-NMDAR nanodomains synapses when GluN1 is co-transfected with either D1R-WT (n = 88 nanodomains), D1R-dT2 (n = 136 nanodomains) or D1R-S397D (n = 102 nanodomains; two-tailed Kolmogorov-Smirnov test). Bar graphs represent mean +/- SEM. i Representative GCaMP6f-fluorescence images from 3 independent experiments. Scale bar, 2 µm. j Representative NMDAR-mediated Ca2+ signals, scale is 0.05 (D1R-WT and -dT2) or 0.2 (D1R-397D) ΔF/F. k Comparison of the NMDAR-mediated Ca2+-transient frequency in protrusions and dendrite when GluN1 is expressed together with D1R-wt (n = 153 spines and 54 shaft), D1R-S397D (n = 145 spines, 56 shafts) or D1R-dT2 (n = 105 spines, 45 shafts; two-tailed Mann–Whitney U test). Data are presented as mean +/- SEM. Source data are provided as a Source Data file.
Fig. 6
Fig. 6. GluN1-D1R interaction is necessary for synaptogenesis.
a Experimental design of the TAT-competing peptide challenge in developing immature neurons with representative images of hippocampal dendrites on which Homer 1 C cluster (synapses), GluN2A subunit, or GluN2B subunit were labeled in the presence of TAT-NS or TAT-T2 competing peptides. Scale bar, 5 and 1 µm. b Comparison of the number of synapses (e.g. number of Homer 1 C clusters per µm of dendrite) after treatment with TAT-NS (n = 60 fields) or TAT-T2 (n = 62) and (c) the percentage of synapses that are positive for GluN2B (TAT-NS, n = 23; TAT-T2, n = 34) and/or GluN2A (TAT-NS, n = 25, TAT-T2, n = 33; two-tailed Unpaired t-test). Data are presented as mean +/- SEM. Scale bar, 5 and 1 µm. d Experimental design alongside representative images of hippocampal dendrites on which Homer 1 C cluster (synapses), GluN2A subunit, or GluN2B subunit were labeled in the presence of TAT-NS or TAT-T2 competing peptides. Scale bar, 5 and 1 µm. e Comparison of the number of synapses after treatment with TAT-NS (n = 59 fields) or TAT-T2 (n = 55) and (f) the percentage of synapses that are positive for GluN2B (TAT-NS, n = 19; TAT-T2, n = 11) and/or GluN2A (TAT-NS, n = 19; TAT-T2, n = 14; two-tailed unpaired t-test). Data are presented as mean +/- SEM. g Experimental set-up with representative images and (h) corresponding comparison of the number of synapses following expression of D1R-WT (n = 44 fields) or D1R-S397D (n = 41; two-tailed unpaired t-test). Data are presented as mean +/- SEM. Scale bar, 5 µm. i Representative images of TH immunostaining. Scale bar, (i) 500 µm and 100 µm. j Experimental setup with representative fluorescence images from 4 independent experiments. Scale bar, 100 µm and 5 µm. k Representative Homer 1 C images. l comparison of the synaptic density in hippocampal neurons co-cultured with hippocampal (h-h, n = 24 fields) or midbrain neurons (m-h, n = 25; two-tailed unpaired t-test). Data are presented as mean +/- SEM. Scale bar, 5 µm. m Representative images and (n) comparison of the synaptic density in hippocampal neurons co-cultured with midbrain neurons and chronically treated with competing peptides, either TAT-NS (n = 12 fields) or TAT-T2 (n = 25; two-tailed unpaired t-test). Data are presented as mean +/- SEM. Scale bar, 5 µm. Source data are provided as a Source Data file.
Fig. 7
Fig. 7. GluN1-D1R interaction is required for early basal network activity in vivo.
a Experimental timeline for P7 head-fixed mice with representative LFP traces and the corresponding root mean square (RMS) in control (CTL), TAT-NS and TAT-T2 injected mice. b Comparison of the frequency of GDP events (n = 6 mice per group; two-tailed Mann–Whitney U test). Data are presented as mean +/- SEM. c Experimental timeline for P12 urethane-anesthetized mice with representative LFP traces and the corresponding root mean square (RMS) in control (CTL), TAT-NS, and TAT-T2-injected mice. d Distributions of inter-LB intervals. e Comparison of the frequency of LB events (n = 4-5 mice per group; two-tailed Mann–Whitney U test). Data are presented as mean +/- SEM. f Experimental timeline for P35 freely moving mice and representative LFP traces in control, TAT-NS and TAT-T2-injected mice. Hippocampal ripple events are indicated by black dots (above the traces). g, h Comparison of fast Fourier Transform (FFT) plots of LFP activity at 1–100 Hz bands excluding 48-52 Hz, (n = 3–4 mice per group). Data are presented as mean +/- SEM. i Comparison of the frequency of ripple events (n = 3–4 mice per group; two-tailed Mann-Whitney U test). Data are presented as mean +/- SEM. Source data are provided as a Source Data file.

References

    1. Lau CG, Zukin RS. NMDA receptor trafficking in synaptic plasticity and neuropsychiatric disorders. Nat. Rev. Neurosci. 2007;8:413–426. doi: 10.1038/nrn2153. - DOI - PubMed
    1. Paoletti P, Bellone C, Zhou Q. NMDA receptor subunit diversity: Impact on receptor properties, synaptic plasticity and disease. Nat. Rev. Neurosci. 2013;14:383–400. doi: 10.1038/nrn3504. - DOI - PubMed
    1. Groc L, Gustafsson B, Hanse E. AMPA signalling in nascent glutamatergic synapses: There and not there! Trends Neurosci. 2006;29:132–139. doi: 10.1016/j.tins.2006.01.005. - DOI - PubMed
    1. Washbourne P, Bennett JE, McAllister AK. Rapid recruitment of NMDA receptor transport packets to nascent synapses. Nat. Neurosci. 2002;5:751–759. doi: 10.1038/nn883. - DOI - PubMed
    1. Tan CX, Eroglu C. Cell adhesion molecules regulating astrocyte–neuron interactions. Curr. Opin. Neurobiol. 2021;69:170–177. doi: 10.1016/j.conb.2021.03.015. - DOI - PMC - PubMed

Publication types

Substances