. 2024 Jan 2;15(1):79.
doi: 10.1038/s41467-023-44412-7.

Cell cycle arrest induces lipid droplet formation and confers ferroptosis resistance

Affiliations

Cell cycle arrest induces lipid droplet formation and confers ferroptosis resistance

Hyemin Lee et al. Nat Commun. .

Abstract

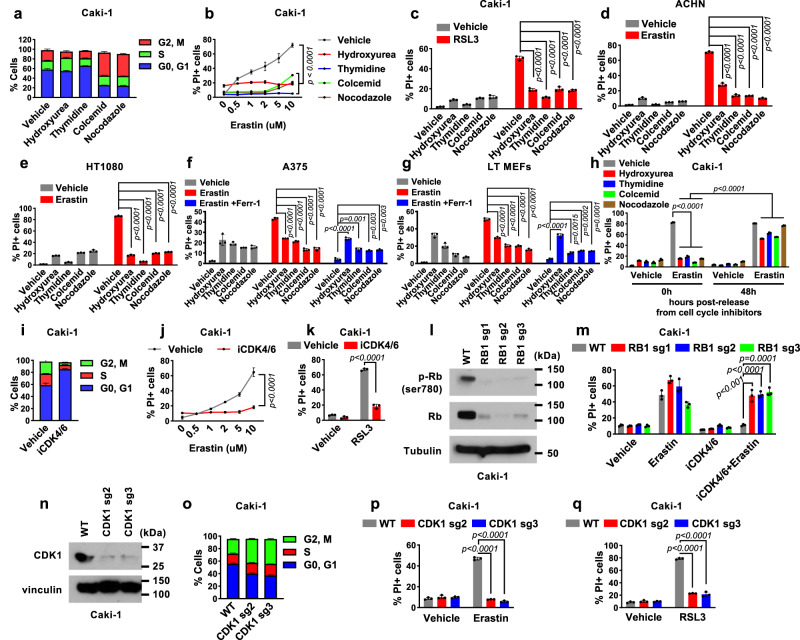
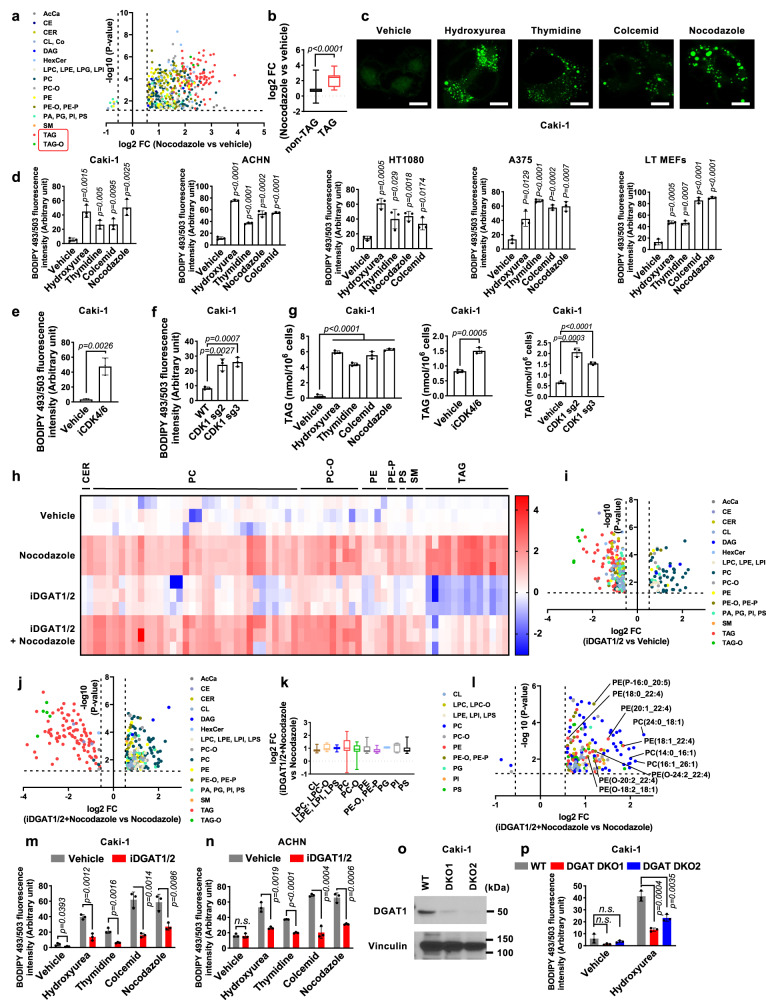
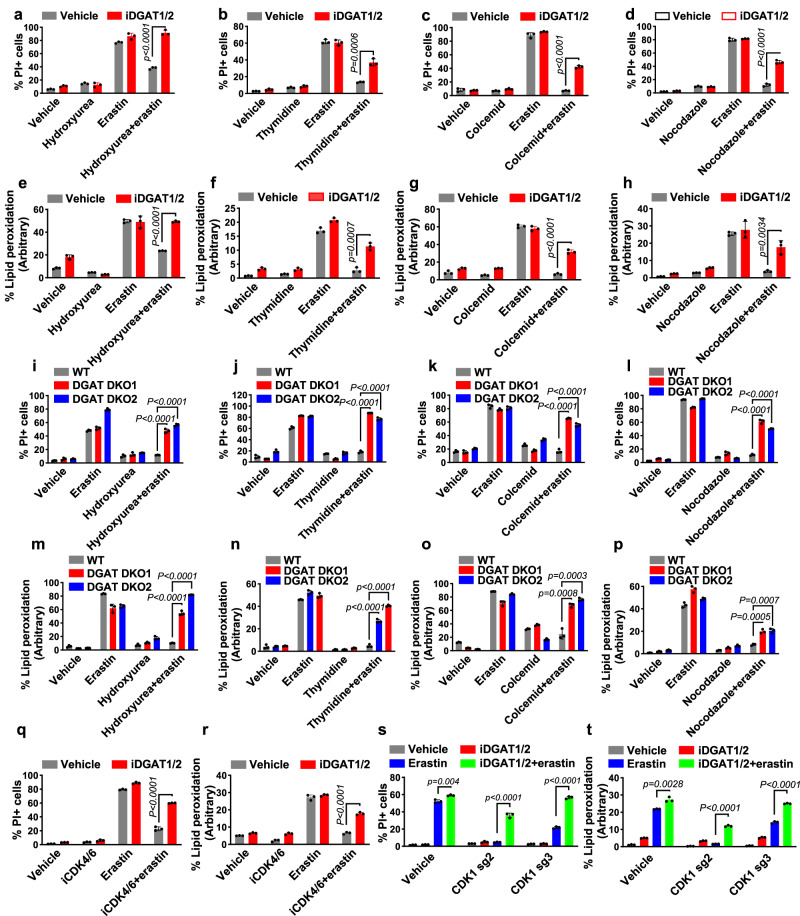
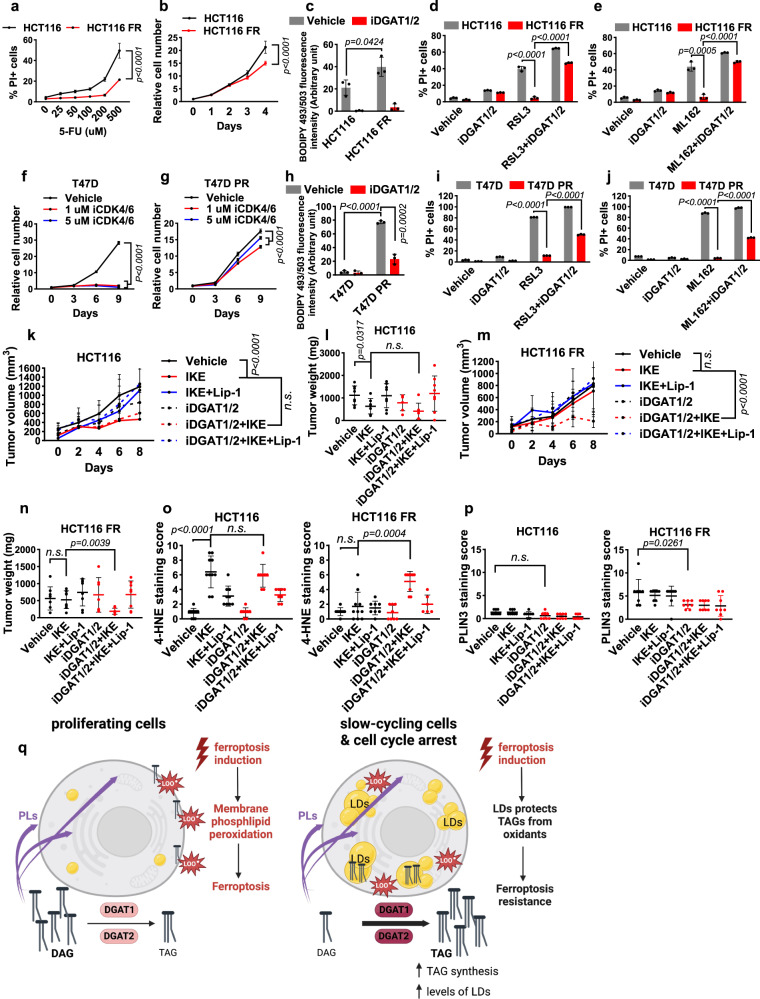
How cells coordinate cell cycling with cell survival and death remains incompletely understood. Here, we show that cell cycle arrest has a potent suppressive effect on ferroptosis, a form of regulated cell death induced by overwhelming lipid peroxidation at cellular membranes. Mechanistically, cell cycle arrest induces diacylglycerol acyltransferase (DGAT)-dependent lipid droplet formation to sequester excessive polyunsaturated fatty acids (PUFAs) that accumulate in arrested cells in triacylglycerols (TAGs), resulting in ferroptosis suppression. Consequently, DGAT inhibition orchestrates a reshuffling of PUFAs from TAGs to phospholipids and re-sensitizes arrested cells to ferroptosis. We show that some slow-cycling antimitotic drug-resistant cancer cells, such as 5-fluorouracil-resistant cells, have accumulation of lipid droplets and that combined treatment with ferroptosis inducers and DGAT inhibitors effectively suppresses the growth of 5-fluorouracil-resistant tumors by inducing ferroptosis. Together, these results reveal a role for cell cycle arrest in driving ferroptosis resistance and suggest a ferroptosis-inducing therapeutic strategy to target slow-cycling therapy-resistant cancers.


Conflict of interest statement

B.G. reports receiving consultation fees from Guidepoint Global, Cambridge Solutions, and NGM Bio, and is an inventor with patent applications involving targeting ferroptosis in cancer therapy. K.O. and L.K. are former full-time employees of Kadmon Corporation and are now full-time employees of the Carl Icahn Labs and Sanofi, US, respectively. M.V.P. is a former full-time employee of Kadmon Corporation and is now a full-time employee at PMV Pharmaceutics. The other authors declare no competing interests.

Figures

Fig. 1
Fig. 1. Cell cycle arrest drives resistance to ferroptosis.
a Cell cycle analysis of Caki-1 cells treated with hydroxyurea (0.3 mM), thymidine (1 mM), colcemid (0.035 μg/ml), or nocodazole (200 nM) for 48 h. Quantification of PI-positive dead Caki-1 cells using flow cytometry after 24 h of pretreatment with cell cycle inhibitors followed by treatment with 0-10 μM erastin for 18 h (b) or 50 nM RSL3 for 24 h (c). PI-positive cell populations in cells pretreated with cell cycle inhibitors for 24 h followed by treatment with 5 μM erastin for 24 h in ACHN (d), 10 μM erastin for 24 h in HT1080 (e), 20 μM erastin for 24 h in A375 (f), and 2 μM erastin for 16 h in MEFs (g). h PI-positive cell population in cells treated with 2 μM erastin for 18 h. Cells were released from either vehicle, hydroxyurea or nocodazole for indicated time prior to erastin treatment. i Cell cycle analysis of Caki-1 cells treated with 2 μM iCDK4/6 for 48 h. PI-positive cells after 24 h of pretreatment with the iCDK4/6 followed by treatment with 0-10 μM erastin for 18 h (j) or 50 nM RSL3 for 24 h (k). l Immunoblot showing the levels of Rb Ser780 phosphorylation and Rb expression in cells with the indicated genotypes. m Populations of PI-positive Caki-1 cells with the indicated genotypes and treatment for 18 h. n Immunoblot of CDK1 in wild-type (WT) and CDK1 knockout Caki-1 cells. o Cell cycle analysis of WT and CDK1 knockout Caki-1 cells. PI-positive Caki-1 cells treated with 2 μM erastin for 18 h (p) or 50 nM RSL3 for 24 h (q). Mean ( ±  SD) values are shown. n = 3. n indicates independent repeats, P values were calculated using two-way ANOVA (b, j) or an unpaired, two-tailed t-test. Different doses of cell cycle inhibitors were used with each cell line. Details on the drug treatment concentrations and times are provided in Supplementary Table 1. Source data are provided as a Source Data file.
Fig. 2
Fig. 2. Cell cycle arrest induces lipid droplet accumulation.
a Volcano plot displays log2 fold-change (FC) in lipid species abundance, comparing nocodazole-treated to vehicle-treated Caki-1 cells (n = 510, P < 0.05, FC > 1.5). AcCa, acyl carnitine; CE, cholesterol ester; CER, ceramide; CL, cardiolipin; Co, coenzyme; DAG, diacylglyceride; HexCer, hexosyl ceramides; LPC, lysophosphatidylcholine; LPE, lysophosphatidylethanolamine; LPG, lysophosphatidylglycerol; LPI, lysophosphatidylinositol; PC, phosphatidylcholine; PC-O, ether-linked phosphatidylcholine; PE, phosphatidylethanolamine; PE-O/PE-P, ether-linked phosphatidylethanolamine; PA, phosphatidic acid; PG, phosphatidylglycerol; PI, phosphatidylinositol; PS, phosphatidylserine; SM, sphingomyelin; TAG, triacylglyceride; TAG-O, ether-linked triacylglyceride. b Boxplots displaying log2 FC in non-TAG (n = 413) and TAG (n = 97) lipid species abundance between nocodazole-treated and vehicle-treated Caki-1 cells, with medians and whiskers indicating min-max values. BODIPY 493/503 staining in Caki-1 cells after 48 h of cell cycle inhibitor treatment. scale bar, 20 μm (c), and quantifications in the indicated cell lines (d). BODIPY 493/503 staining in Caki-1 cells treated with iCDK4/6 for 48 h (e), or WT and sgCDK1 cells (f). g Triglyceride concentrations in Caki-1 cells. h Heat map of the significantly changed lipids (unpaired, two-tailed t-test; FDR-corrected P < 0.05, fold change > 1.5 in vehicle- versus nocodazole-treated Caki-1 cells). Rows represent samples, columns represent normalized intensities, color-coded from red (high intensity) to blue (low intensity). Volcano plots for iDGAT1/2-treated versus vehicle-treated (i, n = 276) and iDGAT1/2 and nocodazole-treated versus nocodazole-treated (j, n = 302) Caki-1 cells. Log2 FC in phospholipid abundance comparing iDGAT and nocodazole-treated to nocodazole-treated Caki-1 cells, depicted with boxplots (k) and volcano plots (l). n = 192. LPC-O, ether-linked lysophosphatidylcholine; LPS, lysophosphatidylserine. BODIPY 493/503 staining in Caki-1 (m) and ACHN (n) cells. o Immunoblot of DGAT1 in Caki-1 cells. p BODIPY 493/503 staining in WT, DGAT DKO1, and DKO2 Caki-1 cells with or without exposure to hydroxyurea (0.3 mM) for 48 h. Mean ( ±  SD) values are shown. n = 3. n indicates independent repeats, except a, b, i, j, k, and l. unpaired, two-tailed t-test. n.s. not significant. Source data are provided as a Source Data file.
Fig. 3
Fig. 3. Triacylglyceride formation protects cells from ferroptosis.
Quantification of PI-positive Caki-1 cells treated with 2 μM erastin for 18 h using flow cytometry. Cells were pretreated with a vehicle or iDGAT1/2 with 0.3 mM hydroxyurea (a), 1 mM thymidine (b), 0.035 μg/ml colcemid (c), or 200 nM nocodazole (d) for 24 h. Lipid peroxidation measurement in Caki-1 cells treated with 2 μM erastin for 8 h. Cells were pretreated with a vehicle or iDGAT1/2 with 0.3 mM hydroxyurea (e), 1 mM thymidine (f), 0.035 μg/ml colcemid (g), or 200 nM nocodazole (h) for 24 h. WT, DGAT DKO1, and DGAT DKO2 Caki-1 cells were pretreated with cell cycle inhibitors for 24 h. Shown are the populations of PI-positive cells after treatment with 2 μM erastin for 18 h (il) and those with lipid peroxidation after treatment with 2 μM erastin for 8 h (mp). q, r, The populations of PI-positive Caki-1 cells pretreated with a vehicle or iDGAT1/2 for 24 h after treatment with 2 μM erastin for 18 h (q) and lipid peroxidation after treatment with 2 μM erastin for 8 h (r). s, t WT, sgCDK1-2, and sgCDK1-3 Caki-1 cells were pretreated with iDGAT1/2 for 24 h. The populations of PI-positive cells after treatment with 2 μM erastin for 18 h (s) and lipid peroxidation after treatment with 2 μM erastin for 8 h (t) are shown. Mean ( ± SD) values are shown. n = 3. n indicates independent repeats (unpaired, two-tailed t-test). Source data are provided as a Source Data file.
Fig. 4
Fig. 4. Treatment of slow-cycling therapy-resistant cells.
a PI-positive populations of parental HCT116 and HCT116 FR cells treated with 5-FU for 24 h. b HCT116 and HCT116 FR cell growth over 5 days. c The relative intensities of BODIPY 493/503 staining in HCT116 and HCT116 FR cells treated with iDGAT1/2 for 48 h. The populations of PI-positive cells treated with 10 μM RSL3 and iDGAT1/2 (d) or 10 μM ML162 and iDGAT1/2 (e) for 24 h. The relative numbers of parental T47D (f) and T47D PR (g) cells measured every 3 days. Cells were cultured with or without iCDK4/6. h The relative intensities of BODIPY 493/503 staining in T47D and T47D PR cells treated with iDGAT1/2 for 48 h. The populations of PI-positive cells treated with 100 nM RSL3 and iDGAT1/2 for 24 h (i) or 200 nM ML162 and iDGAT1/2 for 18 h (j). Volumes (k) and weights (l) of HCT116 xenograft tumors in the indicated treatment groups. n = 8 for vehicle, IKE+Lip-1, iDGAT1/2 + IKE+Lip-1; n = 7 for IKE, iDGAT1/2 + IKE; n = 6 for iDGAT. Volumes (m) and weights (n) of HCT116 FR xenograft tumors in the indicated treatments groups, n = 8, except for iDGAT (n = 7). Immunochemical scoring of 4-HNE (o) and PLIN3 (p) staining in tumor sections. n = 8 in HCT116, except for vehicle, IKE (n = 10) and IKE+Lip-1 (n = 9). n = 8 in HCT116 FR, except for IKE (n = 10), iDGAT+IKE (n = 9) and iDGAT+IKE+Lip-1 (n = 6) were used for 4-HNE and n = 8 was used for PLIN3 staining. q Working model. See the Discussion for a detailed description. PLs, phospholipids; LOO, peroxy radical; LD, lipid droplet. Figure 4q is created using BioRender. Mean (±SD) values are shown. n = 3. n indicates independent repeats (aj), P values were calculated using two-way ANOVA (a, b, f, g, k, and m) or an unpaired, two-tailed t-test. n.s. not significant. Source data are provided as a Source Data file.

References

    1. Olzmann JA, Carvalho P. Dynamics and functions of lipid droplets. Nat. Rev. Mol. Cell Biol. 2019;20:137–155. doi: 10.1038/s41580-018-0085-z. - DOI - PMC - PubMed
    1. Krahmer N, Guo Y, Farese RV, Jr, Walther TC. SnapShot: Lipid Droplets. Cell. 2009;139:1024–1024.e1021. doi: 10.1016/j.cell.2009.11.023. - DOI - PubMed
    1. Cases S, et al. Identification of a gene encoding an acyl CoA:diacylglycerol acyltransferase, a key enzyme in triacylglycerol synthesis. Proc. Natl Acad. Sci. USA. 1998;95:13018–13023. doi: 10.1073/pnas.95.22.13018. - DOI - PMC - PubMed
    1. Cases S, et al. Cloning of DGAT2, a second mammalian diacylglycerol acyltransferase, and related family members. J. Biol. Chem. 2001;276:38870–38876. doi: 10.1074/jbc.M106219200. - DOI - PubMed
    1. Bailey AP, et al. Antioxidant role for lipid droplets in a stem cell niche of Drosophila. Cell. 2015;163:340–353. doi: 10.1016/j.cell.2015.09.020. - DOI - PMC - PubMed

Publication types