. 2024 Jan 2;12(1):1.
doi: 10.1186/s40478-023-01699-3.

Distinct forebrain regions define a dichotomous astrocytic profile in multiple system atrophy

Affiliations

Distinct forebrain regions define a dichotomous astrocytic profile in multiple system atrophy

Y Schneider et al. Acta Neuropathol Commun. .

Abstract

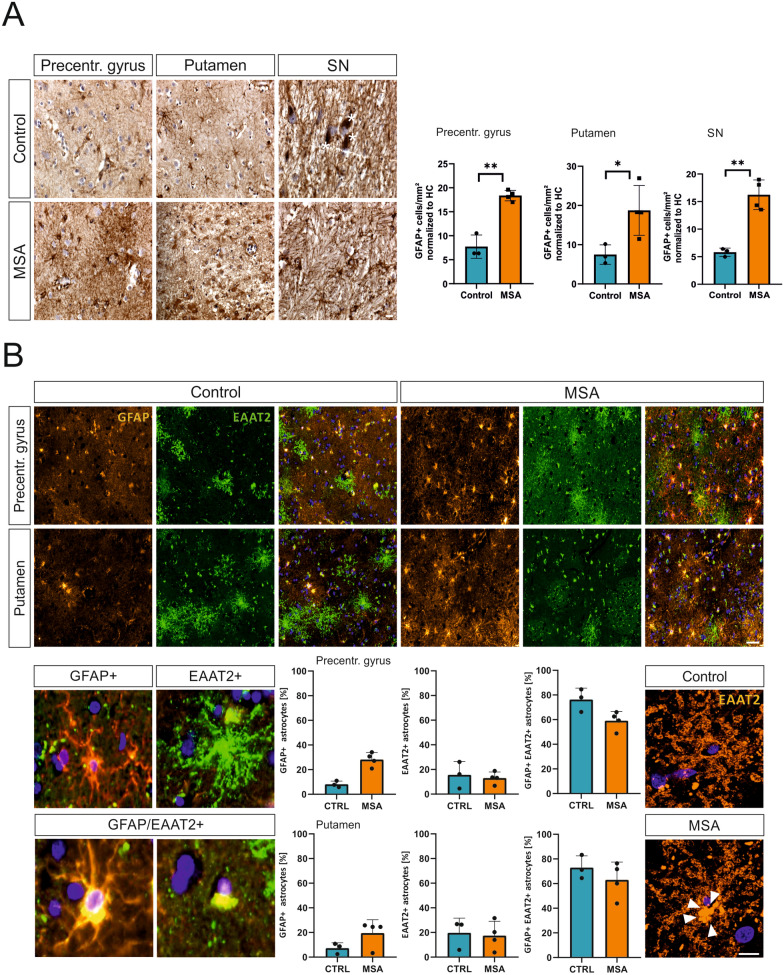
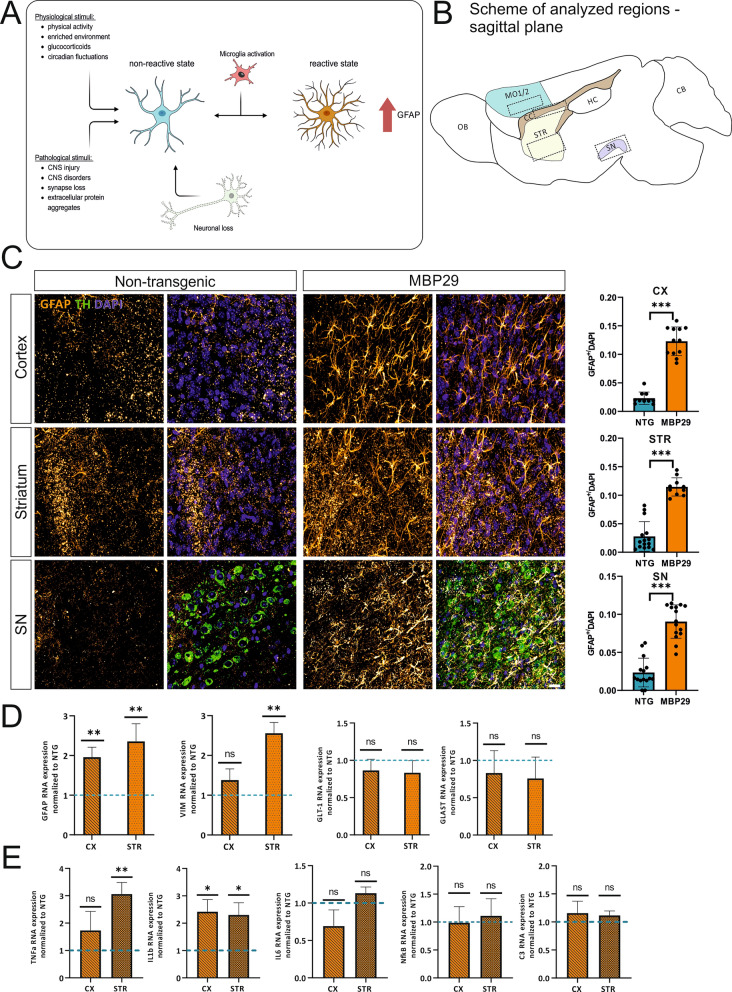
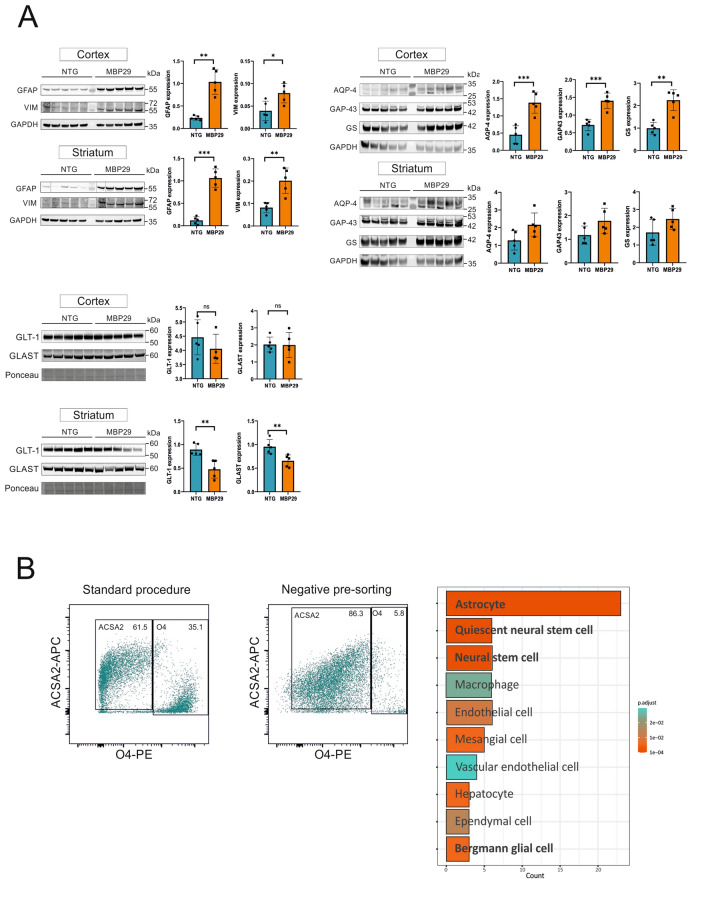
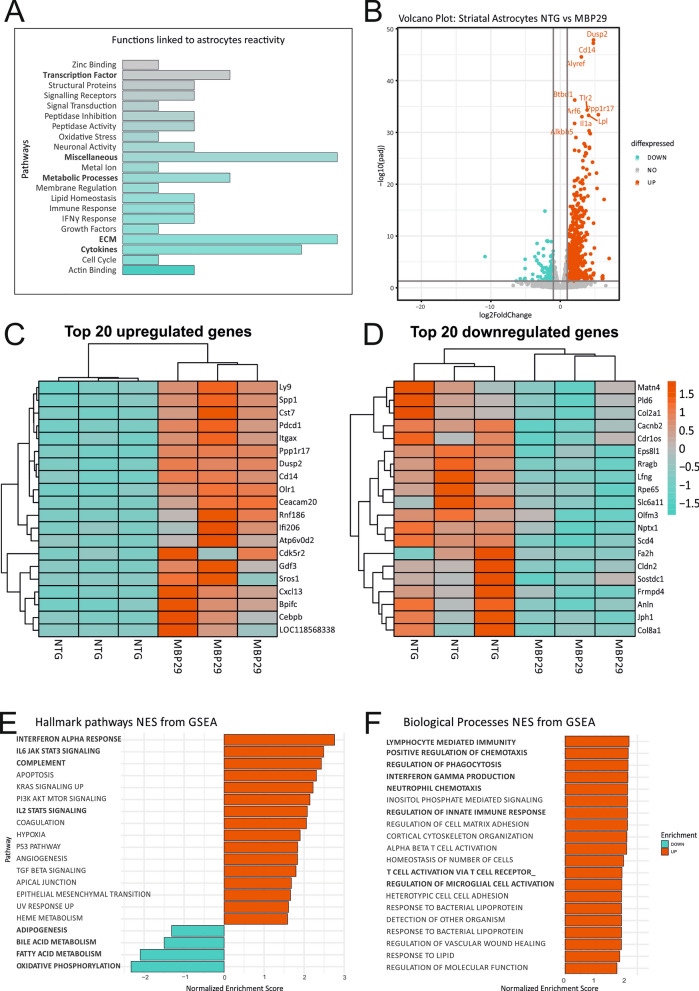
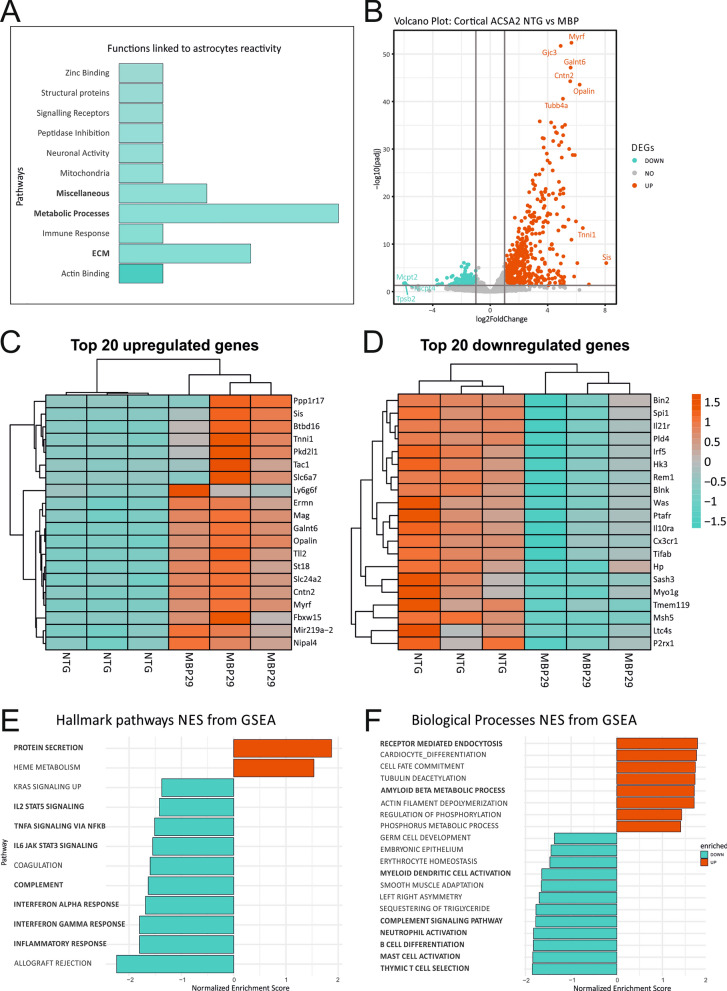
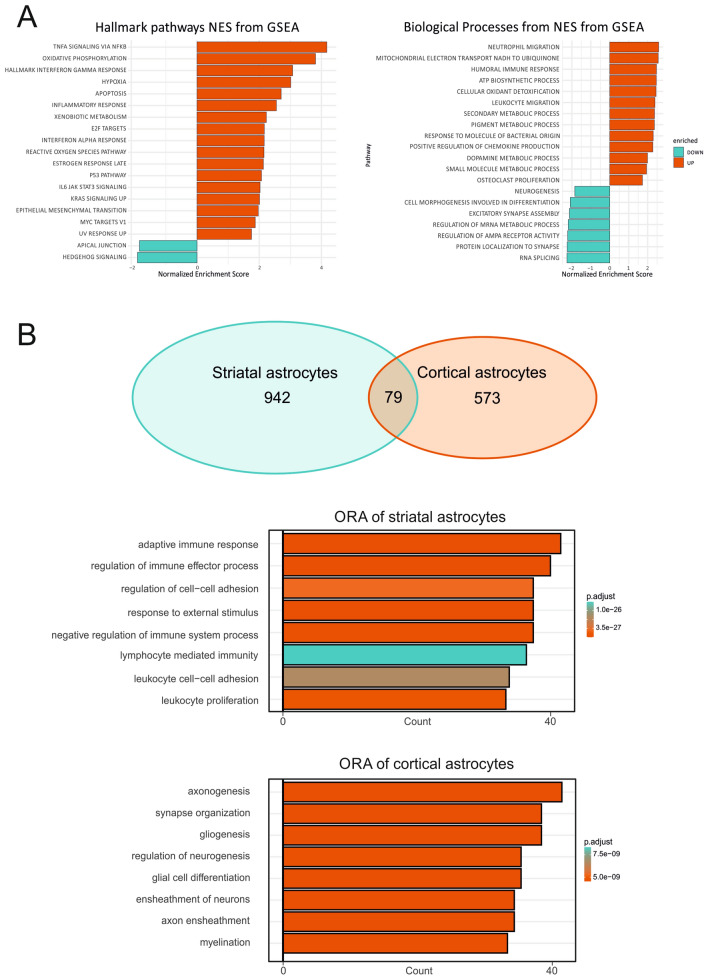
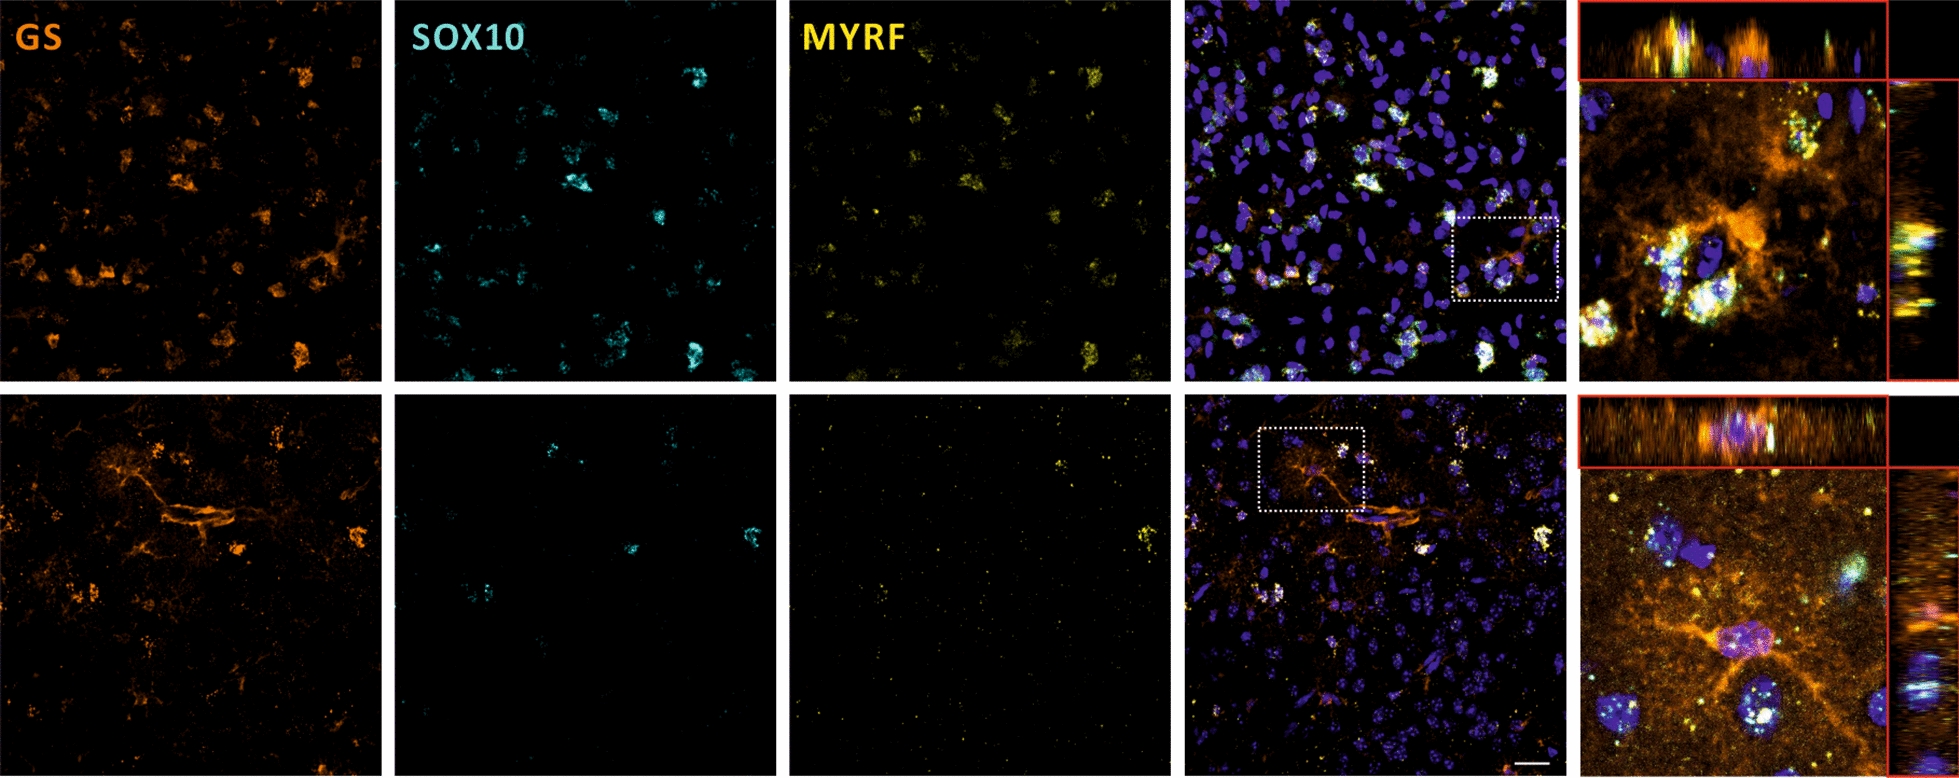
The growing recognition of a dichotomous role of astrocytes in neurodegenerative processes has heightened the need for unraveling distinct astrocytic subtypes in neurological disorders. In multiple system atrophy (MSA), a rare, rapidly progressing atypical Parkinsonian disease characterized by increased astrocyte reactivity. However the specific contribution of astrocyte subtypes to neuropathology remains elusive. Hence, we first set out to profile glial fibrillary acidic protein levels in astrocytes across the human post mortem motor cortex, putamen, and substantia nigra of MSA patients and observed an overall profound astrocytic response. Matching the post mortem human findings, a similar astrocytic phenotype was present in a transgenic MSA mouse model. Notably, MSA mice exhibited a decreased expression of the glutamate transporter 1 and glutamate aspartate transporter in the basal ganglia, but not the motor cortex. We developed an optimized astrocyte isolation protocol based on magnetic-activated cell sorting via ATPase Na+/K+ transporting subunit beta 2 and profiled the transcriptomic landscape of striatal and cortical astrocytes in transgenic MSA mice. The gene expression profile of astrocytes in the motor cortex displayed an anti-inflammatory signature with increased oligodendroglial and pro-myelinogenic expression pattern. In contrast, striatal astrocytes were defined by elevated pro-inflammatory transcripts accompanied by dysregulated genes involved in homeostatic functions for lipid and calcium metabolism. These findings provide new insights into a region-dependent, dichotomous astrocytic response-potentially beneficial in the cortex and harmful in the striatum-in MSA suggesting a differential role of astrocytes in MSA-related neurodegenerative processes.


Conflict of interest statement

The authors declare that they have no known competing financial interests or personal relationships that appeared to influence the work reported in this paper.

Figures

Fig. 1
Fig. 1
Astrogliosis in post mortem brain tissue of MSA patients. A Representative image of DAB staining of GFAP+ astrocytes in precentral gyrus, putamen, and substantia nigra of MSA-P patient (female, 67) and control individual (female, 60) and quantification of GFAP+ cells/mm2 (4 MSA patients vs. 4 Controls). SN was identified by presence of neuromelanin-containing neurons (white asterisks). Welch’s t-test was used for statistical analysis. Scale bar = 20 µm. All three regions display elevated numbers of GFAP+ astrocytes in cortex (p = 0.002), putamen (p = 0.0003), and substantia nigra (p < 0.0001) of MSA patients. CTRL = Control, MSA = multiple system atrophy, SN = substantia nigra. (B, Upper panel) Immunofluorescence staining of four MSA-P patients and three controls. For visualization of astrocytes GFAP was used as a marker (orange). To analyze expression of glutamate reuptake transporter tissue was stained for EAAT2 (green). Scale bar = 50 µm. (B, Lower panel) Overview of single cells expressing GFAP, EAAT2, and GFAP/EAAT2 (yellow, lower panel). Astrocytic GFAP/EAAT2 expression is decreased in the precentral gyrus (p = 0.0571). Moreover, a re-distribution towards the cytoplasm of EAAT2 is observed in astrocytes of MSA patients (Lower right panel)
Fig. 2
Fig. 2
Astrogliosis and differential inflammatory signature in brain regions of MBP29-hα-syn mice. A Overview of stimuli inducing upregulation of astrocytic GFAP expression. Astrocytes respond to either pathological or physiological stimuli. Alternatively, microglial subtypes or neuronal loss may result in increased astrocytic GFAP expression. Consequently, GFAP+ upregulated astrocytes show complex and multibranched processes [1]. Created with BioRender.com. B CNS regions analyzed of MBP29-hα-syn mice (sagittal plane). MO1/2 = Motor cortex 1/2, CC = corpus callosum, STR = striatum, SN = substantia nigra pars compacta, OB = olfactory bulb, HC = hippocampus, CB = cerebellum. C Characterization of GFAP+ expressing astrocytes in the cortex, the striatum, and the substantia nigra of MBP29-hα-syn mice and non-transgenic controls (NTGs). Dopaminergic neurons of the substantia nigra were visualized by tyrosine hydroxylase (TH, green; lower panel). The number of GFAP+ astrocytes was dramatically increased in the cortex (p < 0.001), the striatum (p < 0.001), and the substantia nigra (p < 0.001) of MBP29-hα-syn mice compared to NTGs. The numbers of GFAP+ astrocytes (n = 6/group/region) are shown as mean ± SD (right column); *** p < 0.001, Scale bar = 20 µm. D, E qPCR analysis of cortical and striatal microdissected tissues of MBP29-hα-syn mice and non-transgenic controls (NTGs, n = 4 animals per genotype): GFAP, VIM, and the glutamate reuptake transporters (glutamate transporter-1 (Glt-1) and the glutamate-aspartate transporter 1 (Glast)) (D) as well as pro-inflammatory cytokines such as tumor-necrosis factor α (Tnfa), interleukin-1b (Il1b), interleukin-6 (Il6), nuclear factor kappa B (Nfkb), and complement component 3 (C3) (E). Striatal expression levels of GFAP (p = 0.006) and VIM (p = 0.002) are significantly increased in MBP29-hα-syn mice, however GFAP is solely elevated in the cortex of MBP29-hα-syn mice (p = 0.001). RNA expression of GLT-1 and GLAST are not altered in both regions (D). Tnfa expression is elevated by threefold in the striatum of MBP29-hα-syn mice only (p = 0.003). In contrast, Il1b levels are similarly increased in both regions, the cortex (p = 0.0312) and the striatum (p = 0.0367) of transgenic mice. Il6 , Nfkb, and C3 expression is not altered compared to NTGs (E). Quantification (n = 4 animals/group) is shown as mean ± SD. *p < 0.05, **p < 0.01, and ***p < 0.005
Fig. 3
Fig. 3
A Response- and homeostasis-associated protein levels of astrocyctes derived from MBP29-hα-syn and non-transgenic littermates. Upper left panel: Cortical and striatal levels of GFAP were increased in MBP29-hα-syn mice by ~ 4-(p < 0.001) and ~ 8-fold (p < 0.001), respectively. Similarly, there was an increased cortical and striatal level for VIM in MBP29-hα-syn mice by ~ 2-(p = 0.007) and ~ 2.5-fold (p < 0.001), respectively. Quantification of WBs (n = 5/ each group/ region) is shown as mean ± SD. Glyceraldehyde-3-phosphate dehydrogenase (GAPDH) served as control. kDa = kilo Dalton. *p < 0.05, **p < 0.01, ***p < 0.005. Upper right panel: AQP-4 levels are highly increased by ~ 3-fold in the cortex of MBP29-hα-syn mice (p < 0.001). Note the much lower, but not significant increase of AQP-4 levels in the striatum of MBP29-hα-syn mice (p = 0.054). A proportional and similar upregulation is present for growth associated protein-43 (GAP-43) levels showing a ~ 2-fold (p < 0.001) and ~ 1.5-fold (p = 0.074) increase in the cortex and the striatum of MBP29-hα-syn mice. A similar pattern is observed for GS by a ~ 2.5-fold increase (p < 0.001) in the cortex of MBP29-hα-syn mice, however without changing striatal levels. Quantification of WBs (n = 5 animals/group/region) is shown as mean ± SD. Glyceraldehyde-3-phosphate dehydrogenase (GAPDH) served as control. kDa = kilo Dalton. *p < 0.05, **p < 0–01, ***p < 0.005. Lower left panel: Protein levels of glutamate reuptake transporters glutamate transporter-1 (GLT-1) and glutamate-aspartate transporter 1 (GLAST) are not altered in the cortex of MBP29-hα-syn mice. In contrast, both glutamate reuptake transporters were reduced by ~ 2-fold (GLT-1, p = 0.001; GLAST, p = 0.005). Quantification of WBs (n = 5 animals/group/region) is shown as mean ± SD. Due to overlapping WB signals of GLT-1, GLAST, and GAPDH, whole protein Ponceau-S staining served as control. *p < 0.05, **p < 0.01, ***p < 0.005. B Isolation of astrocytes via MACS and cellular phenotyping. Flow cytometry analysis of magnetic activated cell sorting (MACS) of striatal and cortical astrocytes using the astrocyte cell surface antigen-2 (ACSA2) without (standard procedure; ACSA-2+) or with a preceding, negative sorting step for the oligodendrocyte marker 4 (negative pre-sorting, O4, ACSA2+). Without removing O4+-cells, the purity of ACSA2+-cells amounts to 61.5% (left panel); a substantial O4+ cell population (35.1%) was still present. By adding the O4 presorting step, a highly improved purity of ACSA2+-cells (86.3%) was achieved; much less O4+-cells (5.8%) were detected (middle panel). Y-axis: logarithmic fluorescence of allophycocyanin (APC)-signal. X-axis: logarithmic fluorescence of phycoerythrin (PE)-signal. Each cell population analyzed is marked by a black rectangle, the proportion of ACSA2+ and O4+-cells is given in % of the entire cell population. Enrichment of the 50 most highly expressed genes in the isolated cell population using clusterProfiler. Enrichment analysis revealed the most significant enriched genes associated with astrocytes (right panel). Neural stem cells show a similar gene expression pattern
Fig. 4
Fig. 4
Transcriptome analysis of striatal astrocytes after MACS via ACSA2 of MBP29-hα-syn mice. A Mosaic plot of altered astrocytic functions in the striatum of MBP29-hα-syn mice based on existing dataset assessed by Zamanian et al. [16]. Astrocytes display a distinct upregulation of transcripts linked to astrocyte reactivity. Notably, there is a strong enrichment in cytokine activity, extracellular matrix (ECM) organization, metabolic processes and transcription factor activity, as well as not clearly classifiable functions (Miscellaneous). B Volcano plot of differentially expressed genes (DEGs). DEGs were analyzed comparing MBP29-hα-syn mice with non-transgenic littermates. Thresholds were set to log2foldchange > 2.0 and adj. p value < 0.05. Y-axis: negative decade logarithm of adj. p value. X-axis: log2foldchange of gene expression levels. In turquoise: significantly downregulated genes, in grey: genes without statistical significance, in red: significantly upregulated genes. Top hits were marked with official gene symbols by the HUGO Gene Nomenclature Committee (HGNC). C, D Heatmap of the 20 most highly up- and downregulated genes according to adjusted p-value. Gene expression was scaled by rows to visualize differences in gene expression between and within the genotypes using log2foldchange of gene expression. Striatal astrocytes demonstrate a profound upregulation of pro-inflammatory transcripts. Additionally, homeostatic functions, such as lipid metabolism, calcium transport, and neurotransmitter signaling are impaired in astrocytes on transcriptional level. E, F Functional gene set enrichment analysis of DEGs (FDR > 0.05). Pathways are ordered by normalized enrichment score (NES). Nomenclature of pathways is modified from official hallmark and biological processes pathways. Bold: Pathways associated with pro-inflammatory pathways and impaired homeostasis
Fig. 5
Fig. 5
Transcriptome analysis of cortical astrocytes after MACS via ACSA2 of MBP29-hα-syn mice. A Mosaic plot of altered astrocytic functions in the cortex of MBP29-hα-syn mice based on existing dataset [16]. Reactivity profile of cortical astrocytes show less pronounced upregulation of reactivity-associated genes compared to striatal astrocytes. Primary processes affected refer to metabolic and ECM organization, as well as unclassified processes. B Volcano plot of DEGs analyzed comparing MBP29-hα-syn mice with non-transgenic litter mates. Thresholds were set to log2foldchange > 2.0 and adj. p value < 0.05. Y-axis: negative decade logarithm of adj. p value. X-axis: log2foldchange of gene expression levels. In turquoise: significantly downregulated genes, in grey: genes without statistical significance, in red: significantly upregulated genes. Transcripts with most significant adj. p-values and log2foldchange were visualized using official gene symbols by HGNC. C, D Heatmap of the 20 most highly up- and downregulated genes according to adjusted p value. Gene expression was scaled by rows to visualize differences in gene expression between and within the genotypes using log2foldchange of gene expression. Cortical astrocytes display significant upregulation of transcripts associated with oligodendrocyte development and myelination (ERMN, MAG, MYRF, OPALIN), ion and neurotransmitter homeostasis, and neuroprotection (SLC6A7, TLL2, SLCA24A2, SIS). E, F Functional gene set enrichment analysis of DEGs (FDR > 0.05). Pathways are ordered by normalized enrichment score (NES). Nomenclature of pathways is modified from official hallmark and biological processes pathways. E Transcripts enriched in protein secretion are upregulated in cortical astrocytes, whereas a significant downregulation of transcripts enriched in pro-inflammatory processes (IL-6/STAT3, complement, IFNγ, IFNα) was observed. F Upregulated transcripts demonstrate enrichment in receptor-mediated endocytosis and amyloid-β metabolism. Enrichment of downregulated transcripts mostly in immune system associated processes (complement, dendritic cell activation) confirms pattern already observed in hallmark analysis
Fig. 6
Fig. 6
Comparison of cortex- and striatum-derived astrocytes from MBP29-hα-syn mice. A Functional gene set enrichment analysis based on DEGs. Striatal transcripts were compared to cortical transcripts and subsequently enriched in hallmark pathways and biological processes. Most significant enrichment of striatal transcripts were observed in pathways associated with a pro-inflammatory response and energy homeostasis, implying a more pronounced reactivity in striatum compared to the cortex. B Venn-diagram of overlapping genes of striatal and cortical transcripts derived from displaying 79 shared differentially expressed genes. Overrepresentation analysis of the non-overlapping genes (973 striatal, 573 cortical genes) displaying the top 8 overrepresented pathways sorted by the count of enriched transcript. Color code is based on the adj. p-value
Fig. 7
Fig. 7
In-situ hybridization of oligodendrocyte-associated transcripts in the cortex of MBP29-hα-syn mice. RNAscope hybridization of oligodendroglial transcripts in astrocytes. GS was used as a pan-astrocyte marker (orange). Sox10 (cyan) and Myrf (yellow) were considered as oligodendrocyte markers covering characteristic of maturing and myelinating oligodendrocytes. Nuclei were counterstained using DAPI (blue). In MBP29-hα-syn mice, oligodendroglial co-label with astrocytic processes stained with GS, but are not unequivocally localized within the processes. Scale bar = 20 µm

Similar articles

Cited by

References

    1. Escartin C, et al. Reactive astrocyte nomenclature, definitions, and future directions. Nat Neurosci. 2021;24(3):312–325. doi: 10.1038/s41593-020-00783-4. - DOI - PMC - PubMed
    1. Verkhratsky A, Nedergaard M. Physiology of Astroglia. Physiol Rev. 2018;98(1):239–389. doi: 10.1152/physrev.00042.2016. - DOI - PMC - PubMed
    1. Arriza JL, et al. Functional comparisons of three glutamate transporter subtypes cloned from human motor cortex. J Neurosci. 1994;14(9):5559–5569. doi: 10.1523/JNEUROSCI.14-09-05559.1994. - DOI - PMC - PubMed
    1. Kong Q, et al. Small-molecule activator of glutamate transporter EAAT2 translation provides neuroprotection. J Clin Invest. 2014;124(3):1255–1267. doi: 10.1172/JCI66163. - DOI - PMC - PubMed
    1. Beard E, et al. Astrocytes as key regulators of brain energy metabolism: new therapeutic perspectives. Front Physiol. 2021;12:825816. doi: 10.3389/fphys.2021.825816. - DOI - PMC - PubMed

Publication types

LinkOut - more resources