. 2024 Jan 2;15(1):97.
doi: 10.1038/s41467-023-43787-x.

Myeloid-derived grancalcin instigates obesity-induced insulin resistance and metabolic inflammation in male mice

Affiliations

Myeloid-derived grancalcin instigates obesity-induced insulin resistance and metabolic inflammation in male mice

Tian Su et al. Nat Commun. .

Abstract

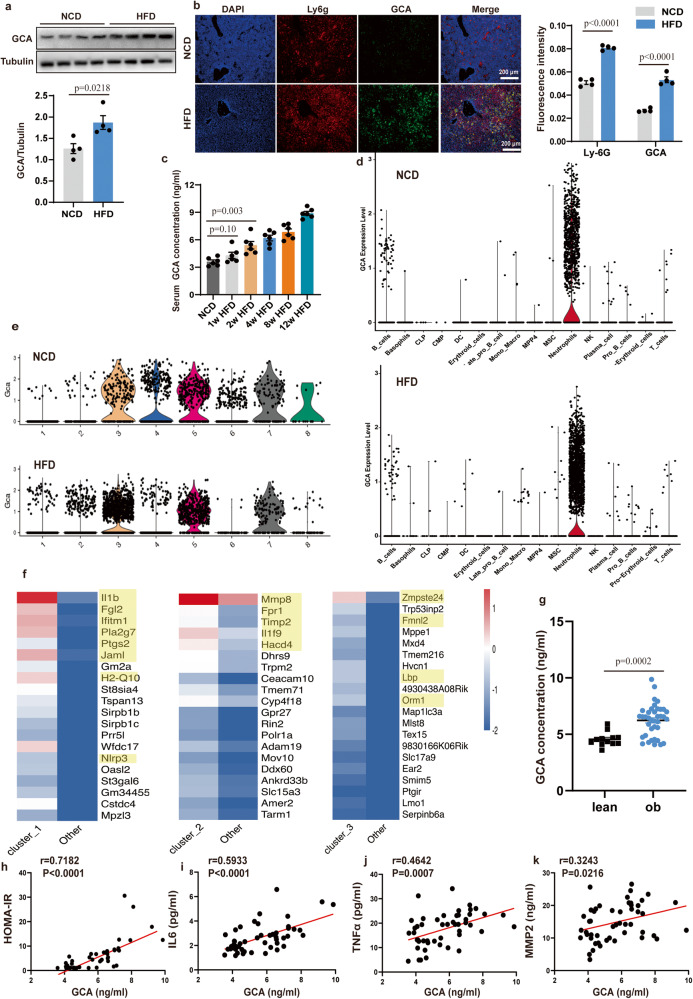
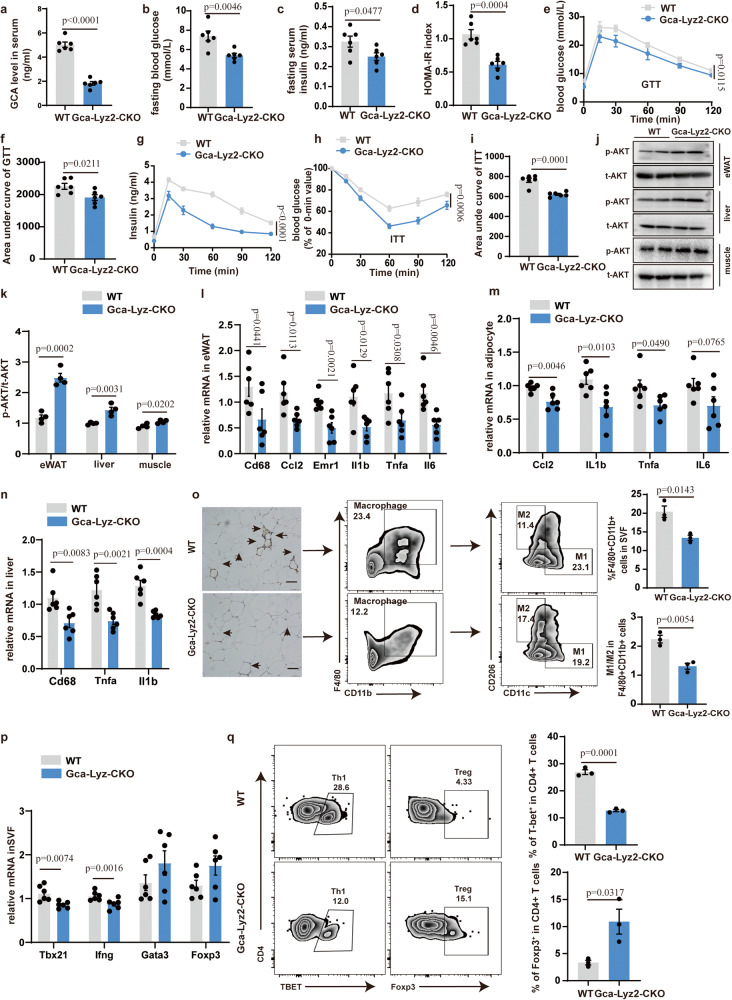
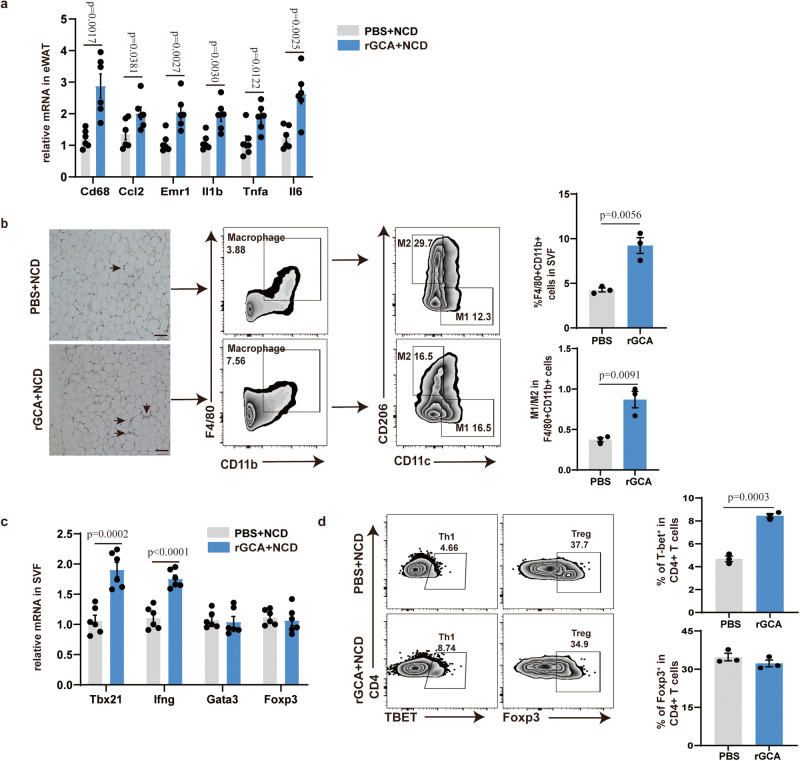
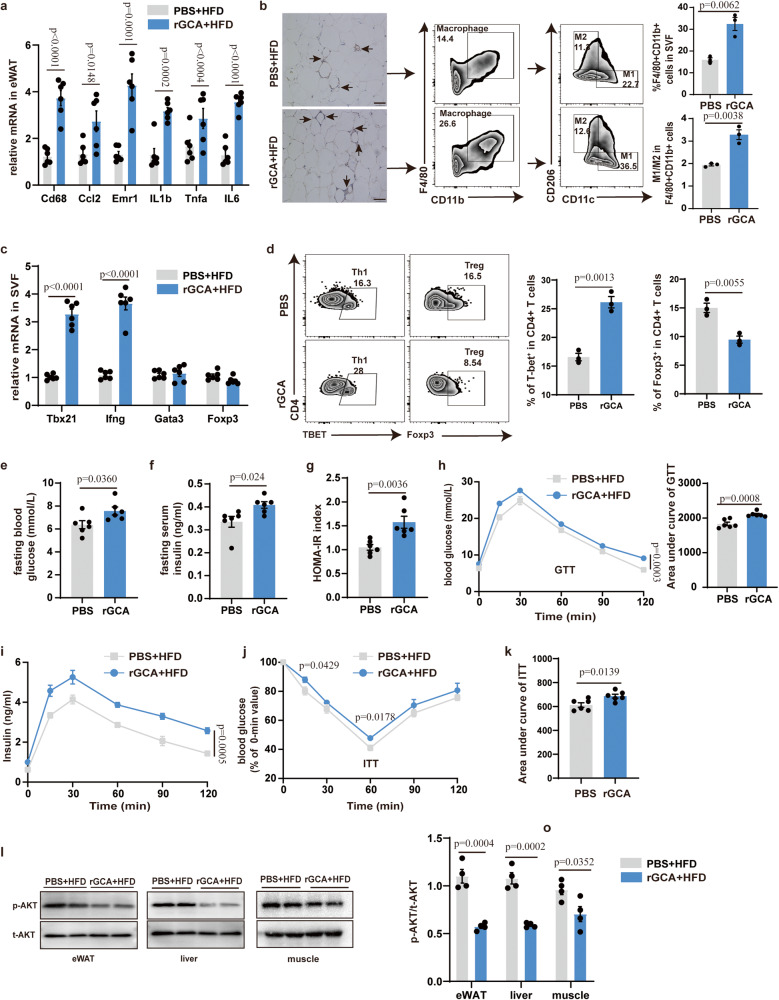
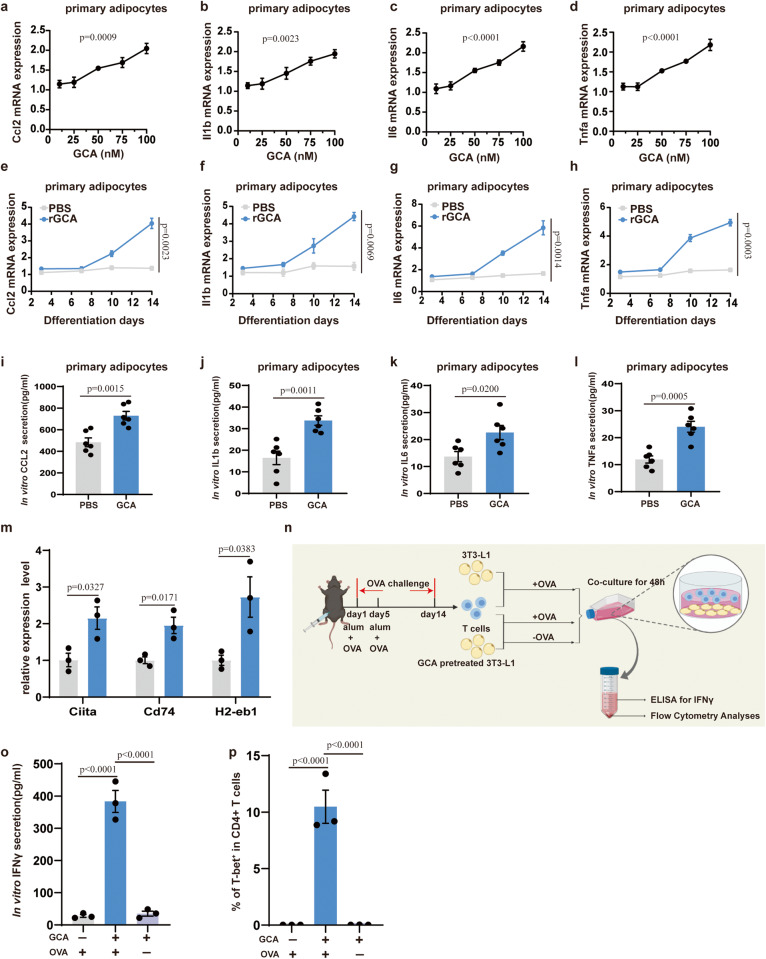
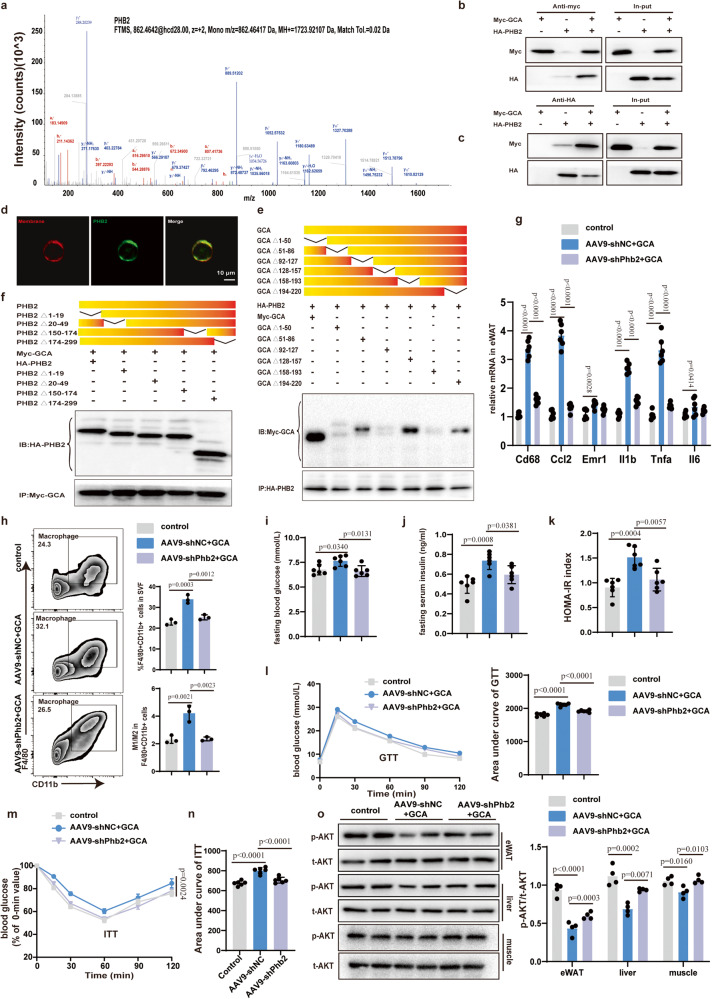
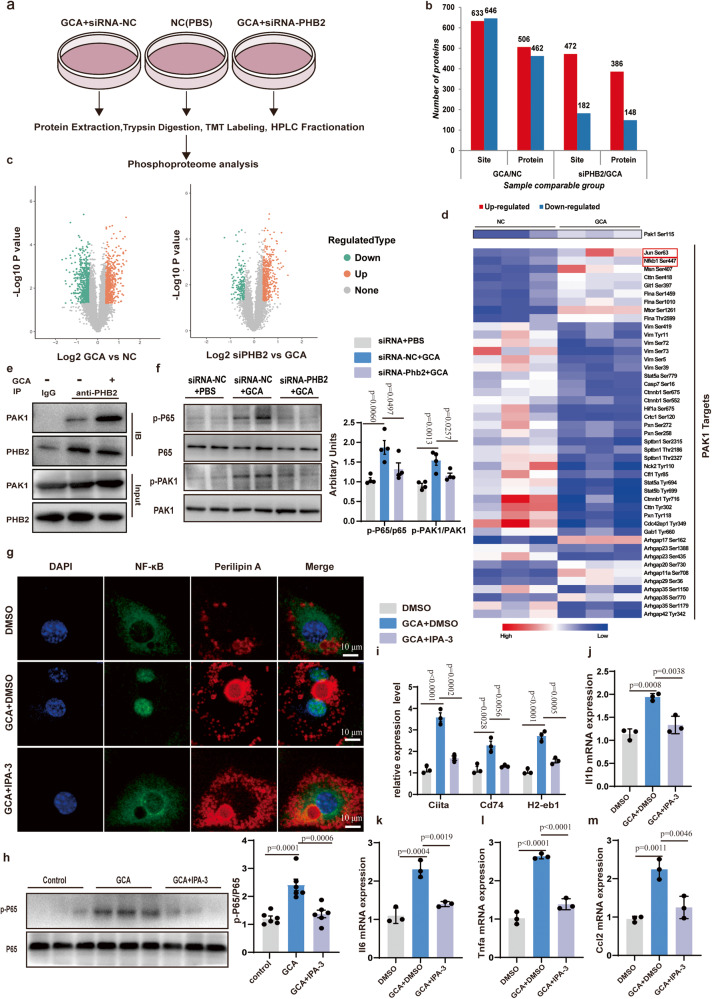
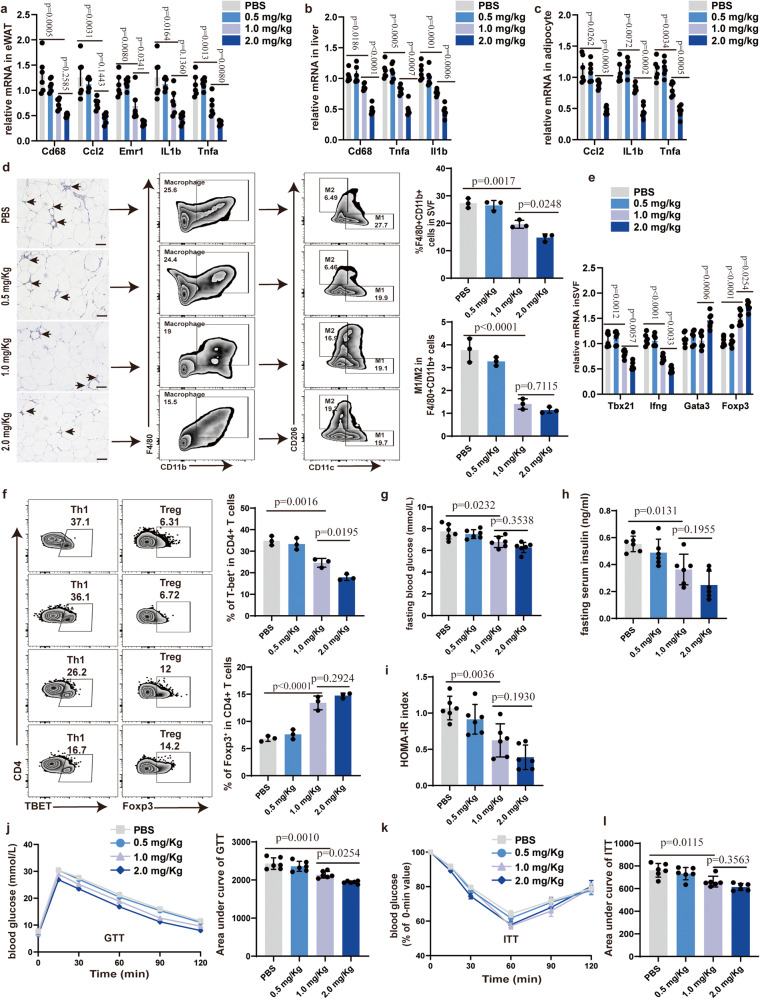
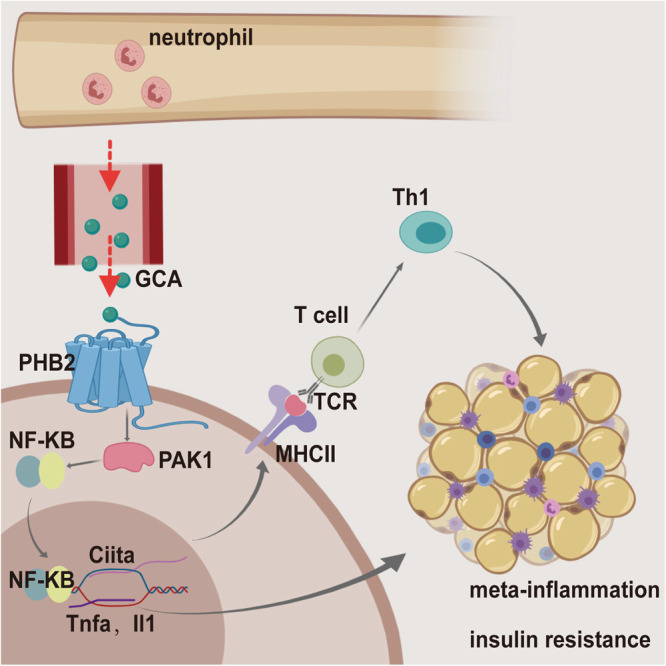
The crosstalk between the bone and adipose tissue is known to orchestrate metabolic homeostasis, but the underlying mechanisms are largely unknown. Herein, we find that GCA + (grancalcin) immune cells accumulate in the bone marrow and release a considerable amount of GCA into circulation during obesity. Genetic deletion of Gca in myeloid cells attenuates metabolic dysfunction in obese male mice, whereas injection of recombinant GCA into male mice causes adipose tissue inflammation and insulin resistance. Mechanistically, we found that GCA binds to the Prohibitin-2 (PHB2) receptor on adipocytes and activates the innate and adaptive immune response of adipocytes via the PAK1-NF-κB signaling pathway, thus provoking the infiltration of inflammatory immune cells. Moreover, we show that GCA-neutralizing antibodies improve adipose tissue inflammation and insulin sensitivity in obese male mice. Together, these observations define a mechanism whereby bone marrow factor GCA initiates adipose tissue inflammation and insulin resistance, showing that GCA could be a potential target to treat metainflammation.


Conflict of interest statement

The authors declare no competing interests.

Figures

Fig. 1
Fig. 1. Obesity induces a dynamic increase of grancalcin + (GCA + ) immune cells in the bone marrow.
a Western Blot of grancalcin (GCA) protein level in the bone marrow of high-fat diet (HFD)-induced mice (n = 4) (top, representative pictures of Western blot; bottom, quantitative measurements of GCA proteins). b Immunofluorescent staining of GCA (green) and Ly6g(red) in the bone section of normal chow diet (NCD) or HFD-induced mice (n = 4) (left, representative pictures of Immunofluorescent staining; right, quantitative measurements of Ly6g and GCA proteins). The nucleuses were stained with DAPI. Scale bar, 200 µm. c Enzyme-linked Immunosorbent Assay (ELISA) of serum GCA concentrations in male C57BL/6 mice fed NCD or HFD for 1, 2, 4, 8, or 12 weeks (n = 6). d Violin plots of log-transformed gene expression of Gca genes in cell populations of NCD mice and HFD mice. e Violin plots of log-transformed gene expression of Gca in different clusters of bone marrow neutrophils from NCD mice and HFD mice. (f) The heatmap of 20 most upregulated genes in clusters 1, 2, and 3 defined in (e). g Serum GCA concentrations in individuals with (n = 38) or without (n = 12) obesity. The characteristics of the study population are provided in the Table S1. h–k Correlation analysis between GCA and homeostasis model assessment of insulin resistance (HOMA-IR), serum interleukin 6 (IL6), tumor necrosis factor α (TNFα), matrix metallopeptidase 2 (MMP2) in human participants (n = 50). Data are presented as means ± SEM. n indicates the number of biologically independent samples examined. Statistical analysis was assessed by two-sided Student’s t test (a, b, g), One-way ANOVA with Tukey’s multiple-comparison test (c) or two-sided Spearman’s correlation (hk) and significant differences were indicated with p values. Source data are provided as a Source Data File.
Fig. 2
Fig. 2. GCA deficiency in myeloid lineage ameliorates adipose tissue inflammation and glucose metabolism.
a Serum GCA concentrations in Gca-Lyz2-CKO and WT mice (n = 6). bd Fasting blood glucose, fasting insulin and HOMA-IR index of Gca-Lyz2-CKO and WT mice fed with HFD for 12 weeks (n = 6). e, f Blood glucose (e) and area under curve (f) of Gca-Lyz2-CKO and wild type (WT) mice fed with HFD for 12 weeks during intraperitoneal glucose tolerance test (GTT) (n = 6). g Serum insulin concentrations during GTT (n = 6). h Blood glucose in Gca-Lyz2-CKO and WT mice fed with HFD for 12 weeks during intraperitoneal insulin tolerance test (ITT) (n = 6). i Area under curve (AUC) of Gca-Lyz2-CKO and WT mice fed with HFD for 12 weeks during ITT (n = 6). The values of the y-axis in AUC are the absolute measured blood glucose concentrations. j, k Western Blot of insulin-stimulated AKT phosphorylation in epidydimal white adipose tissue (eWAT), liver and muscle j and quantitation of pAKT/tAKT k from Gca-Lyz2-CKO and WT mice fed with HFD for 12 weeks (n = 4). l–n Quantitative Polymerase Chain Reaction (QPCR) analysis of inflammatory cytokine gene expression levels in eWAT, adipocyte and liver of Gca-Lyz2-CKO and WT mice fed with HFD for 12 weeks (n = 6). o F4/80 immunohistochemistry and flow analyses of macrophage in eWAT from Gca-Lyz2-CKO and WT mice fed with HFD for 12 weeks (n = 3). Scale bar, 250 µm. p QPCR analysis of the proinflammatory Th1 marker genes (Tbx21 and Ifng), Treg (Foxp3) and Th2(Gata3) in SFV of Gca-Lyz2-CKO and WT mice fed with HFD for 12 weeks (n = 6). q Flow cytometry analysis of CD4+Tbet+ Th1 cells and CD4+Foxp3+ Treg cells in eWAT from Gca-Lyz2-CKO and WT mice fed with HFD for 12 weeks (n = 3). Data are presented as means ± SEM. n indicates the number of biologically independent samples examined. Statistical analysis was assessed by two-sided Student’s t test (ad, f, i and k–q) or two-way ANOVA followed with Sidak’s multiple comparisons test (e,g and h) and significant differences were indicated with p values. Source data are provided as a Source Data File.
Fig. 3
Fig. 3. GCA exacerbates adipose tissue inflammation in NCD-fed mice.
a Inflammatory cytokine gene expression levels in eWAT from NCD-fed WT mice treated with PBS or rGCA (n = 6). b F4/80 immunohistochemistry and flow analyses of macrophage in eWAT from NCD-fed WT mice treated with PBS or rGCA (n = 3). Scale bar, 250 µm. c QPCR analysis of the proinflammatory Th1 marker genes (Tbx21 and Ifng), Treg (Foxp3) and Th2 (Gata3) in SFV from NCD-fed WT mice treated with PBS or GCA (n = 6). d Flow cytometry analysis of CD4+Tbet+ Th1 cells and CD4+Foxp3+ Treg cells in eWAT from NCD-fed WT mice treated with PBS or GCA (n = 3). Data are presented as means ± SEM. n indicates the number of biologically independent samples examined. Statistical analysis was assessed by two-sided Student’s t test and significant differences were indicated with p values. Source data are provided as a Source Data File.
Fig. 4
Fig. 4. GCA exacerbates adipose tissue inflammation, insulin resistance and glucose intolerance in HFD-fed mice.
a Inflammatory cytokine gene expression levels in eWAT from HFD-fed WT mice treated with PBS or rGCA (n = 6). b F4/80 immunohistochemistry and flow analyses of macrophage in eWAT from HFD-fed WT mice treated with PBS or rGCA (n = 3). Scale bar, 250 µm. c QPCR analysis of the proinflammatory Th1 marker genes (Tbx21 and Ifng), Treg (Foxp3) and Th2(Gata3) in SFV from HFD-fed WT mice treated with PBS or GCA (n = 6). d Flow cytometry analysis of CD4+Tbet+ Th1 cells and CD4+Foxp3+ Treg cells in eWAT from HFD-fed WT mice treated with PBS or GCA (n = 3). e–g Fasting blood glucose, fasting insulin and HOMA-IR index of HFD-fed mice treated with PBS or rGCA (n = 6). h–i Time courses of blood glucose (h) and serum insulin concentrations (i) in HFD-fed mice treated with PBS or rGCA during an intraperitoneal glucose tolerance test (GTT) (n = 6). j ITT of HFD-fed animals treated with PBS or rGCA (n = 6). The values for each line of the ITT graph represents the percentage of the measured concentration at time 0 for each group presented. k AUC of ITT (n = 6), in which the values of the y-axis are the absolute measured blood glucose concentrations. Western Blot of insulin-stimulated AKT phosphorylation in eWAT, liver and muscle and quantitation of pAKT/tAKT from HFD-fed animals treated with PBS or rGCA (n = 4). Data are presented as means ± SEM. n indicates the number of biologically independent samples examined. Statistical analysis was assessed by two-sided Student’s t test (a–g, h (right), k and l) or two-way ANOVA followed with Sidak’s multiple comparisons test (h (left)–j) and significant differences were indicated with p values. Source data are provided as a Source Data File.
Fig. 5
Fig. 5. GCA magnifies inflammation in adipocytes in vitro.
a–d QPCR analysis of Ccl2 (a), Il1b (b), Il6 (c) and Tnfa (d) in differentiated primary adipocytes administrated with GCA concentrations ranging from 10 to 100 nM (n = 3). e–h QPCR analysis of Ccl2 (e), Il1b (f), Il6 (g) and Tnfa(h) expression in cultured primary adipocytes administrated with 100 nM GCA or PBS analyzed at four time points during adipogenic induction differentiation process(n = 3). (i–l) The protein secretion of CCL2 (i), IL1b (j), IL6 (k) and TNFα (l) at day 14 of adipogenic induction differentiation process in primary adipocytes administrated with 100 nM GCA or PBS (n = 6). m QPCR analysis of MHCII family genes in primary adipocytes treated with GCA or PBS (n = 3). n A model illustrating 3T3-L1 adipocytes and T-cell co-culture assay. This diagram was created with MedPeer.com. o ELISA of interferon γ (IFNγ) concentrations in the cell culture supernatants after co-culture assay (n = 3). p Flow cytometry analysis for the percentages of CD4+Tbet+ T cells after co-culture assay (n = 3). Data are presented as means ± SEM. n indicates the number of biologically independent samples examined. Statistical analysis was assessed by one-way ANOVA with Tukey’s multiple-comparison test (a–d, o and p), two-sided Student’s t test (i–m) or two-way ANOVA followed with Sidak’s multiple comparisons test (e–h) and significant differences were indicated with p values. Source data are provided as a Source Data File.
Fig. 6
Fig. 6. PHB2 is a functional receptor of GCA in adipocyte.
a The mass spectrum of prohibitin 2 (PHB2). b–c Immunoprecipitation (IP) analysis of Myc-GCA (b) and HA-PHB2 (c) binding. d Immunofluorescent staining of PHB2(green) in differentiated 3T3-L1. The cytoplasmic membrane was stained with Dil (red). Scale bars, 10 μm. e IP analysis of various GCA deletion mutants and their binding to full-length PHB2. f IP analysis of various PHB2 deletion mutants and their binding to full-length GCA. g QPCR analysis of inflammatory cytokine gene expression levels in eWAT of control mice and Phb2 knockdown mice with or without GCA treatment (n = 6). h Flow analyses of macrophage in eWAT from control mice, AAV9-shNC mice and AAV9-shPhb2 mice treated with GCA or PBS for 8 weeks (n = 3). i–k Fasting blood glucose, fasting insulin and HOMA-IR index of control mice, AAV9-shNC mice and AAV9-shPhb2 mice treated with GCA or PBS for 8 weeks (n = 6). l, m GTT and ITT of control mice, AAV9-shNC mice and AAV9-shPhb2 mice treated with GCA or PBS for 8 weeks (n = 6). (n) AUC of ITT (n = 6), in which the values of the y-axis are the absolute measured blood glucose concentrations. o Western Blot of insulin-stimulated AKT phosphorylation in eWAT, liver and muscle(left) and quantitation of pAKT/tAKT(right) from control mice, AAV9-shNC mice and AAV9-shPhb2 mice treated with GCA or PBS for 8 weeks (n = 4). Data are presented as means ± SEM. n indicates the number of biologically independent samples examined. Data shown in b, c, d, e, f are representative images of three independent experiments with similar results. Statistical analysis was assessed by one-way ANOVA with Tukey’s multiple-comparison test (g–k, l (right), n, o (right) or two-way ANOVA followed with Sidak’s multiple comparisons test (m) and significant differences were indicated with p values. Source data are provided as a Source Data File.
Fig. 7
Fig. 7. GCA promotes phosphorylation of PAK1- NF-κB downstream of PHB2 signaling.
a Global quantitative phosphoproteomic analysis using differentiated 3T3-L1 adipocytes treated with GCA, PBS, or siRNA-PHB2. bc Statistics (b) and volcano plot (c) of dysregulated phosphorylations. d Heatmap of the p21-activating kinase (PAK1) and its targets phosphorylation levels in the indicated groups. e Images of immunoprecipitation (IP) analysis using antibody target PHB2 followed by western blotting analysis using antibodies target PAK1 and PHB2. Data shown are representative images of three independent experiments with similar results. f Representative images of western blotting analysis of proteins/phosphorylations as indicated in differentiated 3T3-L1 adipocytes treated with GCA or siRNA-PHB2 (n = 3). g Representative immunofluorescent images of P65 (green) and Perilipin A(red) in differentiated 3T3-L1 adipocytes with addition of 10 μM IPA-3(PAK1 inhibitors) or DMSO and with or without GCA treatment (n = 3). The nuclei were stained with DAPI. (n = 4). Scale bar, 10 μm. h Representative images of western blotting analysis of p-P65(left) and quantitation of p-P65/P65(right) in differentiated 3T3-L1 adipocytes with addition of 10 μM IPA-3(PAK1 inhibitors) or DMSO and with or without GCA treatment (n = 6). i QPCR analysis of MHCII family genes in differentiated 3T3-L1 adipocytes with addition of IPA-3 or DMSO and with or without GCA treatment (n = 3). j–m QPCR analysis of Il1b(j), Il6 (k), Tnfa (l) and Ccl2 (m) in differentiated 3T3-L1 with addition of IPA-3 or DMSO and with or without GCA treatment (n = 3). Data are presented as means ± SEM. n indicates the number of biologically independent samples examined. Statistical analysis was assessed by two-sided Student’s t test (c) or one-way ANOVA with Tukey’s multiple-comparison test (f and hm) and significant differences were indicated with p values. Source data are provided as a Source Data File.
Fig. 8
Fig. 8. GCA-neutralizing antibody (GCA-NAb) improves adipose tissue inflammation and insulin sensitivity in obese mice.
ac Inflammatory gene expression in eWAT(a), liver(b) and adipocyte(c) from DIO mice treated with PBS or different concentrations of GCA-NAb for 2 months (n = 6). d F4/80 immunohistochemistry and flow analyses of macrophage in eWAT from DIO mice treated with PBS or different concentrations of GCA-NAb for 2 months (n = 3). e Gene expression in SVF from diet-induced obesity (DIO) mice treated with PBS or different concentrations of GCA-NAb for 2 months (n = 6). f Flow cytometry analysis of CD4+Tbet+ Th1 cells and CD4+Foxp3+ Treg cells in eWAT from DIO mice treated with PBS or different concentrations of GCA-NAb for 2 months (n = 3). gi Fasting blood glucose, fasting insulin and HOMA-IR index of DIO mice treated with PBS or different concentrations of GCA-NAb for 2 months (n = 6). jk GTT and ITT of DIO mice treated with PBS or different concentrations GCA-NAb for 2 months (n = 6). The values for the GTT graph are the absolute measured blood glucose concentrations, but for the ITT graph, the values for each different group represent the percentage of the initial measured blood glucose concentration at time 0 for that group. l AUC of ITT, in which the values of the y-axis are the absolute measured blood glucose concentrations (n = 6). Data are presented as means ± SEM. n indicates the number of biologically independent samples examined. Statistical analysis was assessed by one-way ANOVA with Tukey’s multiple-comparison test and significant differences were indicated with p values. Source data are provided as a Source Data File.
Fig. 9
Fig. 9. Scheme of myeloid-derived grancalcin instigates obesity-induced insulin resistance and metabolic inflammation.
Obesity induces neutrophils and monocytes-macrophages producing copious amount of GCA. And GCA binds to the Prohibitin-2 (PHB2) receptor on adipocytes and activated the innate and adaptive immune response of adipocytes via PAK1-nuclear factor kappa-B (NF-κB) signaling pathway, thus provoking initiates adipose tissue inflammation and insulin resistance. This diagram was created with MedPeer.com.

References

    1. Reilly SM, Saltiel AR. Adapting to obesity with adipose tissue inflammation. Nat. Rev. Endocrinol. 2017;13:633–643. doi: 10.1038/nrendo.2017.90. - DOI - PubMed
    1. Cox AR, et al. The rheumatoid arthritis drug auranofin lowers leptin levels and exerts antidiabetic effects in obese mice. Cell Metab. 2022;34:1932–1946.e1937. doi: 10.1016/j.cmet.2022.09.019. - DOI - PMC - PubMed
    1. Crewe C, An YA, Scherer PE. The ominous triad of adipose tissue dysfunction: inflammation, fibrosis, and impaired angiogenesis. J. Clin. Invest. 2017;127:74–82. doi: 10.1172/JCI88883. - DOI - PMC - PubMed
    1. Rosen ED, Spiegelman BM. What we talk about when we talk about fat. Cell. 2014;156:20–44. doi: 10.1016/j.cell.2013.12.012. - DOI - PMC - PubMed
    1. Hall JA, et al. Obesity-Linked PPARγ S273 Phosphorylation Promotes Insulin Resistance through Growth Differentiation Factor 3. Cell Metab. 2020;32:665–675.e666. doi: 10.1016/j.cmet.2020.08.016. - DOI - PMC - PubMed

Publication types