. 2024 Jan 2;15(1):90.
doi: 10.1038/s41467-023-44121-1.

Histone lactylation couples cellular metabolism with developmental gene regulatory networks

Affiliations

Histone lactylation couples cellular metabolism with developmental gene regulatory networks

Fjodor Merkuri et al. Nat Commun. .

Abstract

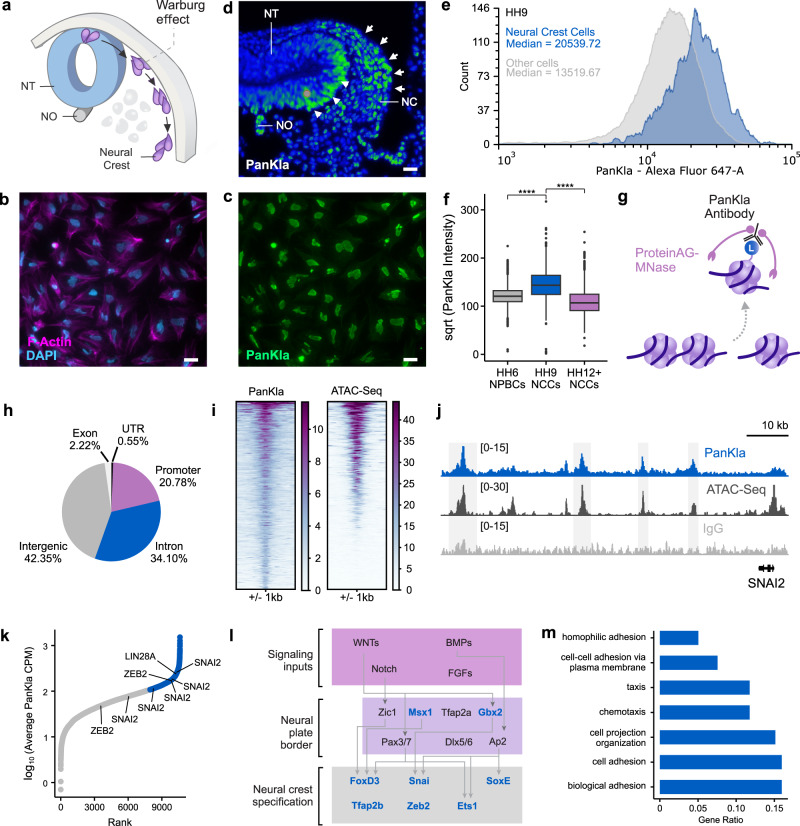
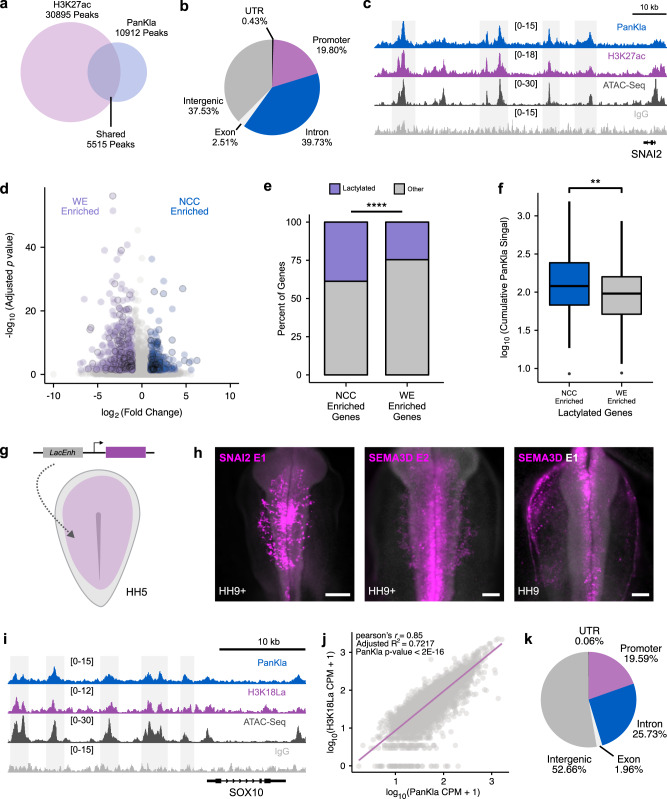
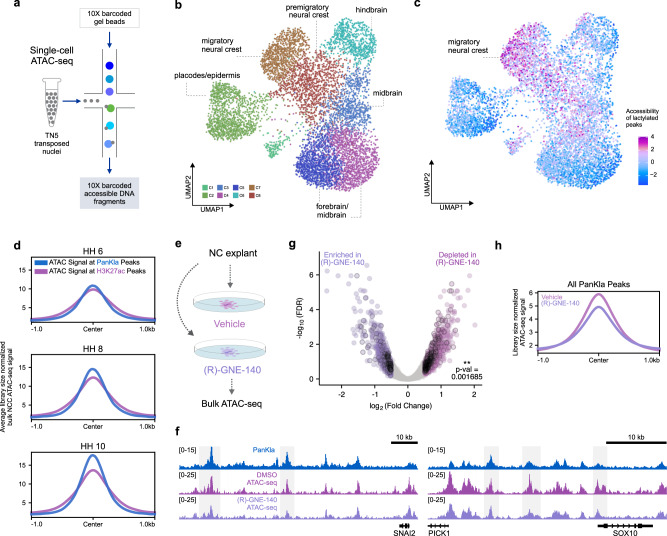
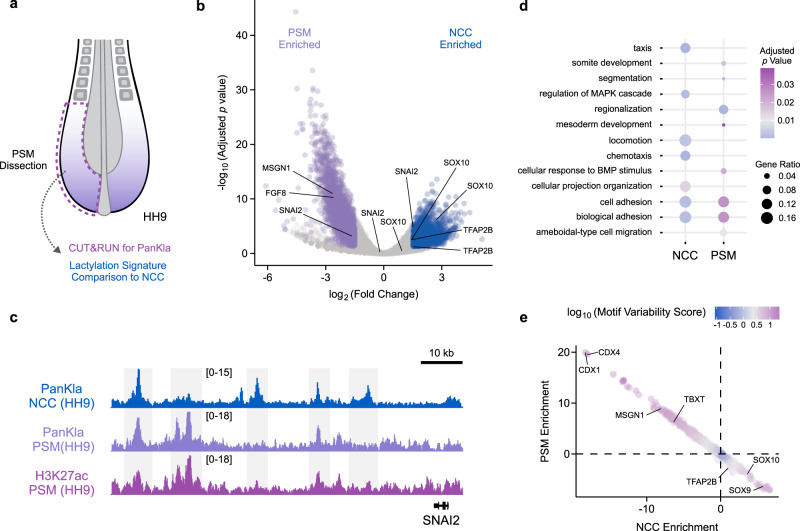
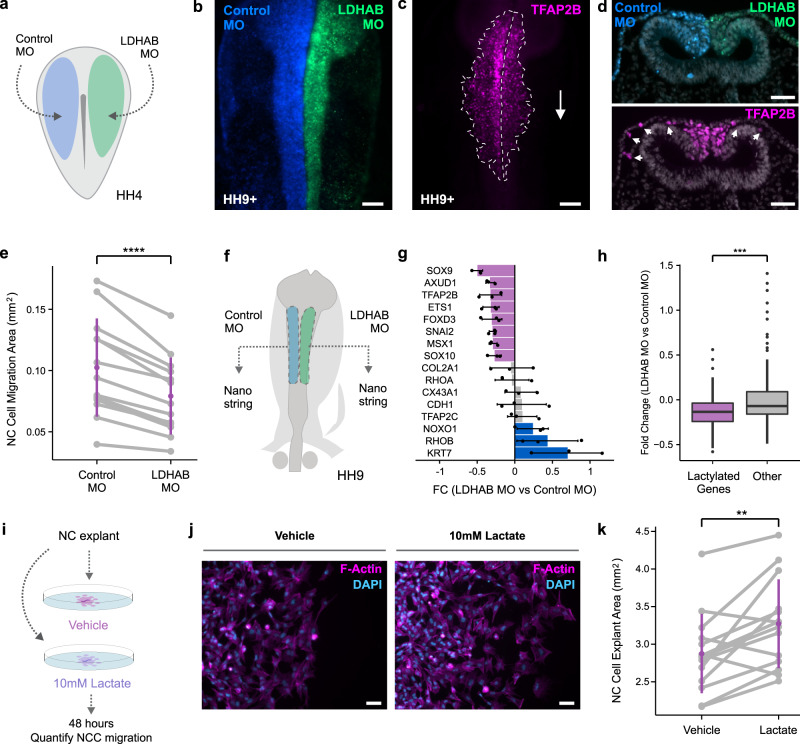
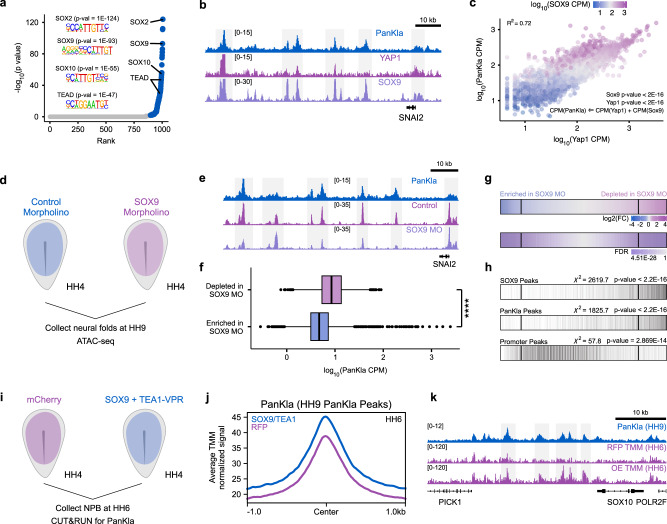
Embryonic cells exhibit diverse metabolic states. Recent studies have demonstrated that metabolic reprogramming drives changes in cell identity by affecting gene expression. However, the connection between cellular metabolism and gene expression remains poorly understood. Here we report that glycolysis-regulated histone lactylation couples the metabolic state of embryonic cells with chromatin organization and gene regulatory network (GRN) activation. We found that lactylation marks genomic regions of glycolytic embryonic tissues, like the neural crest (NC) and pre-somitic mesoderm. Histone lactylation occurs in the loci of NC genes as these cells upregulate glycolysis. This process promotes the accessibility of active enhancers and the deployment of the NC GRN. Reducing the deposition of the mark by targeting LDHA/B leads to the downregulation of NC genes and the impairment of cell migration. The deposition of lactyl-CoA on histones at NC enhancers is supported by a mechanism that involves transcription factors SOX9 and YAP/TEAD. These findings define an epigenetic mechanism that integrates cellular metabolism with the GRNs that orchestrate embryonic development.


Conflict of interest statement

The authors declare no competing interests.

Figures

Fig. 1
Fig. 1. Lactylation exhibits spatiotemporal specificity in NCCs.
a Diagram depicting a cross-section of a chick embryo head with NCC migration path. Increased aerobic glycolysis prior to delamination of NCCs from the neural tube (NT) promotes EMT and migration. The neural tube (NT) and notochord (NO) are also labeled. Reprinted from Bhattacharya et al., with permission from Elsevier. b, c IF staining for PanKla of migratory NCCs from explant cultures showing enrichment of lactylation in the nuclei (n = 4/4 biological replicates with similar results). Scale bars represent 20 µm. d Pseudocolor image of PanKla fluorescence intensity from IF staining on transverse section from HH12 embryonic head displaying the enrichment of lactylation in NCCs (white arrows) and cells in the NT (white arrowheads) (n = 2/2 biological replicates with similar results). Scale bar represents 20 µm. e Histogram of PanKla fluorescence intensity from the flow cytometric analysis of HH9 embryonic heads. Distribution of lactylation levels in TFAP2B+ NCCs (blue, n = 1546) are overlayed on the distribution of lactylation levels in other (TFAP2B-) embryonic head cells (gray, n = 15,559). The median for each distribution is shown. f Boxplots of square-root-transformed PanKla fluorescence intensity (Alexa647-A) in PAX7+ NPBCs (n = 2591) from HH6 embryos and AP2B+ NCCs from HH9 (n = 1537) and HH12–13 (n = 2471) embryos. ****p value < 2 × 10−16, Kruskal–Wallis test (χ2 = 2619.7, degrees of freedom (df) = 2), followed by ad hoc pair-wise Wilcoxon rank sum test. The p value was corrected for multiple comparisons using FDR approach. Boxplot center line is median, box limits are upper and lower quartiles, whiskers are the 1.5X interquartile range, and individual points are outliers. g Schematic depicting CUT&RUN working principle involving antibody-targeted digestion of chromatin by ProteinAG-MNase fusion protein. h Pie chart showing the genomic distribution of PanKla peaks in HH9 NCCs. i Tornado plots showing PanKla and ATAC-seq signal at consensus PanKla peakset. j Genome browser tracks showing PanKla CUT&RUN and ATAC-seq peaks at the SNAI2 locus. IgG track included as a control. k Scatter plot of consensus PanKla peaks ranked by their average sequencing-depth normalized signal between replicate CUT&RUNs (n = 10,612 peaks). Peaks associated with important NCC genes are labeled with the genes they correspond to. Peak with the highest levels of lactylation, upon binning the data, are labeled in blue. l Schematic of initial modules of the NCC GRN with genes containing lactylation peaks highlighted in blue. m Bar plot displaying a subset of significant (FDR < 0.05) results from the gene ontology enrichment analysis of genes associated with the top third PanKla peaks with highest average signal. Results obtained by using the enrichGO() function of the R package clusterProfiler to run a gene ontology over-representation test. RefSeq gene annotation tracks are used to visualize genes in genome browser panels. Non-curated non-coding RNA annotations are not displayed.
Fig. 2
Fig. 2. Lactylation marks active tissue-specific enhancers.
a Venn diagram showing the overlap between consensus H3K27ac and PanKla peaksets from HH9 NCCs. b Pie chart showing the genomic distribution of lactylation peaks that overlap with H3K27ac peaks. c Genome browser tracks showing PanKla CUT&RUN, H3K27ac CUT&RUN, and ATAC-seq peaks at the SNAI2 locus. IgG track included as a control. d Volcano plot of genes from LRT comparing NCCs to WE cells across six developmental stages. Genes that are significantly enriched in NCCs are labeled in blue whereas genes that are significantly enriched in WE are labeled in purple (FDR < 0.05, log2FoldChange cutoff set to 1 in both directions). Genes associated with lactylation peaks are outlined in black. e Mosaic plot showing the percentage of lactylated genes in the NCC and WE gene sets. Lactylated genes are enriched in the NCC gene set (n = 279 total genes) compared to the WE gene set (n = 523 total genes). ****p value < 0.0001 (p value = 4.689 × 10−5), a chi-squared test was used to test for the association of lactylation status and gene set (χ2 = 16.57, df = 1). f Boxplots of the cumulative sequencing-depth normalized PanKla signal of each lactylated gene in the NCC (n = 108) and WE (n = 129) gene sets. NCC-enriched genes have higher lactylation levels compared to WE-enriched genes. **p value < 0.01 (p value = 0.005882), two-tailed two-sample homoscedastic t-test (t = 2.7797, df = 235, 95% CI [0.0423, 0.248]). Boxplot center line is median, box limits are upper and lower quartiles, whiskers are the 1.5X interquartile range, and individual points are outliers. g Diagram depicting injection of enhancer reporter construct containing putative lactylated enhancer (LacEnh) cloned upstream of a minimal promoter into HH4 chicken embryo. h Embryos expressing GFP reporter driven by sequences underlying lactylation peaks in the SNAI2 (n = 3/3 biological replicates with similar results) and SEMA3D genomic loci (n = 2/2 biological replicates for each SEMA3D enhancer show similar results). SNAI2E1 scale bar represents 200 µm and SEMA3DE2/ SEMA3DE1 scale bar represents 100 µm. i Genome browser tracks showing PanKla CUT&RUN, H3K18La CUT&RUN, and ATAC-seq peaks at the SOX10 locus. IgG track included as a control. j Genome-wide correlation of H3K18La and PanKla average sequencing-depth normalized signal at PanKla consensus peakset (n = 10,912). Linear regression was used to model the relationship between the two variables. k Pie chart showing the genomic distribution of H3K18La peaks. RefSeq gene annotation tracks are used to visualize genes in genome browser panels. Non-curated non-coding RNA annotations are not displayed.
Fig. 3
Fig. 3. Lactylation promotes accessibility of genomic regions in NCCs.
a Schematic depicting scATAC-seq workflow. b UMAP projection of scATAC-seq profiles of cells from the dorsal midline of HH9 embryos. Dots represent individual cells while colors indicate cluster identity (labeled). c UMAP projection colored by the degree of accessibility of lactylation-enriched peaks (relative to H3K27ac) from the PanKla CUT&RUN. Lactylated genomic loci are specifically accessible in NCC clusters (C7 and C8). d Profile plots showing the average (between two biological replicates) cumulative ATAC-seq signal at consensus peaks from the PanKla (blue) and H3K27ac (magenta) CUT&RUNs. ATAC-seq data are from samples that consist of sorted NCCs at three developmental stages (HH6, HH8, and HH10). The accessibility of lactylated genomic loci increases as NCCs begin to migrate. e Schematic depicting treatment of NCC explants from HH9 embryos in defined culture conditions with DMSO or 40 uM (R)-GNE-140. ATAC-seq was performed on explants 12 h after treatment to assess the effects of (R)-GNE-140 treatment on chromatin accessibility. f Genome browser tracks showing PanKla CUT&RUN, DMSO and (R)-GNE-140 ATAC-seq peaks at the SNAI2 and SOX10 loci. g Volcano plot showing differentially accessible control peaks between DMSO and (R)-GNE-140 treatments. Differential accessibility analysis was performed using the DBA_EDGER method within the R package DiffBind. Peaks that are significantly depleted in (R)-GNE-140 are labeled in magenta, whereas peaks that are significantly enriched in (R)-GNE-140 are labeled in purple (log2Fold Change cutoff set to 0.5 in both directions). Lactylated peaks are outlined in black. A chi-squared test was used to test for the association of lactylation status and enrichment/depletion in (R)-GNE-140 (χ2 = 9.8649, df = 1, p value = 0.001685). Of the 1699 ATAC-seq peaks that were depleted in (R)-GNE-140, 269 were lactylated whereas only 138 peaks were lactylated among the 1187 peaks that were enriched in (R)-GNE-140. h Profile plots showing the average cumulative ATAC-seq signal of DMSO (magenta) and (R)-GNE-140 (purple) samples at consensus peaks from the PanKla CUT&RUN. RefSeq gene annotation tracks are used to visualize genes in genome browser panels. Non-curated non-coding RNA annotations are not displayed.
Fig. 4
Fig. 4. Deposition of lactylation is cell-type specific.
a Diagram depicting dissection of posterior embryonic tissue containing PSM cells. CUT&RUN for PanKla was performed on PSM tissue and the lactylation signature was compared to that of NCCs. b Volcano plot of differential lactylation peaks between NC and PSM cells. Genes associated with lactylation peaks are labeled on the plot. Significant (FDR < 0.05) lactylation peaks enriched in NCCs are labeled in blue whereas lactylation peaks enriched in PSM cells are labeled in purple (log2Fold Change cutoff set to 1.5 in both directions, DiffBind concentration score >3). Differential accessibility analysis was performed using the DBA_EDGER method within the R package DiffBind. c Genome browser tracks showing NCC and PSM PanKla CUT&RUNs as well as PSM H3K27ac CUT&RUN (Supplementary Fig. 5D–F) at the SNAI2 locus. d Dot plot displaying a subset of significant (FDR < 0.05) results from the gene ontology enrichment analysis of genes associated with NCC or PSM enriched peaks. Results obtained by using the enrichGO() function of the R package clusterProfiler to run a gene ontology over-representation test. e Scatterplot of chromVAR results showing the differential enrichment of transcription factor binding motifs in NC and PSM cells. Axes represent the average deviation z-score of lactylation peaks containing specific motifs in both NCC and PSM samples. Color indicates the variability score of a specific motif in the differential analysis peakset. RefSeq gene annotation tracks are used to visualize genes in genome browser panels. Non-curated non-coding RNA annotations are not displayed.
Fig. 5
Fig. 5. Reducing lactylation through LDHA/B loss-of-function impedes NCC migration.
a Diagram depicting the bilateral injection of control and LDHA/B MOs in HH4 embryos. b Representative image of HH9+ embryo transfected with Control and LDHA/B MOs. Scale bar represents 100 µm. c IF staining for TFAP2B in embryo from (b) showing reduced NCC migration on the LDHA/B-transfected side. Scale bar represents 100 µm. d Transverse section of HH9+ embryo transfected with Control and LDHA/B MOs. IF staining for TFAP2B shows reduced NCC migration on the LDHA/B-transfected side compared to Control MO side. Scale bar represents 50 µm. e Paired stripchart showing the quantification of NCC migration area from whole mount TFAP2B-stained HH9-HH10 embryos (n = 14 biological replicates). Purple bars represent standard deviation. ****p value < 0.0001 (p value = 1.004 × 10−5), two-tailed paired homoscedastic t-test (t = 7.2574, df = 12, 95% CI [0.0163, 0.0303]). f Diagram of HH9 embryo depicting experimental strategy for Nanostring experiment. Control and LDHA/B MO transfected neural folds were collected from the same embryo. Nanostring was performed on single paired neural folds. g Bar plot showing fold change (FC) of mRNA levels in LDHA/B MO vs. Control MO samples for important genes in the NCC GRN. Error bars are standard deviation of three biological replicates (n = 3). h Boxplots showing the fold change (LDHA/B vs. Control MO) of lactylated (n = 76) and non-lactylated, or “other” (n = 123) genes in the Nanostring probeset. Lactylated genes are, on average, down-regulated more than other genes in LDHA/B MO neural folds. ***p value < 0.001 (p value = 0.0001383), two-tailed independent heteroscedastic t-test (t = −3.8885, df = 194.76, 95% CI [−0.2255, −0.0737]). Boxplot center line is median, box limits are upper and lower quartiles, whiskers are the 1.5X interquartile range, and individual points are outliers. i Diagram depicting experimental strategy for assessing the effects of lactate treatment on NCC migration. Neural fold explants for control and lactate treatment were collected in a paired fashion from the same embryo. j Staining of NCC explants treated with vehicle (1X PBS) or 10 mM sodium lactate with Phalloidin and DAPI. Scale bar represents 50 µm. k Paired stripchart showing the quantification of NCC explant area (n = 14 biological replicates). Purple bars represent standard deviation. **p value < 0.01 (p value = 0.005), two-tailed paired homoscedastic t-test (t = 3.4, df = 13, 95% CI [0.1417, 0.6526]). Graphics in (a) and (f) were reprinted from Bhattacharya et al., with permission from Elsevier.
Fig. 6
Fig. 6. SOX9 and YAP/TEAD contribute to the deposition of lactylation at NCC-specific loci.
a Scatter plot of transcription factor binding motifs enriched among PanKla peaks ranked by p value. Motifs with an adjusted q-value (Benjamini) less than 0.05 are labeled in blue. A significant enrichment of SOX and TEAD motifs was observed. HOMER was used to perform enriched motif discovery using exact peak sizes. b Genome browser tracks showing PanKla, YAP1, and SOX9 CUT&RUNs at the SNAI2 locus. c Scatter plot of sequencing depth normalized YAP1 and PanKla signal at PanKla peaks. Color indicates the level of SOX9 signal. The relationship between YAP1, SOX9, PanKla was modeled using multiple linear regression with YAP1 and SOX9 occupancy as explanatory variables and PanKla as a response variable (n = 10,448). d Diagram depicting experimental strategy for Control and SOX9 MO injections in HH4 embryos. Neural folds for each condition were then collected at HH9 and subjected to the ATAC-seq workflow. e Genome browser tracks showing PanKla CUT&RUN, Control MO and SOX9 MO ATAC-seq peaks at the SNAI2 locus. f Boxplots of sequencing depth normalized lactylation signal at ATAC-seq peaks that were significantly (FDR < 0.05) enriched (n = 10,775) or depleted (n = 7270) in the SOX9 MO condition compared to Control MO (log2FC cutoff set to 0.5 in both directions, n = 2 biological replicates). ATAC-seq peaks that are depleted in SOX9 MO transfected NCCs have significantly higher lactylation levels. ****p value < 2 × 10−16, two-tailed Wilcoxon rank sum test (W = 57767759). Boxplot center line is median, box limits are upper and lower quartiles, whiskers are the 1.5X interquartile range, and individual points are outliers. g Row heatmaps showing differentially accessible peaks between Control and SOX9 MO treatments. Each line in the heatmap is a peak. Peaks were initially ranked by log2Fold Change (log2FC) (Control vs. SOX9 MO) and vertical lines were drawn at a log2FC threshold of 0.5 in both directions. Differential accessibility analysis was performed using the DBA_EDGER method within the R package DiffBind. h Plot showing the overlap of peaks from (g) with SOX9 and PanKla CUT&RUN peaks as well as ATAC-seq peaks at promoter regions. Vertical black lines indicate overlap. SOX9 and PanKla peaks are enriched among the significant (FDR < 0.05) peaks that are depleted in the SOX9 MO transfected NCCs whereas promoter peaks don’t show a strong enrichment in the same direction. A chi-squared test was used to test for the association of lactylation or SOX9 peak status and whether that peak is enriched or depleted in the SOX9 MO condition (SOX9 χ2 = 2619.7, df = 1; PanKla χ2 = 1825.7, df = 1; Promoter χ2 = 57.8, df = 1). i Diagram depicting experimental strategy for gain-of-function experiment involving the injection of HH4 embryos with either an pCI-H2B-RFP construct or a mixture of SOX9 and TEA1-VPR constructs. Embryos were collected at HH6, dissected to enrich for NPBCs and subjected to CUT&RUN for PanKla. j Profile plot showing the average cumulative TMM normalized HH6 PanKla CUT&RUN signal of RFP (magenta) and SOX9 + TEA1-VPR (purple) samples at HH9 PanKla CUT&RUN consensus peakset. k Genome browser tracks showing replicate average TMM normalized PanKla signal (HH6) for RFP and over-expression (OE) samples at the SOX10 genomic locus. PanKla CUT&RUN tracks from HH9 samples is also shown. RefSeq gene annotation tracks are used to visualize genes in genome browser panels. Non-curated non-coding RNA annotations are not displayed.

References

    1. Simões-Costa M, Bronner ME. Establishing neural crest identity: a gene regulatory recipe. Development. 2015;142:242–257. doi: 10.1242/dev.105445. - DOI - PMC - PubMed
    1. Gouti M, et al. A gene regulatory network balances neural and mesoderm specification during vertebrate trunk development. Dev. Cell. 2017;41:243–261.e7. doi: 10.1016/j.devcel.2017.04.002. - DOI - PMC - PubMed
    1. Oginuma M, et al. A gradient of glycolytic activity coordinates FGF and Wnt signaling during elongation of the body axis in amniote embryos. Dev. Cell. 2017;40:342–353.e10. doi: 10.1016/j.devcel.2017.02.001. - DOI - PMC - PubMed
    1. Bhattacharya D, Azambuja AP, Simoes-Costa M. Metabolic reprogramming promotes neural crest migration via Yap/Tead signaling. Dev. Cell. 2020;53:199–211.e6. doi: 10.1016/j.devcel.2020.03.005. - DOI - PMC - PubMed
    1. Intlekofer AM, Finley LWS. Metabolic signatures of cancer cells and stem cells. Nat. Metab. 2019;1:177–188. doi: 10.1038/s42255-019-0032-0. - DOI - PMC - PubMed

Publication types

MeSH terms