. 2024 Jan 2;15(1):65.
doi: 10.1038/s41467-023-44548-6.

Hijacking of internal calcium dynamics by intracellularly residing viral rhodopsins

Affiliations

Hijacking of internal calcium dynamics by intracellularly residing viral rhodopsins

Ana-Sofia Eria-Oliveira et al. Nat Commun. .

Abstract

Rhodopsins are ubiquitous light-driven membrane proteins with diverse functions, including ion transport. Widely distributed, they are also coded in the genomes of giant viruses infecting phytoplankton where their function is not settled. Here, we examine the properties of OLPVR1 (Organic Lake Phycodnavirus Rhodopsin) and two other type 1 viral channelrhodopsins (VCR1s), and demonstrate that VCR1s accumulate exclusively intracellularly, and, upon illumination, induce calcium release from intracellular IP3-dependent stores. In vivo, this light-induced calcium release is sufficient to remote control muscle contraction in VCR1-expressing tadpoles. VCR1s natively confer light-induced Ca2+ release, suggesting a distinct mechanism for reshaping the response to light of virus-infected algae. The ability of VCR1s to photorelease calcium without altering plasma membrane electrical properties marks them as potential precursors for optogenetics tools, with potential applications in basic research and medicine.


Conflict of interest statement

The authors declare no competing interests.

Figures
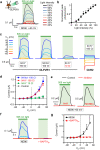
Fig. 1
Fig. 1. Photoactivation of OLPVR1 elicits CaCC currents in Xenopus oocytes.
a Responses to a 10-s pulse of light of decreasing intensity. Current records were taken every 50 s from the same oocyte injected with 30 ng OLPVR1 RNA clamped at +40 mV. Bath solution was ND96. b Average peak current, normalized to current at 100% intensity (75 µW mm-2), vs. light intensity obtained with the protocol of a, applied to 4 oocytes (Error bars, SEM). c Photocurrents at different holding voltages from oocytes expressing OLPVR1 (30 ng RNA) or ChR2 (7.5 ng), in the specified different bath solutions. d OLPVR1 current-voltage relationships obtained from records as in c, in different extracellular ionic conditions. Control refers to currents recorded in non-injected oocytes. Currents were measured after 10-s illumination. (Error bars, SEM; n = 15, 11, 9, and 8 for 94 K+ 100 Cl-, 94 Na+ 100 Cl-, 94 K+ 10 Cl-, and control, respectively). e OLPVR1 photocurrents recorded before (Black) and after (Red) 60’ incubation in ND96 solution containing 30 µM Ani9 or MONNA, inhibitors of TMEM16A CaCCs. Statistics are shown in Supplementary Fig. 1. f Photocurrents from OLPVR1-expressing oocytes (7.5 ng RNA) with and without intracellular injection of BAPTA (BAPTAin) in ND96 bath solution. g Average peak photocurrent vs voltage in ND96 solution with and without injected BAPTA. (Error bars, SEM; n = 9 for ND96, n = 3 for +BAPTAin). Source data are provided as a Source Data file.
Fig. 2
Fig. 2. OLPVR1 is expressed intracellularly and activates surface CaCCs through release of intracellular Ca2+.
a Surface expression of HiBit-tagged OLPVR1HB compared to ChR2HB measured using XenoGlo technique. OLPVR1, in contrast with ChR2, is not expressed at the surface membrane of oocytes. Mean luminescence recorded in oocytes injected with 7.5 ng RNA coding for OLPVR1HB and ChR2HB before (blue) and after (red) membrane permeabilization. The OLPVR1 surface value is 2360 ± 700 RLUs. The numbers of oocytes batches are in parentheses (Error bars, SEM). **P = 0.007, ****P < 0.0001 two-way ANOVA with Sidak’s post hoc test (DF = 60). b Photocurrents elicited by successive 10-s illuminations separated by a 40-s dark interval. Oocytes coexpressing OLPVR1 (30 ng RNA) and Gq-coupled muscarinic M3 receptor (2.5 ng) were bathed in ND96 0Ca solution. c, d Between the 2 illuminations, activation of M3 by ACh (5 µM; 30 s) induced Ca2+ release and large transient CaCC currents. Panel d is an enlarged version of c, showing a drastic reduction of the second photocurrent. e Average ratios of OLPVR1 peak current induced by the second illumination (Peak 2) over that of the first (Peak 1) with and without ACh application in between. Numbers of oocytes are in parentheses (Error bars, SEM). f Photocurrents at +60 mV in ND96 solution from oocytes expressing OLPVR1 (7.5 ng RNA) before (Control) and after 10’ incubation with 10 µM YM-254890. g, h Representative photocurrents at +60 mV in ND96 (g) or 49 Ca2+(h) solution from oocytes expressing OLPVR1 (7.5 ng RNA) before (Control) and after 60’ incubation with 100 µM 2-APB. Statistics are shown in Supplementary Fig. 1. Source data are provided as a Source Data file.
Fig. 3
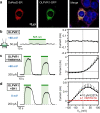
Fig. 3. In mammalian cells, OLPVR1 localizes to the ER and activates surface Ca2+-activated channels through release of intracellular Ca2+.
a Confocal images of HEK293T cells cotransfected with plasmids for expression of the ER-marker DsRed2-ER (red) and GFP-fused OLPVR1 (green). Merge panel shows in yellow, overlapping ER (red) and OLPVR1 (green) signals. The nucleus is in blue and the plasma membrane in magenta. Image is representative of 18 cells from 3 independent transfections. b-d Whole-cell recordings were obtained from HEK293T cells transfected with OLPVR1 alone (b; n = 7) or with OLPVR1 and, either TMEM16A (c; n = 5) or SK1 (d; n = 8). Left panels: Current responses to illumination (green bars, 505 nm light). Cells were held at the indicated voltages. Right panels: Light-induced current (peak current elicited by first illumination – current before illumination) vs. voltage (Error bars, SEM). Currents were elicited by 400-ms voltage ramps from −100 to +100 mV repeated every second. The pipette solution had 10 µM EGTA, except for the current-voltage curve drawn in red (right panel of d) where it had 1 mM EGTA (n = 7). Source data are provided as a Source Data file.
Fig. 4
Fig. 4. A fused Calcium sensor shows OLPVR1-delimited Ca2+ influx from the ER.
a Schematic representation of the calcium-imaging conditions tested. HEK293T cells were transfected with plasmids encoding for wild-type OLPVR1 and GCaMP6s (1&2), the fusion construct OLPVR1-GCaMP6s (3&4) or loss-of-function OLPVR1(K204Q)-GCaMP6s (5) and imaged with an epifluorescence microscope under 470-nm light in the absence (1,3&5) or presence (2&5) of 15 µM BAPTA-AM. b Time courses of fluorescence changes upon light application in the conditions described in a. c Confocal images of cells transfected with a plasmid coding for OLPVR1-GCaMP6s after 2 h incubation in 15 µM BAPTA-AM at T = 0, 15 and 30 s after light application. T = 0 is the first frame acquired after light is turned on. d Average maximal fluorescence changes upon light application of cells from at least 3 independent transfections in the conditions shown in a. Numbers of cells are in parentheses. (Error bars, SEM) e Half times of rise in fluorescence during illumination for conditions 1, 3 and 4. Numbers of cells are in parentheses (Error bars, SEM). **** p < 0.0001, one-way ANOVA, Tukey’s multiple comparisons test, FD (DFn 4, DFd 250) = 71.2; FE (DFn 2, DFd 143) = 68.8. Source data are provided as a Source Data file.
Fig. 5
Fig. 5. Green light induces motion of Xenopus tadpoles expressing OLPVR1.
a Tadpoles from 3 independent batches of mRNA-injected embryos (Control injected with 250 pg lacZ mRNA, and OLPVR1 injected with 1 ng OLPVR1 mRNA) were subjected to 2-200-s green-light pulses and observed for light-triggered behaviour. No lacZ tadpole (n = 31) demonstrated green-light response. 51.4% of OLPVR1-injected tadpoles (n = 35) displayed green-light-dependent motion. b OLPVR1-injected light-responsive tadpoles from 1 batch (n = 5) were subjected to 0.5 mM of tubocurarine and 0.02% MS-222. 80% of tadpoles retained light-responsiveness as seen in middle panel of c. c Images of tadpoles 3-4 days after injection of embryos with LacZ (Control) or OLPVR1 mRNA before (Dark) and during illumination. d Light-induced responses of a single OLPVR1-expressing tadpole (n = 40 illuminations) were variable and consisted of a combination of tail flicking as in c, swimming or post-illumination body twitching (see Supplementary Note 3 & Supplementary Movies 1-5). OLPVR1-expressing tadpoles subjected to tubocurarine and MS-222 only showed tail flicking. e Delays of onset after light application, and offset after light switch-off, of behavioural response of OLPVR1 tadpoles. Numbers of observations are in parentheses (Error bars, SEM). Source data are provided as a Source Data file.

Similar articles

  • Viral rhodopsins 1 are an unique family of light-gated cation channels.
    Zabelskii D, Alekseev A, Kovalev K, Rankovic V, Balandin T, Soloviov D, Bratanov D, Savelyeva E, Podolyak E, Volkov D, Vaganova S, Astashkin R, Chizhov I, Yutin N, Rulev M, Popov A, Eria-Oliveira AS, Rokitskaya T, Mager T, Antonenko Y, Rosselli R, Armeev G, Shaitan K, Vivaudou M, Büldt G, Rogachev A, Rodriguez-Valera F, Kirpichnikov M, Moser T, Offenhäusser A, Willbold D, Koonin E, Bamberg E, Gordeliy V. Zabelskii D, et al. Nat Commun. 2020 Nov 11;11(1):5707. doi: 10.1038/s41467-020-19457-7. Nat Commun. 2020. PMID: 33177509 Free PMC article.
  • History and Perspectives of Ion-Transporting Rhodopsins.
    Kandori H. Kandori H. Adv Exp Med Biol. 2021;1293:3-19. doi: 10.1007/978-981-15-8763-4_1. Adv Exp Med Biol. 2021. PMID: 33398804 Review.
  • [How to Choose the Best Optogenetic Tool for Your Research].
    Hososhima S, Kandori H. Hososhima S, et al. Brain Nerve. 2024 Jul;76(7):835-842. doi: 10.11477/mf.1416202691. Brain Nerve. 2024. PMID: 38970320 Review. Japanese.
  • Advances and prospects of rhodopsin-based optogenetics in plant research.
    Zhou Y, Ding M, Nagel G, Konrad KR, Gao S. Zhou Y, et al. Plant Physiol. 2021 Oct 5;187(2):572-589. doi: 10.1093/plphys/kiab338. Plant Physiol. 2021. PMID: 35237820 Free PMC article. Review.
  • Novel pH-Sensitive Microbial Rhodopsin from Sphingomonas paucimobilis.
    Maliar N, Okhrimenko IS, Petrovskaya LE, Alekseev AA, Kovalev KV, Soloviov DV, Popov PA, Rokitskaya TI, Antonenko YN, Zabelskii DV, Dolgikh DA, Kirpichnikov MP, Gordeliy VI. Maliar N, et al. Dokl Biochem Biophys. 2020 Nov;495(1):342-346. doi: 10.1134/S1607672920060162. Epub 2020 Dec 25. Dokl Biochem Biophys. 2020. PMID: 33368048

Cited by

References

    1. Ernst OP, et al. Microbial and animal rhodopsins: structures, functions, and molecular mechanisms. Chem. Rev. 2014;114:126–163. doi: 10.1021/cr4003769. - DOI - PMC - PubMed
    1. Gordeliy V, et al. Microbial Rhodopsins. Methods Mol. Biol. 2022;2501:1–52. doi: 10.1007/978-1-0716-2329-9_1. - DOI - PubMed
    1. Yutin N, Koonin EV. Proteorhodopsin genes in giant viruses. Biol. Direct. 2012;7:34. doi: 10.1186/1745-6150-7-34. - DOI - PMC - PubMed
    1. Needham DM, et al. A distinct lineage of giant viruses brings a rhodopsin photosystem to unicellular marine predators. Proc. Natl Acad. Sci. USA. 2019;116:20574–20583. doi: 10.1073/pnas.1907517116. - DOI - PMC - PubMed
    1. Moniruzzaman M, Martinez-Gutierrez CA, Weinheimer AR, Aylward FO. Dynamic genome evolution and complex virocell metabolism of globally-distributed giant viruses. Nat. Commun. 2020;11:1710. doi: 10.1038/s41467-020-15507-2. - DOI - PMC - PubMed

Publication types