. 2024 Jan 2;15(1):151.
doi: 10.1038/s41467-023-44323-7.

Deep learning-driven fragment ion series classification enables highly precise and sensitive de novo peptide sequencing

Affiliations

Deep learning-driven fragment ion series classification enables highly precise and sensitive de novo peptide sequencing

Daniela Klaproth-Andrade et al. Nat Commun. .

Abstract

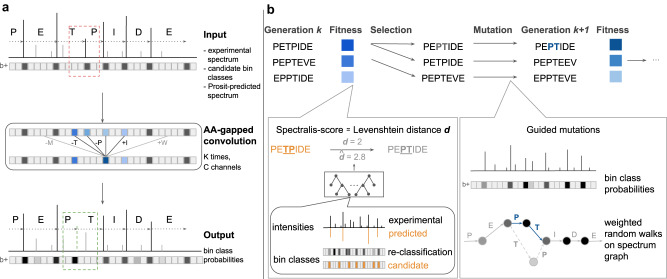
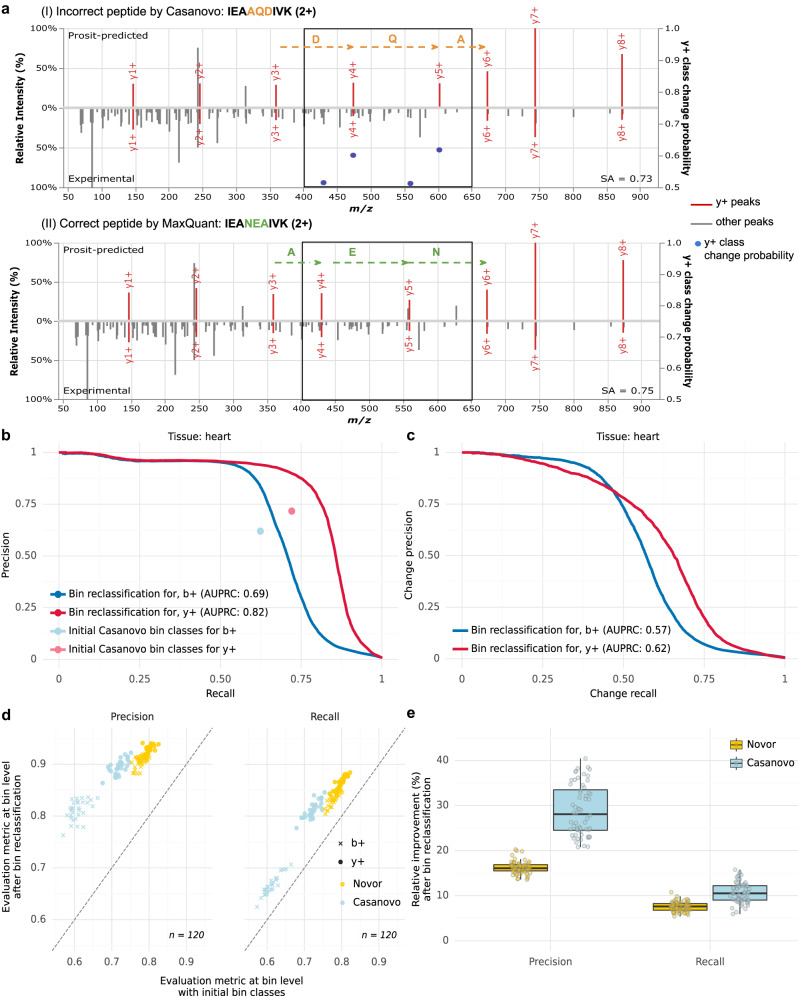
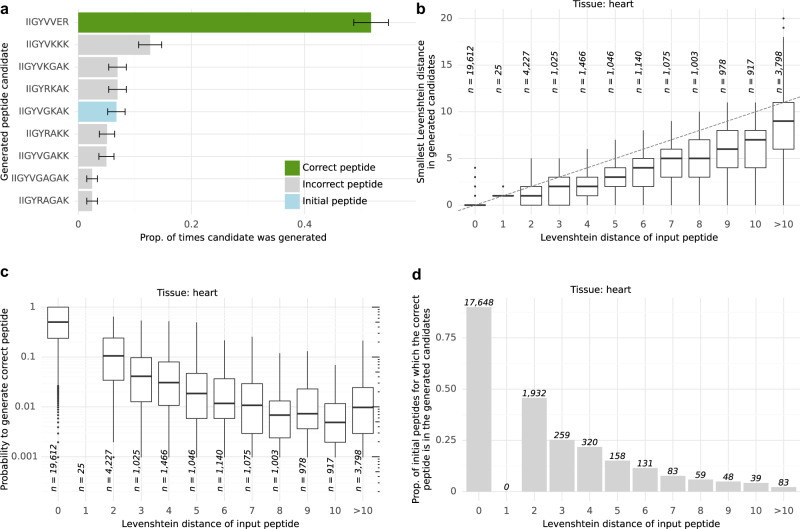
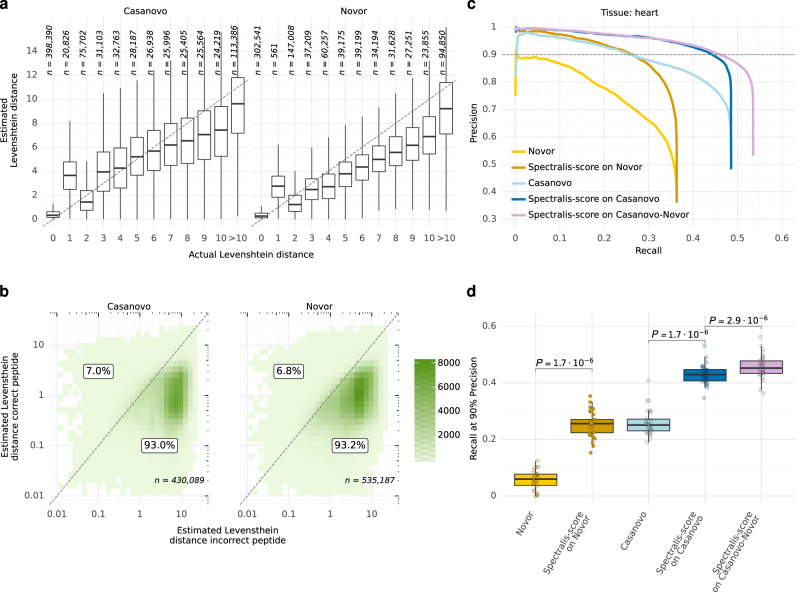
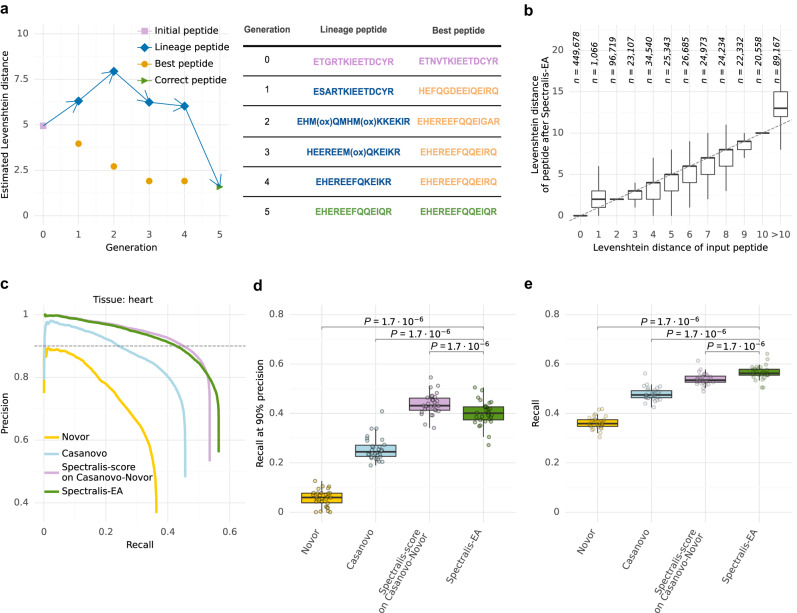
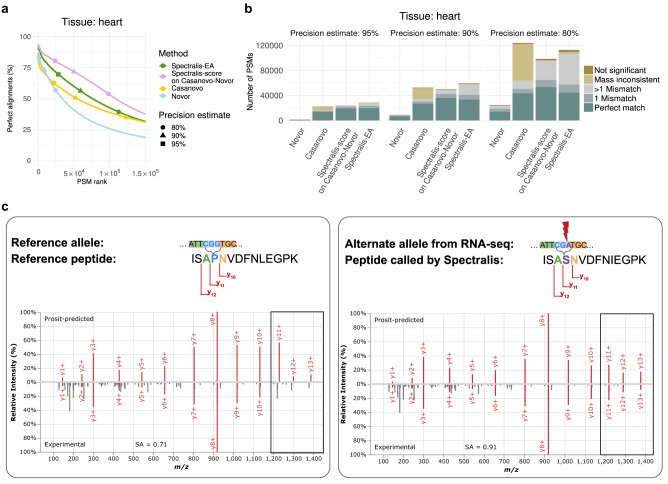
Unlike for DNA and RNA, accurate and high-throughput sequencing methods for proteins are lacking, hindering the utility of proteomics in applications where the sequences are unknown including variant calling, neoepitope identification, and metaproteomics. We introduce Spectralis, a de novo peptide sequencing method for tandem mass spectrometry. Spectralis leverages several innovations including a convolutional neural network layer connecting peaks in spectra spaced by amino acid masses, proposing fragment ion series classification as a pivotal task for de novo peptide sequencing, and a peptide-spectrum confidence score. On spectra for which database search provided a ground truth, Spectralis surpassed 40% sensitivity at 90% precision, nearly doubling state-of-the-art sensitivity. Application to unidentified spectra confirmed its superiority and showcased its applicability to variant calling. Altogether, these algorithmic innovations and the substantial sensitivity increase in the high-precision range constitute an important step toward broadly applicable peptide sequencing.


Conflict of interest statement

M.W. is founder and shareholder of OmicScouts GmbH and MSAID GmbH, with no operational role in either company. The remaining authors declare no competing interests.

Figures

Fig. 1
Fig. 1. Bin reclassification and overview of Spectralis.
a The deep learning architecture for bin reclassification consisting of AA-gapped convolutions for correcting erroneous bin classes (red box) of an input candidate peptide. Input for the model are the binned experimental intensities, the initial bin class labels for y-ions and b-ions, and the binned Prosit-predicted intensities for the input peptide sequence. The model outputs the probabilities for each bin to contain a peak labeled as a y-ion and as a b-ion. b Spectralis-EA is an evolutionary algorithm. Peptide sequences from a generation k are selected based on their fitness to define the next generation k + 1. The fitness, or Spectralis-score, is an estimate of the Levenshtein distance from the input peptide (orange) to the correct peptide (gray). It is obtained with a random forest taking features computed from the experimental and Prosit-predicted spectra and from the output of the bin reclassification model (left inset) as input. The peptides selected for the next generation are mutated by performing random walks along the spectrum graph favoring nodes stemming from bins with high probabilities (right inset).
Fig. 2
Fig. 2. Bin reclassification performance.
a An example of a bin reclassification: (I) Prosit-predicted spectrum (top) and experimental spectrum (bottom) for an incorrect peptide sequence IEAAQDIVK proposed by Casanovo. Singly charged y-ions (y + ) are colored in red. Bin class change probabilities for y-ions are marked with blue dots (secondary y-axis, cropped at 0.5 to not clutter the plot). (II) Prosit-predicted spectrum (top) and experimental spectrum (bottom) for the correct peptide sequence IEANEAIVK identified by MaxQuant at 1% FDR. The region where ion series label predictions differ between (I) and (II) is delimited with boxes. Incorrect residues are marked in orange. The residues differing in the correct sequence are marked in green. The spectral angle (SA) between the experimental and Prosit-predicted spectrum is indicated for both peptide sequences. b Precision-recall curves for bin reclassification of b-ions and y-ions after relabeling initial bin classes proposed by Casanovo on the test set of the heart sample compared to the precision and recall computed at bin level for the initial bin class labeling. The average precision-recall is denoted as AUPRC. c As in (b) for change-precision-recall curves. d Precision (left) and recall (right) after bin reclassification against before when using Novor (yellow) or Casanovo (blue) for the initial peptide. Data on test sets across all n = 30 samples (different tissues). e Distribution of relative improvement of precision and recall after bin reclassification on the test sets of all n = 30 samples (different tissues) over Novor and Casanovo for b-ions and y-ions. The data in (e) are represented as boxplots in which the middle line indicates the median, the bounds of the box indicate the first and third quartiles and the whiskers indicate ±1.5 × IQR (interquartile range) from the third and first quartile, respectively. Source data are provided as a Source Data file.
Fig. 3
Fig. 3. Guided mutation performance.
a Proportion of times that a peptide sequence is generated based on the initial sequence IIGYVGKAK proposed by Casanovo out of n = 1024 generated candidate peptides with guided mutations. The green bar shows the proportion of times that the correct sequence IIGYVVER was generated. The blue bar shows the proportion of times that the initial sequence was generated. Error bars represent 95% confidence intervals of the performed two-sided binomial test. b Distribution of the smallest Levenshtein distance among 1024 guided mutations as a function of the Levenshtein distance of the initial peptides on the heart sample. c Distribution of the probability to generate the correct peptide sequence among 1024 draws against Levenshtein distances of the initial peptide sequences on the heart sample. d Proportion of initial peptides for which the correct peptide sequence is generated at least once among 1024 draws as a function of the Levenshtein distances of the initial peptide sequences. The data in (b) and (c) are represented as boxplots in which the middle line indicates the median, the bounds of the box indicate the first and third quartiles and the whiskers indicate ±1.5 × interquartile range from the third and first quartile. Outlying data points are shown as dots. Source data are provided as a Source Data file.
Fig. 4
Fig. 4. Levenshtein distance estimator performance.
a Estimated against actual Levenshtein distances of incorrect peptide identifications by Novor and Casanovo to the correct peptide sequence by MaxQuant across all 30 human samples. b Estimated Levenshtein distances of incorrect peptides against the estimated Levenshtein distances of the corresponding correct peptide sequences for a given spectrum across all 30 samples. The percentage of points above or on the diagonal line and below the diagonal line is labeled. c Precision-recall curves at peptide level before and after rescoring peptide identifications by Novor and Casanovo on the heart sample with Spectralis-score, our Levenshtein distance estimator, including the precision and recall for peptides from Casanovo with Novor substitutes for peptides with wrong mass (Casanovo-Novor). d Recall at 90% precision before and after rescoring peptides from Novor, Casanovo, as well as the combination of Casanovo and Novor sequences (Casanovo-Novor) across all n = 30 samples (different tissues). Statistical significance from a two-sided paired Wilcoxon test. The data in (a) and (d) are represented as boxplots in which the middle line indicates the median, the bounds of the box indicate the first and third quartiles and the whiskers indicate ±1.5 × IQR (interquartile range) from the third and first quartile, respectively. Source data are provided as a Source Data file.
Fig. 5
Fig. 5. Spectralis-EA performance.
a Example of a successful optimization of the initially incorrect peptide sequence ETGRTKIEETDCYR predicted by Novor after 5 generations of the evolutionary algorithm. For each generation, the estimated Levenshtein distances are provided for the best peptide (i.e., most highly scored peptide), and the lineage peptide (i.e. the candidate peptide leading to the correct peptide sequence). b Levenshtein distances of input peptide sequences against Levenshtein distances of peptide sequences returned by Spectralis-EA. c Precision-recall curves of identifications at peptide level for Novor, Casanovo, and Spectralis-EA, as well as Spectralis-score on the combination of Casanovo and Novor sequences (Casanovo-Novor) on the test set of the heart sample. d Recall at 90% precision for Novor, Casanovo, Spectralis-score on the combination of Casanovo and Novor (Casanovo-Novor) and Spectralis-EA on the test sets of all 30 samples. e Overall recall for Novor, Casanovo, Spectralis-score on Casanovo-Novor, and Spectralis-EA on the test sets of all n = 30 samples (different tissues). Statistical significance for (d) and (e) from a two-sided paired Wilcoxon test. The data in (b), (d) and (e) are represented as boxplots in which the middle line indicates the median, the bounds of the box indicate the first and third quartiles and the whiskers indicate ±1.5 × IQR (interquartile range) from the third and first quartile, respectively. Source data are provided as a Source Data file.
Fig. 6
Fig. 6. Application to unidentified spectra and variant calling.
a Percentage of perfect alignments with mass consistent with the precursor m/z queried on peptide sequences by Novor, Casanovo, Spectralis-score on Casanovo-Novor and Spectralis-EA against a set of known and predicted gene translations using blastp on spectra not identified by MaxQuant of the heart sample, showing only the top 150,000 ranked candidate peptides of each method (out of 1,167,029). For clarity, the first 100 peptides are omitted. b Number of PSMs with perfect alignments, alignments with one mismatch, alignments with multiple mismatches, with mass not consistent with the precursor m/z, and without significant alignments for Novor, Casanovo, Spectralis-score on Casanovo-Novor and Spectralis-EA at different precision estimates on the set of spectra of the heart sample unidentified by MaxQuant. c Left: Prosit-predicted spectrum (top) and experimental spectrum (bottom) for the reference peptide sequence ISAPNVDFNLEGPK. The cartoon illustrates the relevant nucleotide sequence and fragment ion series assuming the reference genome allele. Right: Same as for left, but for the peptide sequence ISASNVDFNIEGPK predicted by Spectralis-EA for the same experimental spectrum. Cartoon as in left inset for the alternative allele detected on RNA-seq of the same sample. A proline instead of serine is present at the fourth position. Parts of the spectra differing in left and right are shown in boxes. Source data are provided as a Source Data file.

Similar articles

Cited by

References

    1. Aebersold R, Mann M. Mass-spectrometric exploration of proteome structure and function. Nature. 2016;537:347–355. doi: 10.1038/nature19949. - DOI - PubMed
    1. Zhang Y, Fonslow BR, Shan B, Baek M-C, Yates JR. Protein analysis by shotgun/bottom-up proteomics. Chem. Rev. 2013;113:2343–2394. doi: 10.1021/cr3003533. - DOI - PMC - PubMed
    1. Dančík V, Addona TA, Clauser KR, Vath JE, Pevzner PA. De novo peptide sequencing via tandem mass spectrometry. J. Comput. Biol. 1999;6:327–342. doi: 10.1089/106652799318300. - DOI - PubMed
    1. Taylor JA, Johnson RS. Sequence database searches via de novo peptide sequencing by tandem mass spectrometry. Rapid Commun. Mass Spectrom. 1997;11:1067–1075. doi: 10.1002/(SICI)1097-0231(19970615)11:9<1067::AID-RCM953>3.0.CO;2-L. - DOI - PubMed
    1. Muth T, Renard BY. Evaluating de novo sequencing in proteomics: already an accurate alternative to database-driven peptide identification? Brief. Bioinform. 2018;19:954–970. doi: 10.1093/bib/bbx033. - DOI - PubMed

Publication types