. 2024 Jan 2;22(1):6.
doi: 10.1186/s12967-023-04721-3.

TC2N inhibits distant metastasis and stemness of breast cancer via blocking fatty acid synthesis

Affiliations

TC2N inhibits distant metastasis and stemness of breast cancer via blocking fatty acid synthesis

Xiang-Lin Hao et al. J Transl Med. .

Abstract

Background: Tandem C2 domains, nuclear (TC2N) is a C2 domain-containing protein that belongs to the carboxyl-terminal type (C-type) tandem C2 protein family, and acts as an oncogenic driver in several cancers. Previously, we preliminarily reported that TC2N mediates the PI3K-Akt signaling pathway to inhibit tumor growth of breast cancer (BC) cells. Beyond that, its precise biological functions and detailed molecular mechanisms in BC development and progression are not fully understood.

Methods: Tumor tissues of 212 BC patients were subjected to tissue microarray and further assessed the associations of TC2N expression with pathological parameters and FASN expression. The protein levels of TC2N and FASN in cell lines and tumor specimens were monitored by qRT-PCR, WB, immunofluorescence and immunohistochemistry. In vitro cell assays, in vivo nude mice model was used to assess the effect of TC2N ectopic expression on tumor metastasis and stemness of breast cancer cells. The downstream signaling pathway or target molecule of TC2N was mined using a combination of transcriptomics, proteomics and lipidomics, and the underlying mechanism was explored by WB and co-IP assays.

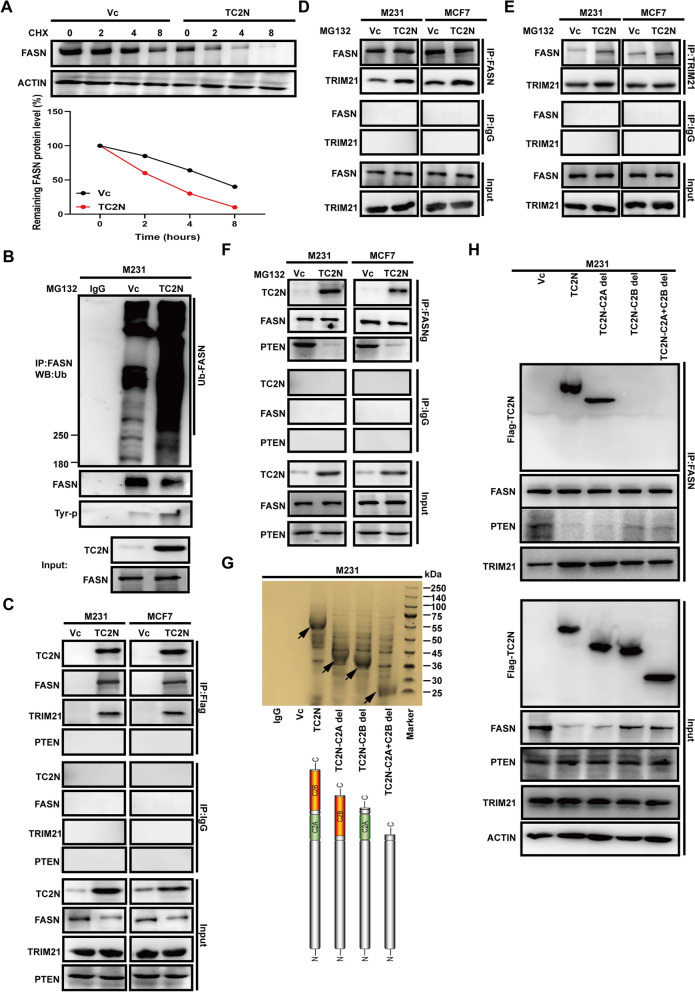
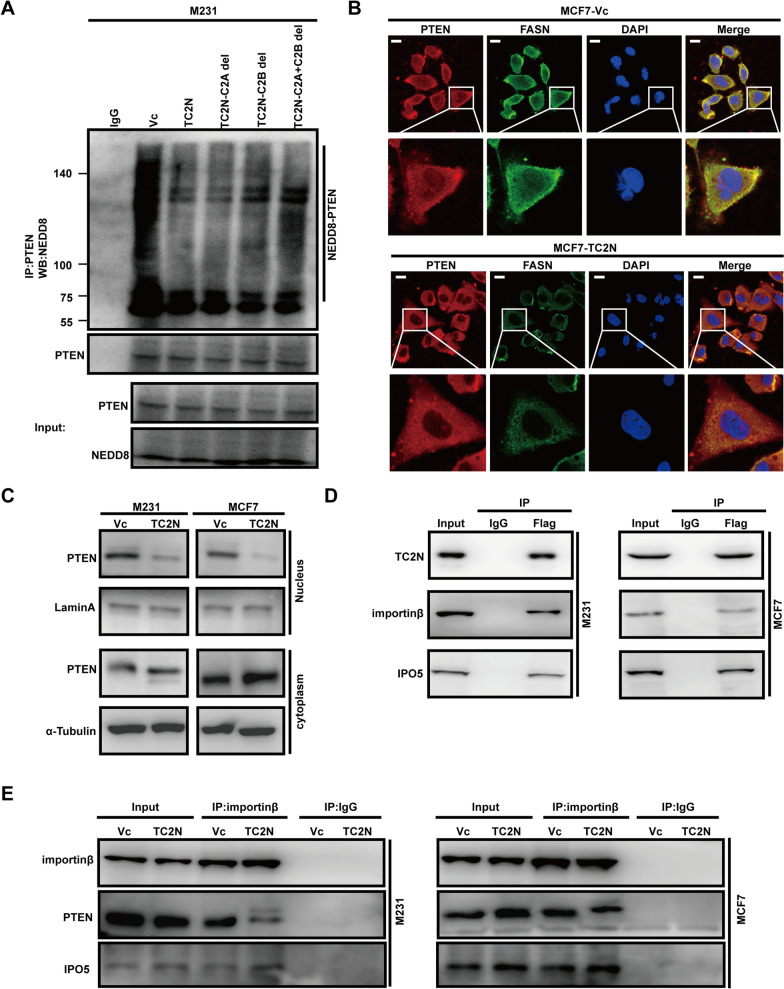
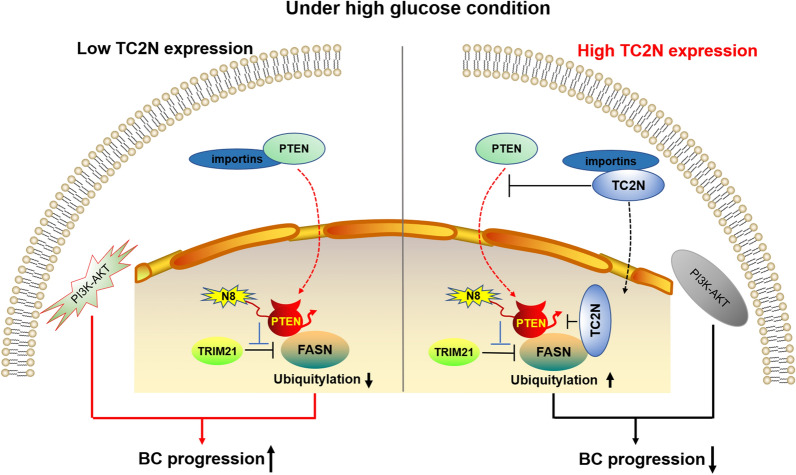
Results: Here, we found that the expression of TC2N remarkedly silenced in metastatic and poorly differentiated tumors. Function-wide, TC2N strongly inhibits tumor metastasis and stem-like properties of BC via inhibition of fatty acid synthesis. Mechanism-wise, TC2N blocks neddylated PTEN-mediated FASN stabilization by a dual mechanism. The C2B domain is crucial for nuclear localization of TC2N, further consolidating the TRIM21-mediated ubiquitylation and degradation of FASN by competing with neddylated PTEN for binding to FASN in nucleus. On the other hand, cytoplasmic TC2N interacts with import proteins, thereby restraining nuclear import of PTEN to decrease neddylated PTEN level.

Conclusions: Altogether, we demonstrate a previously unidentified role and mechanism of TC2N in regulation of lipid metabolism and PTEN neddylation, providing a potential therapeutic target for anti-cancer.

Keywords: Breast cancer; Cancer stem cell; Fatty synthesis; Metastasis; PTEN neddylation; TC2N.


Conflict of interest statement

The authors declare that they have no competing interests.

Figures

Fig. 1
Fig. 1
TC2N expression is related to tumor metastasis and differentiation status of BC patients. A The protein expression of TC2N was detected by IHC staining in BC tissues. High TC2N expression group contains the ≥ 3 score patients. Low TC2N expression group contains the < 3 score patients. Scale bars represent 20 μm. B TC2N expression was significantly decreased in advanced-stage BC patients than that in early-stage BC patients. The P value was measured with Student’s t-tests. *P < 0.05; **P < 0.01; ***P < 0.001. C TC2N expression was obviously decreased in BC patients with lymph node metastasis (N1–3) than that without lymph node metastasis (N0). The P value was measured with Student’s t-tests. ***P < 0.001. D TC2N expression was significantly decreased in BC patients with distant-metastasis (M1) than that without metastasis (M0). The P value was measured with Student’s t-tests. ***P < 0.001. Scale bars represent 20 μm. E The expression of TC2N in different metastatic sites. The P value was measured with Student’s t-tests. ns, no significance. F TC2N expression in BC tissues at different differentiating degree. The P value was measured with Student’s t-tests. ns, no significance, *P < 0.05. G TCGA BC database identified the association between TC2N expression and metastasis and differentiation-related processes. H CPTAC BC protein dataset identified the association between TC2N expression and metastasis and differentiation-related processes. I Kaplan–Meier analysis of the correlation between TC2N expression and overall survival time in 212 BC patients. J Cox-regression analysis of the correlation between TC2N expression and overall survival time in 212 BC patients
Fig. 2
Fig. 2
TC2N inhibits metastatic phenotype of BC cells in vitro and in vivo. A Overexpression of TC2N in M231, MCF7 and SKBR3 cells were examined by WB. B Effects of TC2N overexpression on migration and invasion of M231, MCF7 and SKBR3 cells were detected by transwell assays. Mean ± SEM (n = 3). The P value was measured with Student’s t-tests. **P < 0.01, ***P < 0.001. C Silencing of TC2N in M231-TC2N, MCF7-TC2N and SKBR3-TC2N stable transfectants were examined by WB. D Effects of TC2N knockdown on migration and invasion of M231-TC2N, MCF7-TC2N and SKBR3-TC2N cells were detected by transwell assays. Mean ± SEM (n = 3). The P value was measured with Student’s t-tests. *P < 0.05, **P < 0.01, ***P < 0.001. E Bioluminescent images of brain and heart tissues from female nude mice 50 days post intracardiac injection of SKBR3 cell line with TC2N ectopic expression. F Tissues were exfoliated from mice (n = 4) that injected with stable transfected SKBR3 cells. Organs invaded by BC cells were evaluated by H&E staining (Left). Scale bar represent 100 μm. The number of metastatic nodules in each organ were showed (Right). The P value was measured with Student’s t-tests. *P < 0.05
Fig. 3
Fig. 3
TC2N interferes with the CSC-like characteristics of BC cells. A WB analysis of NANOG and SOX2 in stable M231, MCF7 and SKBR3 cells. B Sphere formation ability of BC cells with ectopic expression of TC2N. Mean ± SEM (n = 3). The P value was measured with Student’s t-tests. **P < 0.01. C Fractions of CD44+CD24 BC cell-spheres with TC2N ectopic expression were determined by flow cytometry. Mean ± SEM (n = 3). The P value was measured with Student’s t-tests. ***P < 0.001. D Fractions of ADLH+ BC cells with TC2N ectopic expression were determined by flow cytometry. Mean ± SEM (n = 3). The P value was measured with Student’s t-tests. **P < 0.01, ***P < 0.001. E The tumor growth curves of M231 spheres (n = 5). *P < 0.05. F The image of nude mice subcutaneously injected with M231 spheres. G Tumor weight from the Vc and TC2N group. **P < 0.01. H IHC evaluation of CD133 in xenograft tumor. Scale bar represent 100 μm
Fig. 4
Fig. 4
TC2N decreases the fatty acid content in BC. A CPTAC BC protein dataset identified the association between TC2N expression and lipid metabolism. B Effects of TC2N overexpression on total free fatty acids levels of M231, MCF7 and SKBR3 cells. The P value was measured with Student’s t-tests. **P < 0.01, ***P < 0.001. C Lipid metabolism was detected by LC–MS/MS in stable transfected M231 cells. Heatmap was performed and the significant differences were analyzed using Student’s t-test, n = 4. D The growth of E0771 cells stably expressing control lentivirus or TC2N overexpression lentivirus in nude mice. Block arrows indicate the tumor masses. E The fatty deposit of E0771 tumor masses were detected by oil red O staining. Scale bar represent 100 μm. F Immunofluorescence analysis of the localization of TC2N and FASN in MCF7-TC2N cells. DAPI serves as a nuclear counterstain. Scale bars represent 25 μm. G Immunofluorescence revealed that TC2N decreases the protein levels of FASN in MCF7 cells. Scale bars represent 25 μm. H qRT-PCR revealed that TC2N do not change the mRNA expression of FASN in M231 and MCF7 cells. The P value was measured with Student’s t-tests. ns, no significance. I WB revealed that TC2N decreases the protein expression of FASN in M231 and MCF7 cells
Fig. 5
Fig. 5
TC2N promotes the degradation of FASN via blocking the interaction between PTEN and FASN. A The extracts from M231 cells with control lentivirus or TC2N overexpression lentivirus treated with 20 µM cycloheximide (CHX) for the indicated times were subjected to WB (Upper). Relative FASN protein levels were quantified by ImageJ software (Lower). B M231 cells with control lentivirus or TC2N overexpression lentivirus were transfected with 2 µg of ubiquitin-expressing plasmids. At 24 h after the transfection, cells were treated with 20 µM MG132 for 24 h. Cell extracts were subjected to IP with anti-FASN antibody and further analyzed by WB with anti-Ubiquitin and anti- Tyrosine antibody. Normal IgG was used as a negative control. Whole-cell lysates were used as a positive control (Input). C The extracts from BC cells were subjected to IP with anti-Flag antibody and further analyzed by WB with TC2N, FASN, TRIM21 and PTEN antibodies. Normal IgG was used as a negative control. Whole-cell lysates were used as a positive control (Input). D and E BC cells were treated with 20 µM MG132 for 24 h, and then cell extracts were subjected to IP with anti-FASN or anti-TRIM21 antibodies and further analyzed by WB with indicated antibodies. Normal IgG was used as a negative control. Whole-cell lysates were used as a positive control (Input). F The cell extracts from BC cells were subjected to IP with anti-FASN antibody and further analyzed by WB with indicated antibodies. Normal IgG was used as a negative control. Whole-cell lysates were used as a positive control (Input). G The extracts from M231 cells stably expressing FLAG-Vc or FLAG-TC2N (full-length and truncation) were subjected to IP with anti-Flag antibody. Elutes were resolved using SDS-PAGE and silver-stained. Block arrows indicate the bands of TC2N. H The extracts from M231 cells stably expressing FLAG-Vc or FLAG-TC2N (full-length and truncation) were subjected to IP with anti-FASN antibody and further analyzed by WB with indicated antibodies. Normal IgG was used as a negative control. Whole-cell lysates were used as a positive control (Input)
Fig. 6
Fig. 6
TC2N decreases the levels of PTEN neddylation by preventing the nuclear import of PTEN. A M231 cell extracts were subjected to IP with anti-PTEN antibody and further analyzed by WB with anti-NEDD8 antibody. Normal IgG was used as a negative control. Whole-cell lysates were used as a positive control (Input). B Immunofluorescence revealed that TC2N decreases the nuclear localization of PTEN in MCF7 cells. Scale bars represent 25 μm. C PTEN protein level in nucleus and cytoplasm were analyzed by WB. D The extracts from BC cells were subjected to IP with anti-Flag antibody and further analyzed by WB with anti-importinβ and anti-IPO5 antibodies. Normal IgG was used as a negative control. Whole-cell lysates were used as a positive control (Input). E The cell extracts from BC cells were subjected to IP with importinβ antibody and further analyzed by WB with indicated antibodies. Normal IgG was used as a negative control. Whole-cell lysates were used as a positive control (Input)
Fig. 7
Fig. 7
TC2N represses FASN-driven tumor progression and its high expression in BC indicate low fatty deposition and good prognosis. A WB analysis of TC2N and FASN expression in stable M231, MCF7 and SKBR3 cells with 0.2 μM TVB-3166 treatment (Upper). Transwell assays were used to examine the effect of FASN ablation on cell migration and invasion of BC stable cells (Under). The P value was measured with Student’s t-tests. *P < 0.05, **P < 0.01, ***P < 0.001. B CD133+ analysis was used to examine the effect of FASN ablation on stemness of BC stable cell spheres. Mean ± SEM (n = 3). The P value was measured with Student’s t-tests. ***P < 0.001. C ALDH+ analysis was used to examine the effect of FASN ablation on stemness of BC stable cells. Mean ± SEM (n = 3). The P value was measured with Student’s t-tests. *P < 0.05, **P < 0.01, ***P < 0.001. D The fatty deposits were detected by oil red O staining in tumor tissues of BC patients. Scale bar represent 100 μm. E and F Survivorship curves showed that the overall survival rates of BC patients with high or low levels of FASN and of those with low expression of TC2N and high expression of FASN or high expression of TC2N and low expression of FASN. The high or low levels of TC2N and FASN were defined by their median levels in the BC
Fig. 8
Fig. 8
A schematic diagram reveals the regulatory mechanism by which TC2N induces FASN degradation

Similar articles

Cited by

References

    1. Sung H, Ferlay J, Siegel RL, Laversanne M, Soerjomataram I, Jemal A, Bray F. Global Cancer Statistics 2020: GLOBOCAN estimates of incidence and mortality worldwide for 36 cancers in 185 countries. CA Cancer J Clin. 2021;71:209–249. doi: 10.3322/caac.21660. - DOI - PubMed
    1. Chhichholiya Y, Suman P, Singh S, Munshi A. The genomic architecture of metastasis in breast cancer: focus on mechanistic aspects, signalling pathways and therapeutic strategies. Med Oncol. 2021;38:95. doi: 10.1007/s12032-021-01547-1. - DOI - PubMed
    1. Chen X, Zheng Z, Chen L, Zheng H. MAPK, NFκB, and VEGF signaling pathways regulate breast cancer liver metastasis. Oncotarget. 2017;8:101452. doi: 10.18632/oncotarget.20843. - DOI - PMC - PubMed
    1. Wahl GM, Spike BT. Cell state plasticity, stem cells, EMT, and the generation of intra-tumoral heterogeneity. NPJ Breast Cancer. 2017;3:14. doi: 10.1038/s41523-017-0012-z. - DOI - PMC - PubMed
    1. Sousa B, Ribeiro AS, Paredes J. Heterogeneity and plasticity of breast cancer stem cells. Adv Exp Med Biol. 2019;1139:83–103. doi: 10.1007/978-3-030-14366-4_5. - DOI - PubMed

Publication types