. 2024 Jan 2;12(1):1.
doi: 10.1186/s40170-023-00329-9.

Assessment of lipolysis biomarkers in adipose tissue of patients with gastrointestinal cancer

Affiliations

Assessment of lipolysis biomarkers in adipose tissue of patients with gastrointestinal cancer

Federica Tambaro et al. Cancer Metab. .

Abstract

Background: Adipose tissue metabolism may be impaired in patients with cancer. In particular, increased lipolysis was described in cancer-promoting adipose tissue atrophy. For this reason, we assessed the expression of the lipolysis-associated genes and proteins in subcutaneous adipose tissue (SAT) of gastrointestinal (GI) cancer patients compared to controls to verify their involvement in cancer, among different types of GI cancers, and in cachexia.

Methods: We considered patients with GI cancer (gastric, pancreatic, and colorectal) at their first diagnosis, with/without cachexia, and controls with benign diseases. We collected SAT and total RNA was extracted and ATGL, HSL, PPARα, and MCP1 were analyzed by qRT-PCR. Western blot was performed to evaluate CGI-58, PLIN1 and PLIN5.

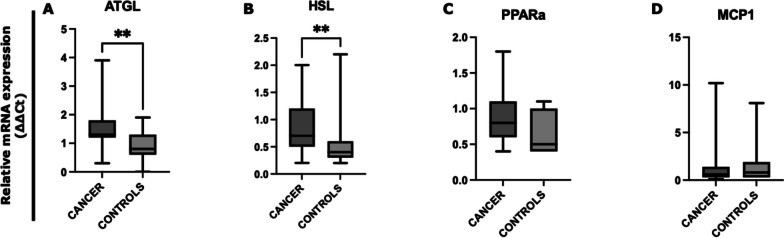
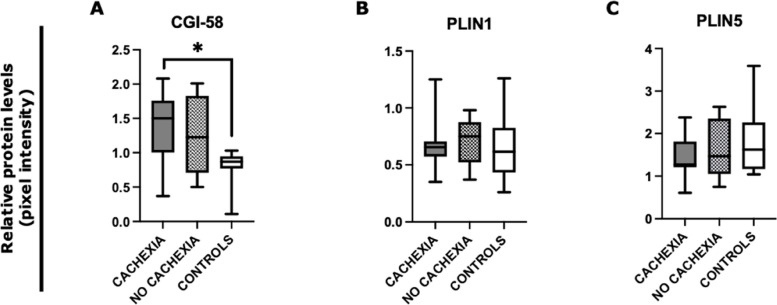
Results: We found higher expression of ATGL and HSL in GI cancer patients with respect to controls (p ≤ 0.008) and a trend of increase for PPARα (p = 0.055). We found an upregulation of ATGL in GI cancer patients with cachexia (p = 0.033) and without cachexia (p = 0.017) vs controls. HSL was higher in patients with cachexia (p = 0.020) and without cachexia (p = 0.021), compared to controls. ATGL was upregulated in gastric cancer vs controls (p = 0.014) and higher HSL was found in gastric (p = 0.008) and in pancreatic cancer (p = 0.033) vs controls. At the protein level, we found higher CGI-58 in cancer vs controls (p = 0.019) and in cachectic vs controls (p = 0.029), as well as in gastric cancer vs controls (p = 0.027).

Conclusion: In our cohort of GI cancer patients, we found a modulation in the expression of genes and proteins involved in lipolysis, and differences were interestingly detected according to cancer type.

Keywords: Cachexia; Cancer; Gene expression, Proteins; Lipolysis.


Conflict of interest statement

The authors declare no competing interests.

Figures

Fig. 1
Fig. 1
Analysis of SAT lipolysis-associated genes in gastrointestinal cancer patients and in controls. The mRNA levels of ATGL, HSL, PPARa, and MCP1 were analyzed by quantitative real-time PCR from SAT of gastrointestinal cancer patients (N = 23) and controls (N = 15). Data were normalized against the housekeeping Actin-β gene from two biological replicates and a calibrator was used as internal control. A, B Data show higher expression of ATGL (p = 0.008) and HSL (p = 0.006) in gastrointestinal cancer patients with respect to controls. C PPARa mRNA levels show a trend of increased expression in cancer patients compared to controls (p = 0.055). D No significant difference was observed in MCP1 mRNA levels. **p < 0.01. Abbreviations: adipose triglyceride lipase, ATGL; hormone-sensitive lipase, HSL; peroxisome proliferator-activated receptor alpha, PPAR-a; monocyte chemoattractant protein-1, MCP1
Fig. 2
Fig. 2
Analysis of SAT lipolysis-associated proteins by Western blot in gastrointestinal cancer patients and in controls. Protein densitometry quantification for CGI58, PLIN1, and PLIN5 in SAT from gastrointestinal cancer patients (N = 18) and control group (N = 8). Actin-β was used as a loading control. A Patients with gastrointestinal cancers showed a higher CGI58 expression level compared to controls (p = 0.019). B, C No significant difference was observed in PLIN1 and PLIN5 protein levels. *p < 0.05. Abbreviations: Comparative Gene Identification-58, CGI-58; perilipin, PLIN
Fig. 3
Fig. 3
Analysis of SAT lipolysis-associated genes in gastrointestinal cancer patients with cachexia, without cachexia, and in controls. The mRNA levels of ATGL, HSL, PPARa, and MCP1 were analyzed by quantitative real-time PCR from gastrointestinal cancer patients with cachexia (N = 9), without cachexia (N = 14), and control group (N = 15). Data were normalized against the housekeeping Actin-β gene from two biological replicates and a calibrator was used as internal control. A Data show higher expression of ATGL in cachectic patients vs controls (p = 0.033) and in non-cachectic patients vs controls (p = 0.017). B HSL expression levels were higher in the cachectic group (p = 0.020) compared to controls and in the non-cachectic group (p = 0.021) with respect to controls. C, D No difference was detected in PPARa and MCP1 expression levels. *p < 0.05. Abbreviations: adipose triglyceride lipase, ATGL; hormone-sensitive lipase, HSL; peroxisome proliferator-activated receptor alpha, PPAR-a; monocyte chemoattractant protein-1, MCP1
Fig. 4
Fig. 4
Analysis of SAT lipolysis-associated proteins by Western blot in gastrointestinal cancer patients with and without cachexia and in controls. Protein densitometry quantification for CGI58, PLIN1, and PLIN5 in SAT of cancer patients with cachexia (N = 7), without cachexia (N = 10) and controls (N = 8). Actin-β was used as the loading control. A Patients with cachexia showed higher CGI58 levels compared to controls (p = 0.029). B, C No significant difference was observed in PLIN1 and PLIN5 protein levels. *p < 0.05. Abbreviations: Comparative Gene Identification-58, CGI-58; perilipin, PLIN
Fig. 5
Fig. 5
Analysis of SAT lipolysis-associated genes according to the type of gastrointestinal cancer and in controls. The mRNA levels of ATGL, HSL, PPARa, and MCP1 were analyzed by quantitative real-time PCR from cancer patients with colorectal (N = 8), gastric (N = 7), and pancreatic cancer (N = 8) and in the control group (N = 15). Data were normalized against the housekeeping Actin-β gene from two biological replicates and a calibrator was used as internal control. A Data show higher expression of ATGL in gastric cancer vs controls (p = 0.014). No differences were observed by comparing the other subgroups of patients. B HSL expression levels were higher in gastric cancer patients (p = 0.008) compared to controls and in pancreatic cancer patients (p = 0.033) with respect to controls. C, D No significant differences were observed in PPARa and MCP1 expression levels. *p < 0.05, **p < 0.01. Abbreviations: adipose triglyceride lipase, ATGL; hormone-sensitive lipase, HSL; peroxisome proliferator-activated receptor alpha, PPAR-a; monocyte chemoattractant protein-1, MCP1
Fig. 6
Fig. 6
Analysis of SAT lipolysis-associated proteins by Western blot according to the type of gastrointestinal cancer and in controls. Protein densitometry quantification for CGI58, PLIN1, and PLIN5 with colorectal (N = 6), gastric (N = 5), pancreatic (N = 7) cancer, and controls (N = 8). Actin-β was used as loading control. A Patients with gastric cancer showed higher CGI58 protein levels compared to controls (p = 0.027). B, C No significant difference was observed in PLIN1 and PLIN5 protein levels. D Representative images of the SAT proteins from patients with gastric, pancreatic, colorectal cancer, and controls. *p < 0.05. Abbreviations: Comparative Gene Identification-58, CGI-58; perilipin, PLIN

Similar articles

Cited by

References

    1. Al-Sawaf O, Weiss J, Skrzypski M, Lam JM, Karasaki T, Zambrana F, et al. Body composition and lung cancer-associated cachexia in TRACERx. Nat Med. 2023;29:846–858. doi: 10.1038/s41591-023-02232-8. - DOI - PMC - PubMed
    1. Argilés JM, López-Soriano FJ, Stemmler B, Busquets S. Cancer-associated cachexia - understanding the tumour macroenvironment and microenvironment to improve management. Nat Rev Clin Oncol. 2023;20:250–264. doi: 10.1038/s41571-023-00734-5. - DOI - PubMed
    1. Martin L, Birdsell L, Macdonald N, Reiman T, Clandinin MT, McCargar LJ, et al. Cancer cachexia in the age of obesity: skeletal muscle depletion is a powerful prognostic factor, independent of body mass index. J Clin Oncol. 2013;31:1539–1547. doi: 10.1200/JCO.2012.45.2722. - DOI - PubMed
    1. Molfino A, Imbimbo G, Muscaritoli M. Metabolic and histomorphological changes of adipose tissue in cachexia. Curr Opin Clin Nutr Metab Care. 2023;26:235–242. doi: 10.1097/MCO.0000000000000923. - DOI - PubMed
    1. Baracos VE, Martin L, Korc M, Guttridge DC, Fearon KCH. Cancer-associated cachexia. Nat Rev Dis Primers. 2018;4:17105. doi: 10.1038/nrdp.2017.105. - DOI - PubMed