. 2024 Jan 2;14(1):198.
doi: 10.1038/s41598-023-50640-0.

Distinct patterns of proteostasis network gene expression are associated with different prognoses in melanoma patients

Affiliations

Distinct patterns of proteostasis network gene expression are associated with different prognoses in melanoma patients

Rachel Wellman et al. Sci Rep. .

Abstract

The proteostasis network (PN) is a collection of protein folding and degradation pathways that spans cellular compartments and acts to preserve the integrity of the proteome. The differential expression of PN genes is a hallmark of many cancers, and the inhibition of protein quality control factors is an effective way to slow cancer cell growth. However, little is known about how the expression of PN genes differs between patients and how this impacts survival outcomes. To address this, we applied unbiased hierarchical clustering to gene expression data obtained from primary and metastatic cutaneous melanoma (CM) samples and found that two distinct groups of individuals emerge across each sample type. These patient groups are distinguished by the differential expression of genes encoding ATP-dependent and ATP-independent chaperones, and proteasomal subunits. Differences in PN gene expression were associated with increased levels of the transcription factors, MEF2A, SP4, ZFX, CREB1 and ATF2, as well as markedly different survival outcomes. However, surprisingly, similar PN alterations in primary and metastatic samples were associated with discordant survival outcomes in patients. Our findings reveal that the expression of PN genes demarcates CM patients and highlights several new proteostasis sub-networks that could be targeted for more effective suppression of CM within specific individuals.


Conflict of interest statement

The authors declare no competing interests.

Figures

Figure 1
Figure 1
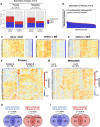
Two distinct patterns of PN gene expression are observed across primary and metastatic CM samples. (a, b) Proteostasis network gene expression (corrected for tumour purity) in (a) primary and (b) metastatic cutaneous melanoma (CM) samples clustered using Ward’s hierarchical agglomerative clustering method. (c) Principal component analysis of PN gene expression in normal, primary and metastatic samples. (d) Volcano plot of differences in PN gene expression between TCGA primary and metastatic samples. (e) Venn diagram showing numbers of PN genes that have lower or higher expression in sample group A than in sample group B in primary and metastatic CM samples.
Figure 2
Figure 2
The proportion of PN genes exhibiting differential expression across CM samples is greater than that observed across the rest of the genome. (a) Proportion of Proteostasis Network (PN) genes or non-PN genes showing significantly different expression between cutaneous melanoma (CM) primary and metastatic groups A and B (p-value < 0.05 calculated by Student’s T-test and DEseq2, adjusted p-value < 0.1 calculated by Benjamini Hochberg correction). (b) Proportion of random gene sets that exhibit differential expression between primary groups A and B (p-value < 0.05 calculated by Student’s T-test and DEseq2, adjusted p-value < 0.1 calculated by Benjamini Hochberg correction). (c, d) Expression of PN genes clustered using Ward’s hierarchical agglomerative clustering method in (c) primary cutaneous melanoma (CM), (d) uveal melanoma (UVM) and (e) uterine corpus endometrial carcinoma (UCEC). (f, g) Expression of PN genes in (f) primary (Budden) and (g) metastatic (Liu) validation cohorts clustered using Ward’s hierarchical agglomerative clustering method. (h, i) Numbers of genes exhibiting higher or lower expression in group A than group B in (h) primary TCGA and Budden samples and (i) metastatic TCGA and Liu samples. P-values were calculated as the probability of achieving the same (or greater) degree of overlap in 5000 simulations of two randomly selected lists of PN genes of equal sizes to those being compared between our TCGA/Budden and TCGA/Liu cohorts.
Figure 3
Figure 3
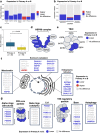
Specific components of the sHSP, HSP90, HSP60, HSP70/DNAJ and proteasome systems are differentially expressed across primary CM samples. (a) Proportion of genes within each Proteostasis Network (PN) sub-group showing significantly altered expression between primary groups A and B (p-value < 0.05 calculated by Student’s T-test and DEseq2, adjusted p-value < 0.1 calculated by Benjamini Hochberg correction). (b) Proportion of PN genes within each sub-cellular compartment showing significantly altered expression between primary groups A and B (p-value < 0.05 calculated by Student’s T-test and DEseq2, adjusted p-value < 0.1 calculated by Benjamini Hochberg correction). (c) Mean expression of sHSP genes in primary sample groups. P-values were calculated using Student’s t-test. Boxes indicate the interquartile range (IQR), the upper whisker extends to the largest value that is less than (third quartile + (1.5 * IQR)). The lower whisker extends to the smallest value that is greater than (first quartile − (1.5 * IQR)). (dg) Cartoons highlighting the PN components that exhibit differential expression between Primary A and B among (d) HSP90 and co-chaperones, (e) CCT/TRIC subunits (f) core chaperones and co-chaperones of sub-cellular compartments and (g) proteasome core and regulatory particle subunits and autophagy components.
Figure 4
Figure 4
The differential expression of PN genes across primary and metastatic CM samples is associated with altered survival outcomes in patients. (a) Disease-specific survival curves and hazard tables for cutaneous melanoma (CM) patients in primary groups A and B of the TCGA cohort (3 years following diagnosis). (b) Overall survival curves and hazard tables for patients in Budden validation cohort (6 years following diagnosis). (c) Disease-specific survival curves and hazard tables for patients in metastatic groups A and B of the TCGA cohort. (d) Overall survival curves and hazard tables for patients in Liu validation cohort. P-values were calculated using log rank test in all panels.
Figure 5
Figure 5
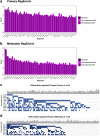
Distinct transcriptional regulators are associated with the differential expression of PN genes across CM samples: (a, b) RegEnrich scores of regulators identified from Proteostasis network (PN) gene expression changes in (a) primary and (b) metastatic TCGA cutaneous melanoma (CM) cohorts. (c, d) Matrices depicting transcription factors shown to directly bind differentially expressed PN genes by ChIP-seq, and highlighted as potential regulators by both RegEnrich and Enrichr in either (c) primary or (d) metastatic CM cohorts.
Figure 6
Figure 6
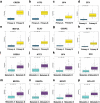
Differential expression of transcriptional regulators is associated with altered PN gene expression across CM samples. (ah) Box plots showing the relative expression of transcription factors highlighted by RegEnrich and Enrichr as potential regulators of PN gene expression across primary groups A (n = 25) and B (n = 78). (ip) Box plots showing the relative expression of transcription factors highlighted by RegEnrich and Enrichr as potential regulators of PN gene expression across metastatic groups A (n = 73) and B (n = 283). P-values were calculated using Student’s t-test. Boxes indicate the interquartile range (IQR), the upper whisker extends to the largest value that is less than (third quartile + (1.5 * IQR)). The lower whisker extends to the smallest value that is greater than (first quartile − (1.5 * IQR)).

Similar articles

References

    1. Demirsoy S, Martin S, Maes H, Agostinis P. Adapt, recycle, and move on: Proteostasis and trafficking mechanisms in melanoma. Front. Oncol. 2016;6:240. doi: 10.3389/fonc.2016.00240. - DOI - PMC - PubMed
    1. Arnold M, de Vries E, Whiteman DC, Jemal A, Bray F, Parkin DM, et al. Global burden of cutaneous melanoma attributable to ultraviolet radiation in 2012. Int. J. Cancer. 2018;143(6):1305–1314. doi: 10.1002/ijc.31527. - DOI - PubMed
    1. Arnold M, Singh D, Laversanne M, Vignat J, Vaccarella S, Meheus F, et al. Global burden of cutaneous melanoma in 2020 and projections to 2040. JAMA Dermatol. 2022;158(5):495–503. doi: 10.1001/jamadermatol.2022.0160. - DOI - PMC - PubMed
    1. Ernst M, Giubellino A. The current state of treatment and future directions in cutaneous malignant melanoma. Biomedicines. 2022;10(4):1–30. doi: 10.3390/biomedicines10040822. - DOI - PMC - PubMed
    1. Labbadia J, Morimoto RI. the biology of proteostasis in aging and disease. Annu. Rev. Biochem. 2015;84(1):435–464. doi: 10.1146/annurev-biochem-060614-033955. - DOI - PMC - PubMed

Substances