. 2024 Jan 2;15(1):166.
doi: 10.1038/s41467-023-44321-9.

More than 17,000 tree species are at risk from rapid global change

Affiliations

More than 17,000 tree species are at risk from rapid global change

Coline C F Boonman et al. Nat Commun. .

Abstract

Trees are pivotal to global biodiversity and nature's contributions to people, yet accelerating global changes threaten global tree diversity, making accurate species extinction risk assessments necessary. To identify species that require expert-based re-evaluation, we assess exposure to change in six anthropogenic threats over the last two decades for 32,090 tree species. We estimated that over half (54.2%) of the assessed species have been exposed to increasing threats. Only 8.7% of these species are considered threatened by the IUCN Red List, whereas they include more than half of the Data Deficient species (57.8%). These findings suggest a substantial underestimation of threats and associated extinction risk for tree species in current assessments. We also map hotspots of tree species exposed to rapidly changing threats around the world. Our data-driven approach can strengthen the efforts going into expert-based IUCN Red List assessments by facilitating prioritization among species for re-evaluation, allowing for more efficient conservation efforts.


Conflict of interest statement

The authors declare no competing interests.

Figures

Fig. 1
Fig. 1. Rates of recent change for all proxies of identified threats to trees.
Human land use changes include cropland expansion (exp), tree cover decline (decl), built-up area expansion (exp), and deforestation. Climate change includes minimum and maximum temperature (Temp), vapor pressure deficit (VPD) and its seasonality (Seas), and precipitation and its seasonality (Seas). While the bars highlight the total number of species on a log10 scale, the colored lines show the kernel density estimates per conservation status group. Rates of recent change are expressed in percentages of the species’ extent per year, and for the climate variables the change is indicated by °C, Pa or mm change per year. Since this study on recent change rates has been done with data ranging from ~2000 and ~2020, one should keep in mind that the total amount of change over this time period should be multiplied by ~ 20: where a 2% decrease in extent may not seem relevant, a 40% decrease during the last 20 years can be quite alarming. The vertical gray line indicates no change. At the bottom of each plot, colored dots indicate rates of recent change per conservation status group when only one species has that value and black ticks identify the 5th and 95th quantile.
Fig. 2
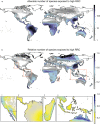
Fig. 2. Mapped tree species exposed to high rates of recent change (RRC).
a Absolute number of tree species on a log10 scale. b Fraction of local number of tree species that are exposed to high RRC compare. These species have been listed as priority species for IUCN Red List re-evaluation. Colors indicate the number of species’ extent overlapping per grid cell.
Fig. 3
Fig. 3. Hotspots of tree species that are highly exposed to each threat.
Burned area change and climate change maps combine species that are facing increases and decreases. Colors indicate the number of species’ extent overlapping per grid cell. A single threatened species is indicated in dark gray.
Fig. 4
Fig. 4. Stepwise overview of threat analysis.
The tree species presented, as an example, is Quercus frainetto. The species’ extent is defined as land area and suitable climate, in which threats are measured. Cropland expansion is used as an example to show the process for unidirectional threats to reach a rate of recent change value. Vapor pressure deficit (VPD) is used as an example to show the process for bidirectional threats to reach a rate of recent change value. mcp95 stands for minimum convex polygon using 95% of the occurrence records. Please note that we changed the resolution of the crop expansion layer for illustrative purposes.

References

    1. Lindenmayer DB, Laurance WF. The ecology, distribution, conservation and management of large old trees. Biol. Rev. 2017;92:1434–1458. doi: 10.1111/brv.12290. - DOI - PubMed
    1. Ellison AM, et al. Loss of foundation species: consequences for the structure and dynamics of forested ecosystems. Front. Ecol. Environ. 2005;3:479–486. doi: 10.1890/1540-9295(2005)003[0479:LOFSCF]2.0.CO;2. - DOI
    1. Newton, A. C. Ecosystem Collapse and Recovery. (Cambridge University Press. 10.1017/9781108561105 (2021).
    1. García-Robledo C, et al. The Erwin equation of biodiversity: From little steps to quantum leaps in the discovery of tropical insect diversity. Biotropica. 2020;52:590–597. doi: 10.1111/btp.12811. - DOI
    1. BGCI. State of the World’s Trees. https://www.bgci.org/wp/wp-content/uploads/2021/08/FINAL-GTAReportMedRes... (2021).

Publication types