. 2024 Jan 2;15(1):45.
doi: 10.1038/s41467-023-44364-y.

Fatty acid synthesis suppresses dietary polyunsaturated fatty acid use

Affiliations

Fatty acid synthesis suppresses dietary polyunsaturated fatty acid use

Anna Worthmann et al. Nat Commun. .

Abstract

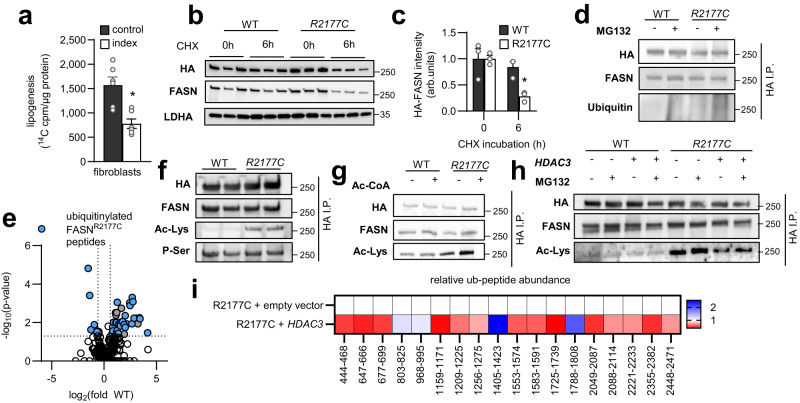
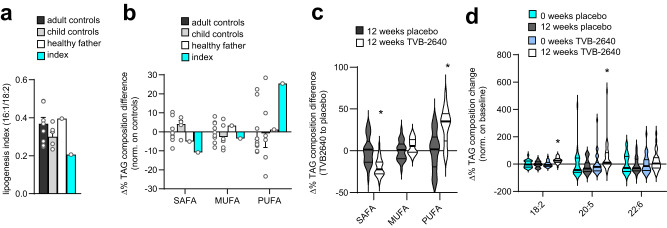
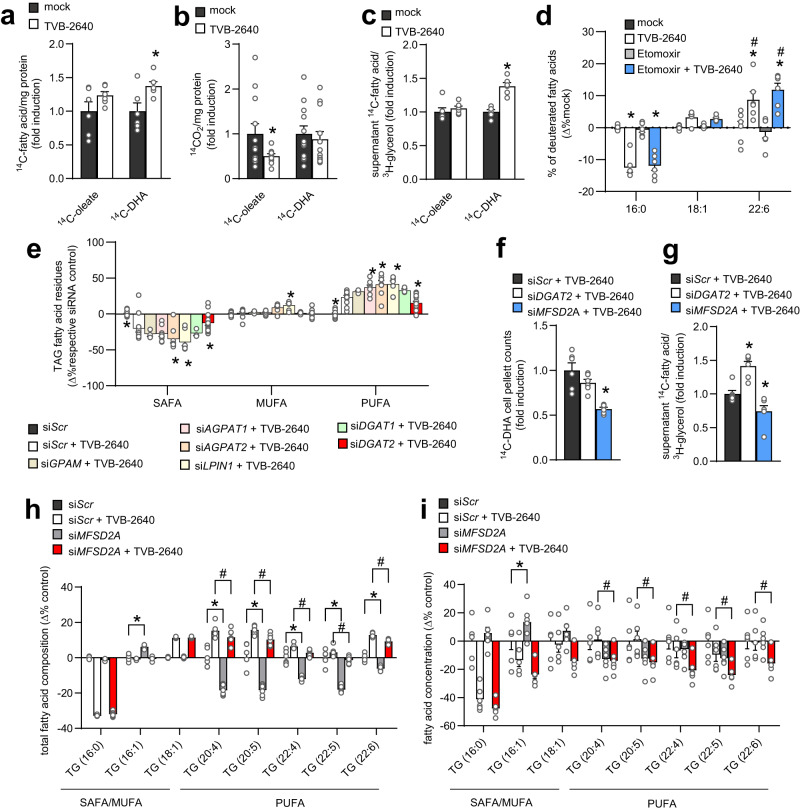
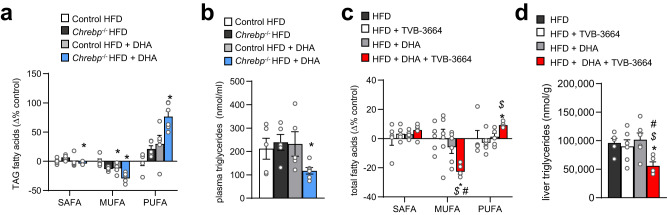
Dietary polyunsaturated fatty acids (PUFA) are increasingly recognized for their health benefits, whereas a high production of endogenous fatty acids - a process called de novo lipogenesis (DNL) - is closely linked to metabolic diseases. Determinants of PUFA incorporation into complex lipids are insufficiently understood and may influence the onset and progression of metabolic diseases. Here we show that fatty acid synthase (FASN), the key enzyme of DNL, critically determines the use of dietary PUFA in mice and humans. Moreover, the combination of FASN inhibition and PUFA-supplementation decreases liver triacylglycerols (TAG) in mice fed with high-fat diet. Mechanistically, FASN inhibition causes higher PUFA uptake via the lysophosphatidylcholine transporter MFSD2A, and a diacylglycerol O-acyltransferase 2 (DGAT2)-dependent incorporation of PUFA into TAG. Overall, the outcome of PUFA supplementation may depend on the degree of endogenous DNL and combining PUFA supplementation and FASN inhibition might be a promising approach to target metabolic disease.


Conflict of interest statement

M.O. is an employee of Sagimet. C.S. has been an invited speaker for Daiichi Sankyo. All other authors declared no conflicting interests.

Figures

Fig. 1
Fig. 1. Functional analysis of a FASNArg2177Cys variant.
a FASN activity in patient-derived fibroblasts (index) and age-and sex matched controls (control) estimated by incorporation of 14C-acetate into lipid fraction of fibroblasts (data are presented as mean ± SEM, n = 6, unpaired two-tailed Student’s t test *P = 0.0022). b Western Blot against HA, FASN and LDHA of cycloheximide (CHX) incubated HEK293T-cells expressing HA-tagged wild type FASN (WT) or HA-tagged patient variant R2177C-FASN (R2177C) and (c) western blot quantification (data are presented as mean ± SEM, n = 3, unpaired two-tailed Student’s t test *P = 0.0094). d Western blot against HA, FASN and ubiquitin of HA-immunoprecipitated (HA I.P.) HA-tagged wild-type FASN (WT) or HA-tagged R2177C FASN (R2177C) from overexpressing HEK293T-cells treated with (+) or without (−) the proteasome inhibitor MG132. (e) Volcano plot showing significantly differentially abundant ubiquitinylated peptides between immunoprecipitated FASN from WT (WT) and R2177C-FASN (FASNR2177) cells after incubation with MG132 (n = 4; two-way ANOVA highlighted are peptides with corresponding P-value < 0.05 and fold change difference > 1.5). f Western blot against HA, FASN, acetyl-lysine (Ac-Lys) and phospho-serine (P-Ser) of HA-tag immunoprecipitation (HA I.P.) in HEK293T cells overexpressing HA-tagged wild-type FASN (WT) or HA-tagged R2177C-FASN (R2117C) constructs. Western blots are representative picture of three independent experiments with the same result. g HA-tagged wild-type FASN (WT) or R2177C-FASN (R2177C) was overexpressed in HEK293T cells and after HA-immunoprecipitation (HA I.P.), WT and variant FASN was incubated with (+) or without (−) acetyl-CoA (Ac-CoA) in vitro for 6 h at 37 °C and western blot against HA, FASN, and acetyl-lysine (Ac-Lys) was performed. Western blots are representative picture of three independent experiments with the same result. h Western blots against HA, FASN and acetyl-lysine (Ac-Lys) of HA-tag immunoprecipitation (HA I.P.) in HEK293T cells expressing HA-tagged wild-type FASN (WT) or R2177C variant FASN (R2177) and HDAC3, a FASN deacetylase, co-treated with (+) or without (−) the proteasome inhibitor MG132. Western blots are representative picture of three independent experiments with the same result. i Ubiquitinylated FASN peptide abundance of immunoprecipitated R2177C-FASN overexpressed in HEK293T-cells in combination with a control (R2177C + empty vector) or HDAC3-vector (R2177C + HDAC3) (n = 4, data are shown as fold change vs. R2177C + empty vector). Source data are provided as a Source Data file.
Fig. 2
Fig. 2. Lipidomics of genetic and pharmacological FASN modulation.
a Plot of the DNL index, a marker to estimate the rate of DNL which is given as the ratio of (endogenously producible) palmitoleate (16:1) to strictly dietary linoleic acid (18:2) in plasma TAG in the index patient (index), his healthy father, a non-carrier, (healthy father) and adult (adult controls) and child controls (child controls) (data are presented as mean ± SEM for adult control (n = 9) and child controls (n = 6). b Differences in plasma TAG composition per each fatty acid class of the index patient (index) and different controls (adult controls, child controls, healthy father) (data are presented as mean ± SEM for adult control (n = 9) and child controls (n = 6). c Differences in plasma TAG composition per fatty acid class in NASH patients treated with 50 mg of the FASN inhibitor TVB-2640 compared to NASH patients receiving placebo for 12 weeks (data are shown as violin plot, n = 25 for placebo and n = 28 for TVB-2640, unpaired two-tailed Student’s t test, SAFA: *P = < 0.0001; PUFA: * P = < 0.0001. d Changes in omega-6 (18:2) and omega-3 (20:5; 22:6) fatty acid residues in the TAG fraction of plasma samples from NASH patients treated with placebo (12 weeks placebo) or 50 mg of the FASN inhibitor TVB-2640 (12 weeks TVB-2640) for 12 weeks compared to baseline (0 weeks placebo and 0 weeks TVB-2640) (data are shown as violin plot, n = 25 for placebo and n = 28 for TVB-2640, paired two-tailed Student’s t test, 18:2: * P < 0.0001; 20:5 *P = 0.0350. Source data are provided as a Source Data file.
Fig. 3
Fig. 3. Fatty acid preference in triacylglycerols is controlled by FASN, DGAT2 and MFSD2A.
a Fatty acid uptake assessed by scintillation counting of cell pellets from HuH7 cells pretreated with 500 nM of FASN inhibitor TVB-2640 (TVB-2640) or DMSO control (mock) for 24 h and incubated with radioactively labeled 14C-oleate or 14C-DHA for 4 h (data are shown as mean ± SEM; n = 6, unpaired two-tailed Student’s t test *P = 0.0235). b Fatty acid oxidation assessed by scintillation counting of 14C-CO2 released by HuH7 cells treated with TVB-2640 (TVB-2640) or control (mock) and radioactively labeled 14C-oleate or 14C-DHA (data are shown as mean ± SEM; n = 12, unpaired Student’s t test *P = 0.0440). c To stimulate lipoprotein secretion, HuH7 cells were loaded with oleate or DHA mixed with radioactively labeled tracers overnight and were incubated with or without FASN inhibitor TVB-2640. After lipid loading, cells were extensively washed and incubated with TVB-2640 (TVB-2640) or control (mock). Supernatant was collected 5 h after inhibition and lipid extract was counted via scintillation counting (data are shown as mean ± SEM; n = 6, unpaired two-tailed Student’s t test *P < 0.0001). d HuH7 cells were incubated with equimolar amounts of deuterated palmitate (16:0), oleate (18:1) and DHA (22:6) and incorporation of deuterated fatty acids into TAG was measured in supernatant of the cells as a marker for secreted lipoproteins in control-treated cells (mock) or cells treated with a FASN inhibitor (TVB-2640), with a beta-oxidation inhibitor (Etomoxir) or the combination of both (Etomoxir+ TVB-2640) (data are shown as mean ± SEM n = 6; two-way ANOVA and Fisher’s LSD test, (*) indicates significant differences versus respective mock, (#) indicates significant differences in 22:6 vs. respective group in 16:0 and 18:1 (16:0 TVB-2640: *P < 0.0001; 16:0 Etomoxir+ TVB-2640: *P < 0.0001; 22:6 TVB-2640 *P < 0.0001; 22:6 Etomoxir+TVB-2640: *P < 0.0001; 22:6 TVB-2640 vs. 16:0 TVB-2640: #P < 0.0001; 22:6 TVB-2640 vs. 18:1 TVB-2640: #P = 0.0078; 22:6 Etomoxir+ TVB-2640 vs. 16:0 Etomoxir +TVB-2640: #P < 0.0001; 22:6 Etomoxir + TVB-2640 vs. 18:1 Etomoxir +TVB-2640: # P < 0.0001. e TAG fatty acid class composition of HuH7 cells transfected with indicated siRNAs for 24 h and treated with TVB-2640 for another 24 h (data are shown as mean ± SEM; n = 12 for siScr, n = 12 for siScr + TVB-2640, n = 3 for siGPAM + TVB-2640, n = 9 for siGPAT1 + TVB-2640, n = 9 for siGPAT2 + TVB-2640, n = 8 for siLPIN1 + TVB-2640, n = 3 for siDGAT1 + TVB-2640, n = 15 for siDGAT2 + TVB-2640; two-way ANOVA and Fisher’s LSD test (*) indicates significant differences versus siScr + TVB-2640 (SAFA: siScr *P < 0.0001; siAGPAT2 + TVB-2640 *P = 0.001; siLPIN1 + TVB-2640 *P < 0.0001; siDGAT2 + TVB-2640 *P = 0.0382. MUFA: siLPIN1 + TVB-2640 *P = 0.0136. PUFA: siScr *P < 0.0001; siAGPAT1 + TVB-2640 *P = 0.0021; siAGPAT2 + TVB-2640 *P < 0.0001; siLPIN1 + TVB-2640 *P < 0.0001; siDGAT2 + TVB-2640 *P = 0.0292). f HuH7 cells were transfected with control siRNA (siScr) or siRNA against DGAT2 (siDGAT2) or MFSD2A (siMFSD2A), and treated with 14C-DHA as described in (c), and lipid extracts of cell pellets were counted via scintillation counting (data are shown as mean ± SEM; n = 6, one-way ANOVA Dunnett’s multiple comparisons test, (*) indicates significant differences versus siScr + TVB-2640: siMFSD2A + TVB-2640 *P < 0.0001). g HuH7 cells were transfected with control siRNA (siScr) or siRNA against DGAT2 (siDGAT2) or MFSD2A (siMFSD2A), and treated with 14C-DHA as described in (c), and lipid extracts of supernatants were counted via scintillation counting (data are shown as mean ± SEM; n = 6, one-way ANOVA with Dunnett’s multiple comparisons test, (*) indicates significant differences versus siScr + TVB-2640: siDGAT2 + TVB-2640 *P = 0.0014; siMFSD2A + TVB-2640 *P = 0.0324). h TAG fatty acid composition of HuH7 cells transfected with control (siScr) or MFSD2A siRNAs (siMFSD2A) for 24 h and treated without or with (+TVB-2640) for another 24 h (data are shown as mean ± SEM; n = 6, two-way ANOVA and Fisher’s LSD test, (*) indicates significant differences versus siScr and (#) versus siScr + TVB-2640; 16:1: siMSFD2A *P < 0.0001; 20:4: siMSFD2A *P < 0.0001, siMSFD2A + TVB-2640 #P = 0.0159; 20:5: siMSFD2A *P < 0.0001, siMSFD2A + TVB-2640 #P = 0.0005; 22:4: siMSFD2A *P < 0.0001, siMSFD2A + TVB-2640 #P = 0.0185; 22:5: siMSFD2A *P < 0.0001, siMSFD2A + TVB + 2640 #P = 0.0037; 22:6: siMSFD2A *P < 0.0001, siMSFD2A + TVB + 2640 #P = 0.0223). i Differences in TAG fatty acid concentrations of HuH7 cells transfected with control (siScr) or MFSD2A siRNAs (siMFSD2A) for 24 h and treated without or with TVB-2640 (+TVB-2640) for another 24 h (data are shown as mean ± SEM; n = 6, two-way ANOVA and Fisher’s LSD test, (*) indicates significant differences versus siScr and (#) versus siScr + TVB-2640; 16:1: siMSFD2A *P = 0.0414; 20:4: siMSFD2A + TVB-2640 #P = 0.0221; 20:5: siMSFD2A + TVB-2640 #P = 0.0133; 22:4: siMSFD2A + TVB-2640 #P = 0.0334; 22:5: siMSFD2A + TVB-2640 #P = 0.0288; 22:6: siMSFD2A + TVB-2640 #P = 0.0266). Source data are provided as a Source Data file.
Fig. 4
Fig. 4. Genetic or pharmacologic inhibition of DNL increases PUFA fatty acid composition in liver and positively affects DHA-supplementation therapy outcome.
a TAG fatty acid class composition of livers and (b) plasma TAG levels of 2 weeks HFD fed female Chrepb−/− mice (Chrepb−/− HFD, n = 5) or female wild type littermates (Control HFD, n = 5) without or with DHA supplementation for another week (Control HFD + DHA, n = 5; Chrepb−/− HFD + DHA, n = 6) (data are shown as mean ± SEM; two-way ANOVA and Fisher’s LSD test, with (*) indicates significant differences versus respective non-DHA-supplemented group. a SAFA: Chrepb−/− HFD + DHA *P = 0.0093; MUFA: Control HFD + DHA *P = 0.0241, Chrepb−/− HFD + DHA *P = 0.0031; PUFA: Chrepb−/− HFD + DHA *P = 0.0007. b Chrepb−/− HFD + DHA *P = 0.0306). c Liver fatty acid class profile and (d) liver TAG of male wild type mice fed a high-fat diet for two weeks and an additional week without or with DHA supplementation and receiving one week of daily TVB-2640 or control gavage (data are shown as mean ± SEM; n = 5 HFD, n = 6 HFD + TVB-3664, n = 6 HFD + DHA, n = 6 HFD + DHA + TVB-3664; significant differences were assessed using two-way ANOVA and Fisher’s LSD test with (*) indicating significant differences vs. HFD, ($) showing significant differences vs. HFD + TVB-3664, and (#) showing significant differences vs. HFD + DHA. c MUFA: *P = 0.0024; $ P = 0.0015; # P = 0.0141; PUFA: *P = 0.0459; $ P = 0.0087. d *P = 0.0159 $ P = 0.0293; # P = 0.0053). Source data are provided as a Source Data file.

References

    1. Postic C, Girard J. Contribution of de novo fatty acid synthesis to hepatic steatosis and insulin resistance: lessons from genetically engineered mice. J. Clin. Invest. 2008;118:829–838. doi: 10.1172/JCI34275. - DOI - PMC - PubMed
    1. Perry RJ, Samuel VT, Petersen KF, Shulman GI. The role of hepatic lipids in hepatic insulin resistance and type 2 diabetes. Nature. 2014;510:84–91. doi: 10.1038/nature13478. - DOI - PMC - PubMed
    1. Chong MF, Fielding BA, Frayn KN. Metabolic interaction of dietary sugars and plasma lipids with a focus on mechanisms and de novo lipogenesis. Proc. Nutr. Soc. 2007;66:52–59. doi: 10.1017/S0029665107005290. - DOI - PubMed
    1. Palmisano BT, Zhu L, Stafford JM. Role of estrogens in the regulation of liver lipid metabolism. Adv. Exp. Med. Biol. 2017;1043:227–256. doi: 10.1007/978-3-319-70178-3_12. - DOI - PMC - PubMed
    1. Yao X, et al. Regulation of fatty acid composition and lipid storage by thyroid hormone in mouse liver. Cell Biosci. 2014;4:38. doi: 10.1186/2045-3701-4-38. - DOI - PMC - PubMed

Publication types